| Param | Original file | Final file |
|---|---|---|
| Filename | modeM0/AS1A03_039T01_9000001462_10163cztM0_level2.evt | modeM0/AS1A03_039T01_9000001462_10163cztM0_level2_quad_clean.evt |
| Size (bytes) | 439,643,520 | 89,565,120 |
| Size | 419.3 MB | 85.4 MB |
| Events in quadrant A | 2,915,991 | 570,892 |
| Events in quadrant B | 3,198,621 | 576,644 |
| Events in quadrant C | 2,801,781 | 572,008 |
| Events in quadrant D | 3,958,659 | 541,703 |
| Mode SS | |||
|---|---|---|---|
| Quadrant | BADHDUFLAG | Total packets | Discarded packets |
| A | 0 | 130 | 0 |
| B | 0 | 130 | 0 |
| C | 0 | 130 | 0 |
| D | 0 | 130 | 0 |
| Mode M0 | |||
|---|---|---|---|
| Quadrant | BADHDUFLAG | Total packets | Discarded packets |
| A | 0 | 13215 | 2 |
| B | 0 | 13824 | 1 |
| C | 0 | 13143 | 1 |
| D | 0 | 15980 | 1 |
| Mode M9 | |||
|---|---|---|---|
| Quadrant | BADHDUFLAG | Total packets | Discarded packets |
| A | 0 | 9 | 0 |
| B | 0 | 9 | 0 |
| C | 0 | 9 | 0 |
| D | 0 | 9 | 0 |
| Quadrant | Total seconds | Saturated seconds | Saturation percentage |
|---|---|---|---|
| A | 6470 | 15 | 0.231839% |
| B | 6470 | 40 | 0.618238% |
| C | 6470 | 6 | 0.092736% |
| D | 6470 | 127 | 1.962906% |
Noise dominated data is calculated using 1-second bins in cleaned event files. If a bin has >2000 counts, and if more than 50% of those come from <1% of pixels, then it is considered to be noise-dominated and hence unusable.
| Quadrant | # 1 sec bins | Bins with >0 counts | Bins with >2000 counts | High rate bins dominated by noise | Noise dominated (total time) | Noise dominated (detector-on time) | Marked lightcurve |
|---|---|---|---|---|---|---|---|
| A | 7360 | 6471 | 0 | 0 | 0.00% | 0.00% | 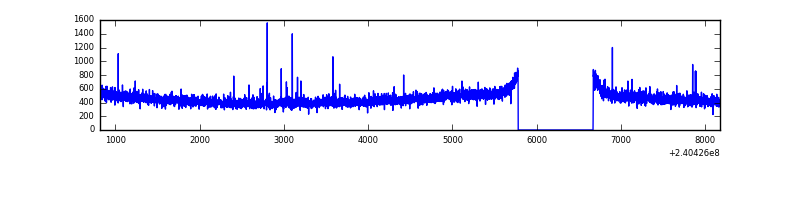 |
| B | 7360 | 6471 | 1 | 1 | 0.01% | 0.02% | 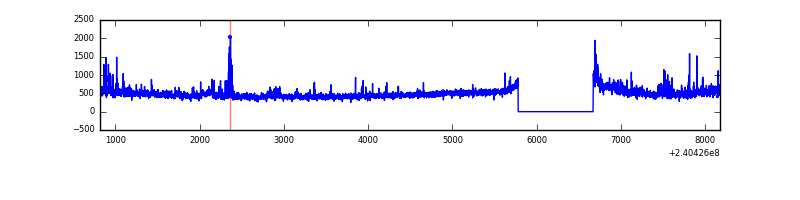 |
| C | 7360 | 6471 | 0 | 0 | 0.00% | 0.00% | 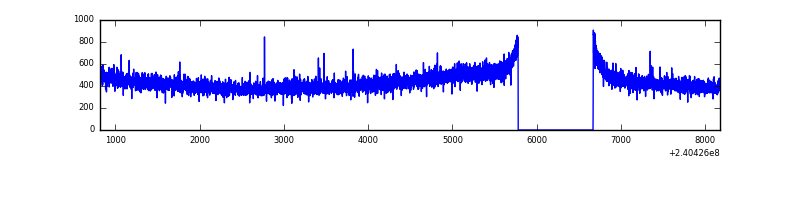 |
| D | 7360 | 6471 | 92 | 92 | 1.25% | 1.42% | 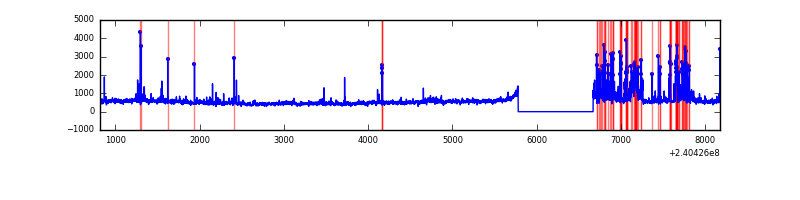 |
Top three noisy pixels from each quadrant. If the there are fewer than three noisy pixels in the level2.evt file, extra rows are filled as -1
| Pixel properties | Quadrant properties | ||||||
|---|---|---|---|---|---|---|---|
| Quadrant | DetID | PixID | Counts | Sigma | Mean | Median | Sigma |
| A | 8 | 15 | 9607 | 58.44 | 749 | 734 | 151.8 |
| A | 15 | 223 | 7240 | 42.85 | 749 | 734 | 151.8 |
| A | 0 | 226 | 6870 | 40.41 | 749 | 734 | 151.8 |
| B | 0 | 219 | 72508 | 499.95 | 752 | 733 | 143.6 |
| B | 11 | 51 | 48961 | 335.93 | 752 | 733 | 143.6 |
| B | 4 | 173 | 35105 | 239.42 | 752 | 733 | 143.6 |
| C | 13 | 61 | 5463 | 28.43 | 718 | 722 | 166.8 |
| C | 14 | 67 | 2486 | 10.58 | 718 | 722 | 166.8 |
| C | 3 | 202 | 1746 | 6.14 | 718 | 722 | 166.8 |
| D | 8 | 195 | 593163 | 3425.4 | 712 | 690 | 173.0 |
| D | 7 | 71 | 226457 | 1305.28 | 712 | 690 | 173.0 |
| D | 5 | 222 | 175653 | 1011.55 | 712 | 690 | 173.0 |
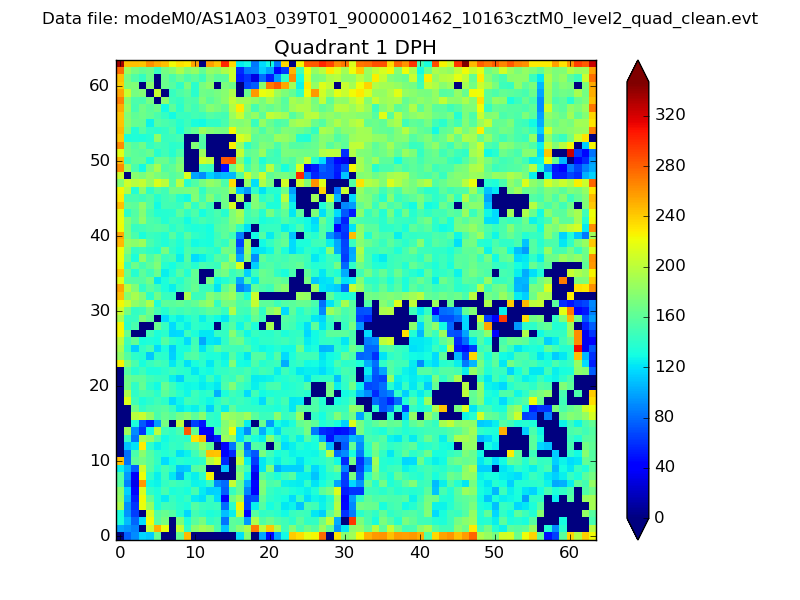
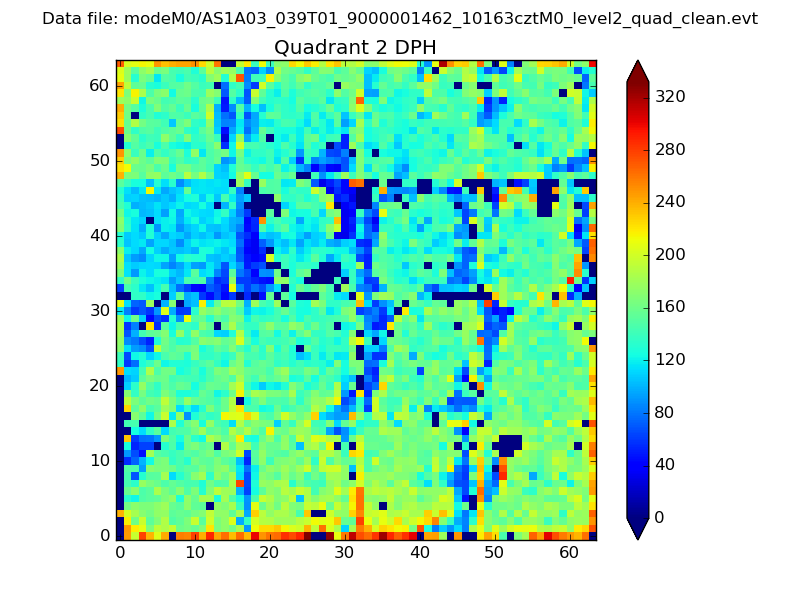
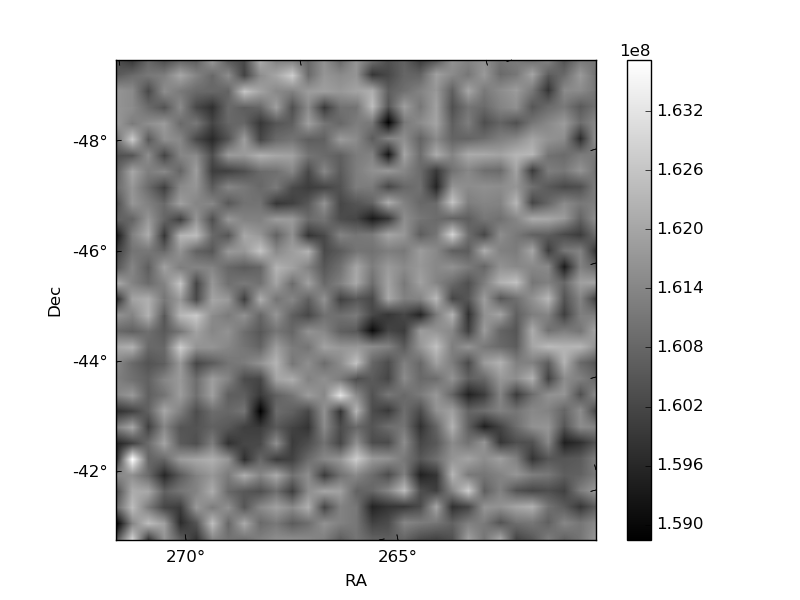
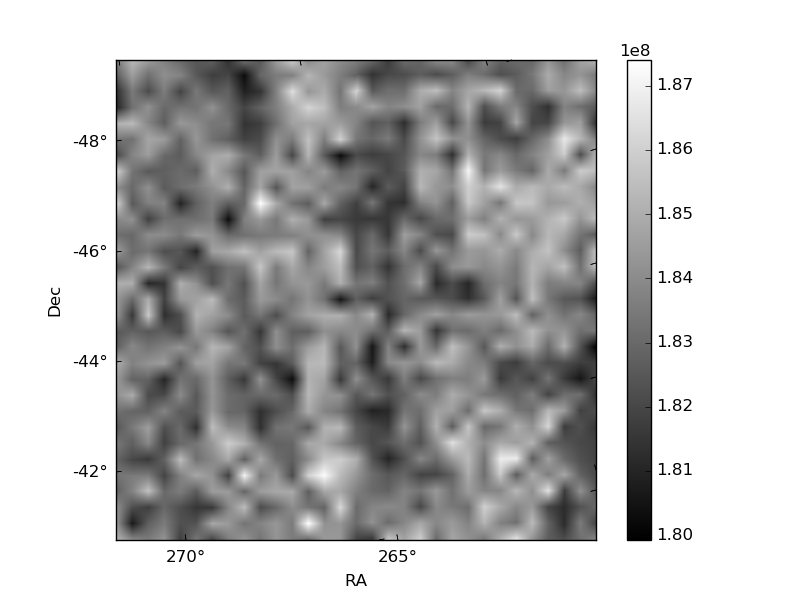
Histogram calculated using DETX and DETY for each event in the final _common_clean file
| Quadrant A |  |
 |
Quadrant B |
|---|---|---|---|
| Quadrant D |  |
 |
Quadrant C |
| Plot type | Count rate plots | Images |
|---|---|---|
| Comparison with Poisson distribution Blue bars denote a histogram of data divided into 1 sec bins. Red curve is a Poisson curve with rate = median count rate of data. |
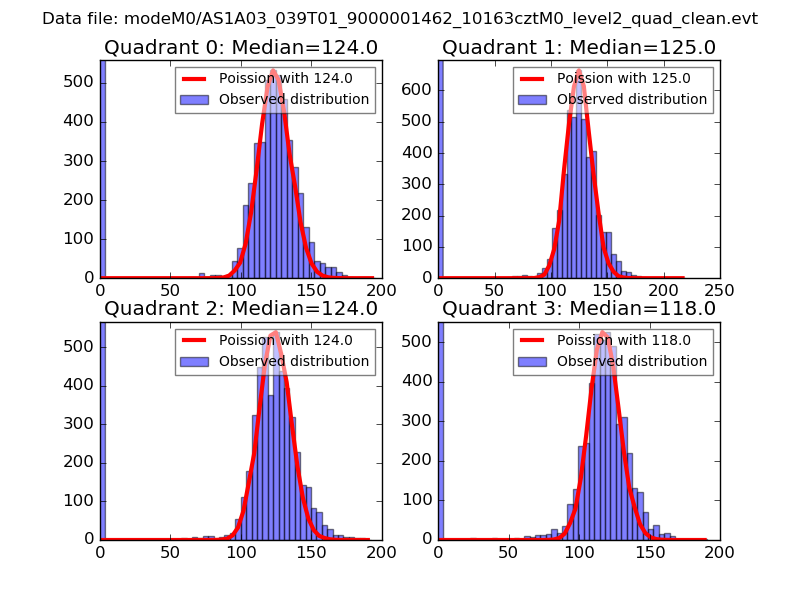 |
 |
| Quadrant-wise count rates Data is divided into 100 sec bins |
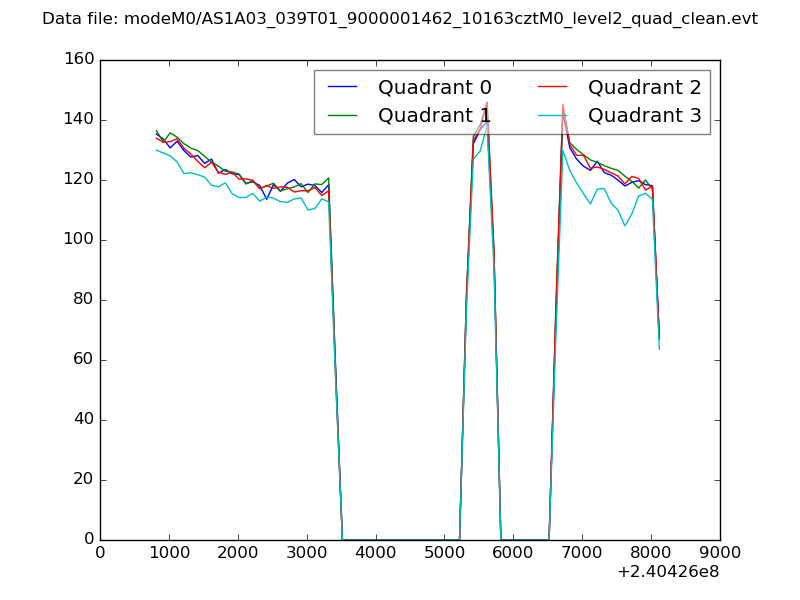 |
|
| Module-wise count rates for Quadrant A Data is divided into 100 sec bins |
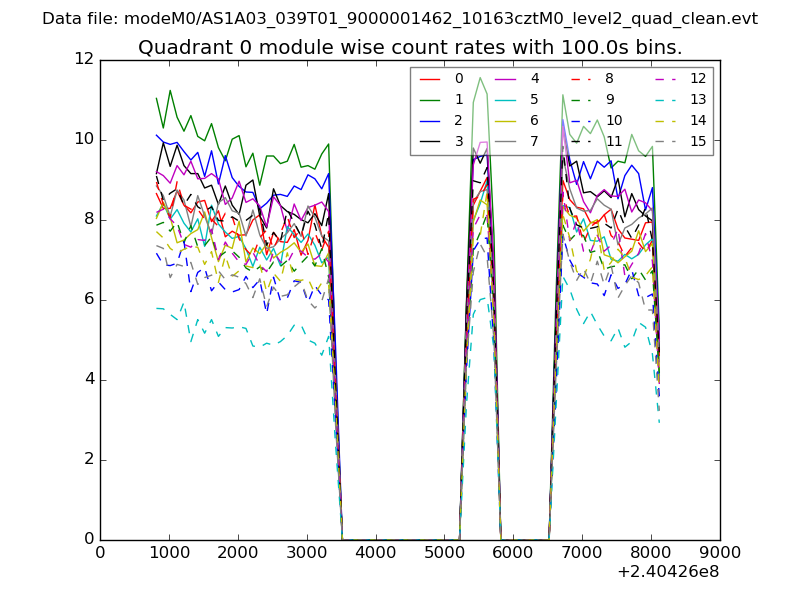 |
 |
| Module-wise count rates for Quadrant B Data is divided into 100 sec bins |
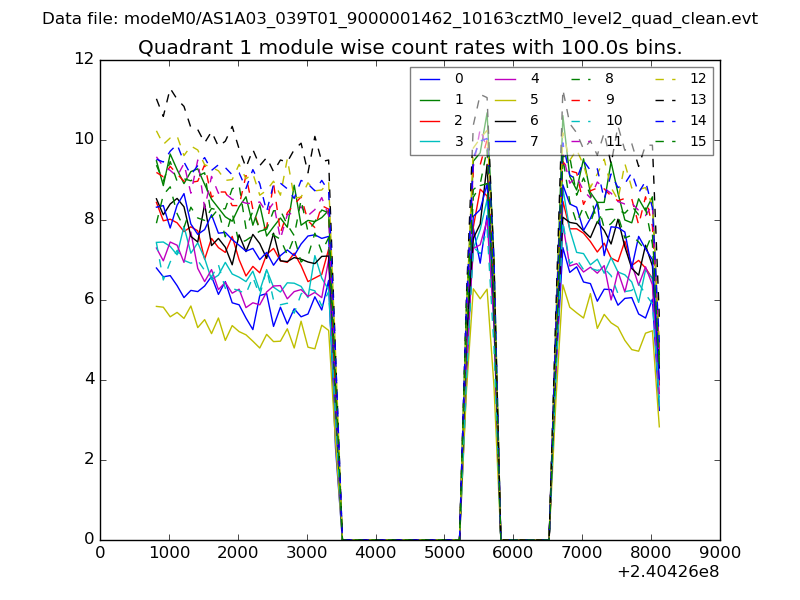 |
 |
| Module-wise count rates for Quadrant C Data is divided into 100 sec bins |
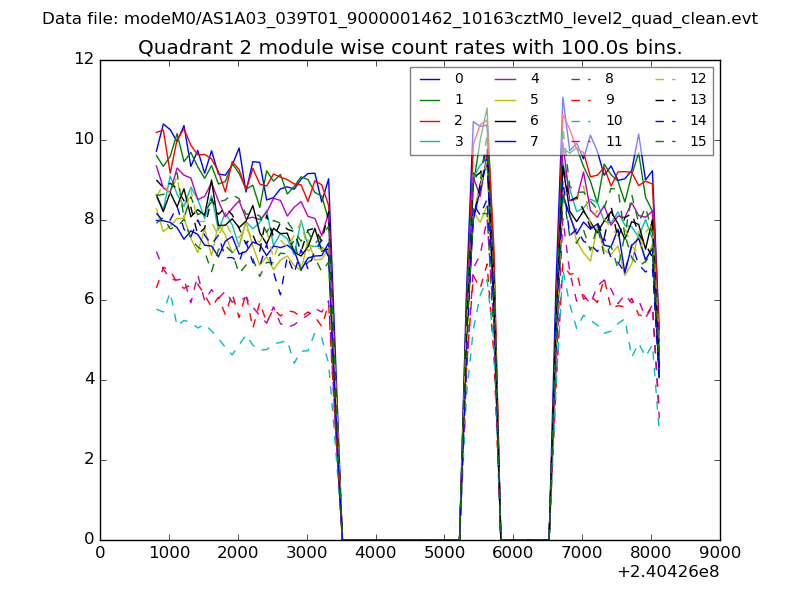 |
 |
| Module-wise count rates for Quadrant D Data is divided into 100 sec bins |
 |
 |
| Parameter | Plot |
|---|---|
| CZT HV Monitor | 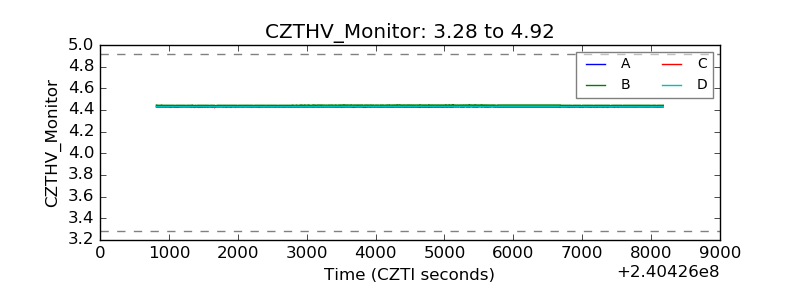 |
| D_VDD | 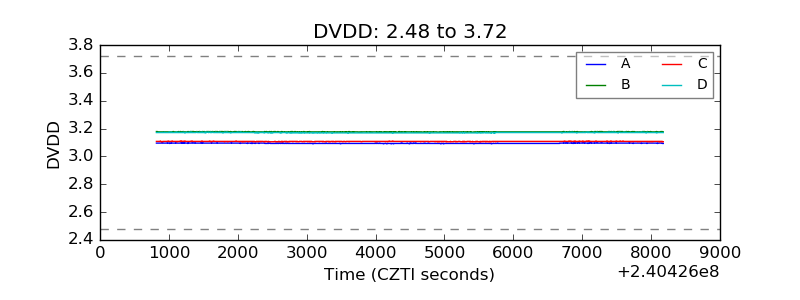 |
| Temperature 1 | 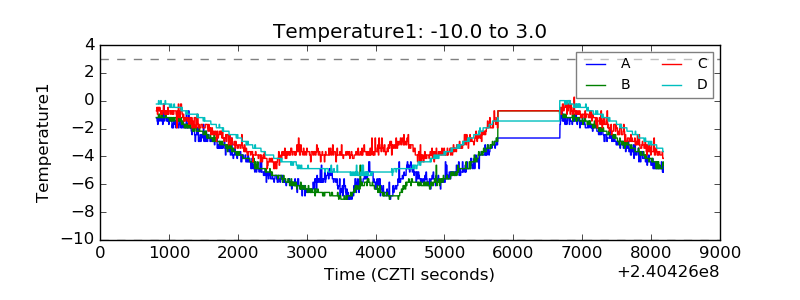 |
| Veto HV Monitor | 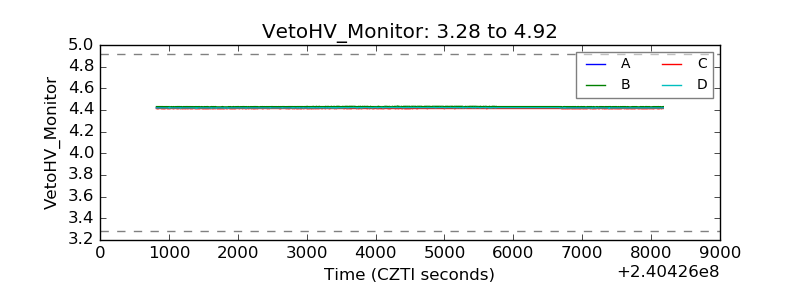 |
| Veto LLD | 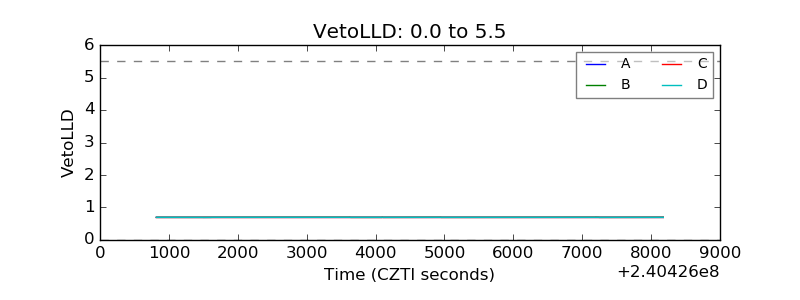 |
| Alpha Counter | 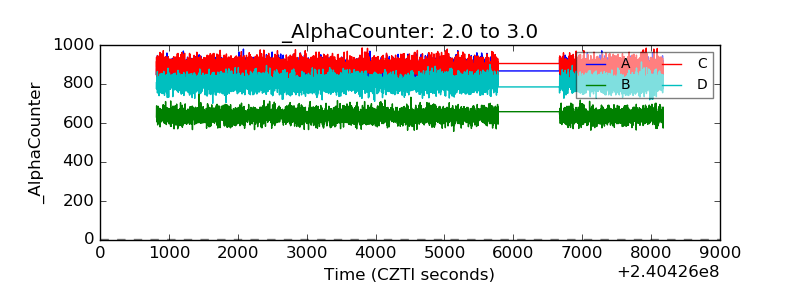 |
| _CPM_Rate | 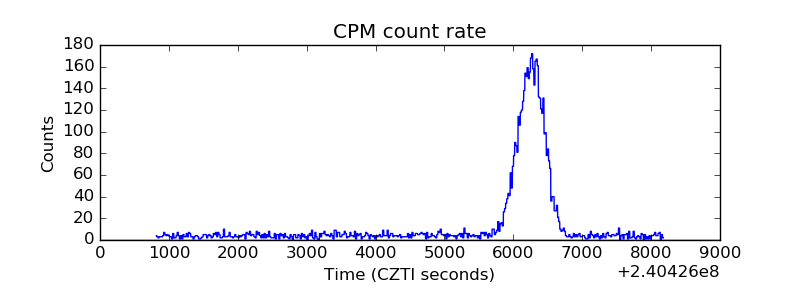 |
| CZT Counter | 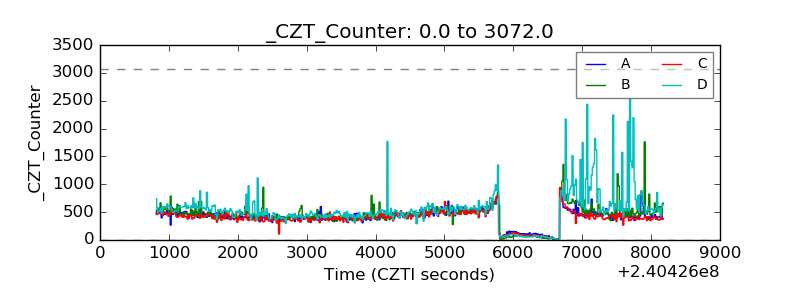 |
| +2.5 Volts monitor | 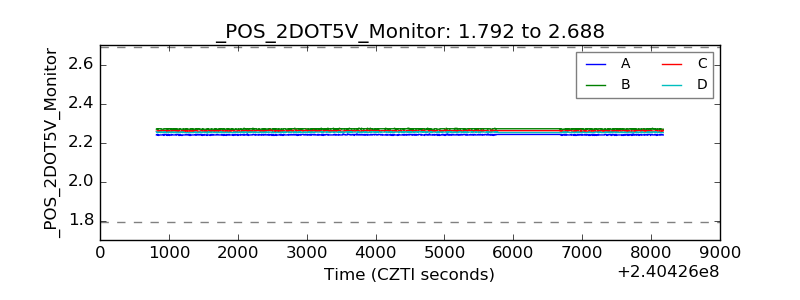 |
| +5 Volts monitor | 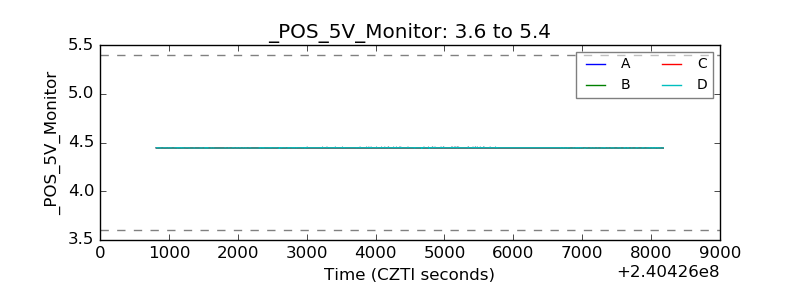 |
| _ROLL_ROT | 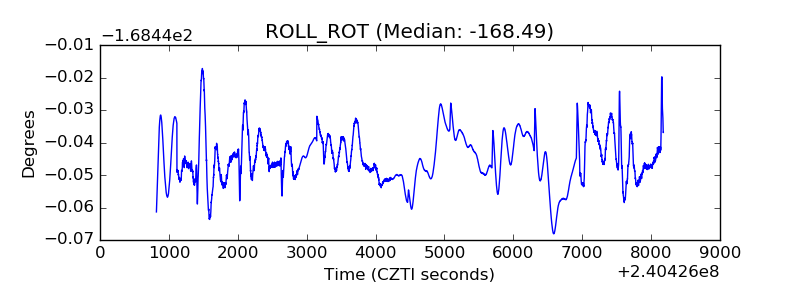 |
| _Roll_DEC | 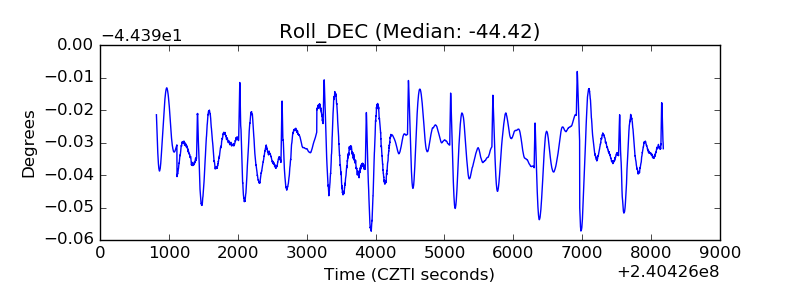 |
| _Roll_RA | 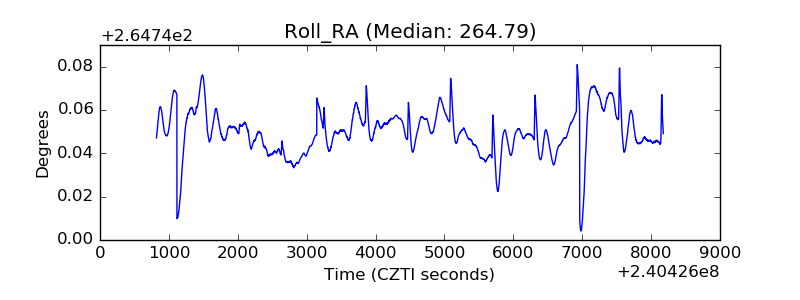 |
| Veto Counter |  |