| Param | Original file | Final file |
|---|---|---|
| Filename | modeM0/AS1A03_133T01_9000001464cztM0_level2.fits | modeM0/AS1A03_133T01_9000001464cztM0_level2_quad_clean.evt |
| Size (bytes) | 1,011,648,960 | 1,064,240,640 |
| Size | 964.8 MB | 1014.9 MB |
| Events in quadrant A | 6,122,936 | 6,500,465 |
| Events in quadrant B | 5,869,096 | 6,432,392 |
| Events in quadrant C | 6,014,510 | 6,248,238 |
| Events in quadrant D | 5,170,600 | 5,591,576 |
| Mode SS | |||
|---|---|---|---|
| Quadrant | BADHDUFLAG | Total packets | Discarded packets |
| A | 0 | 2224 | 0 |
| B | 0 | 2276 | 0 |
| C | 0 | 2224 | 0 |
| D | 0 | 2276 | 0 |
| Mode M0 | |||
|---|---|---|---|
| Quadrant | BADHDUFLAG | Total packets | Discarded packets |
| A | 0 | 228937 | 0 |
| B | 0 | 236451 | 0 |
| C | 0 | 222639 | 0 |
| D | 0 | 288564 | 0 |
| Mode M9 | |||
|---|---|---|---|
| Quadrant | BADHDUFLAG | Total packets | Discarded packets |
| A | 0 | 166 | 0 |
| B | 0 | 166 | 0 |
| C | 0 | 166 | 0 |
| D | 0 | 166 | 0 |
| Quadrant | Total seconds | Saturated seconds | Saturation percentage |
|---|---|---|---|
| A | 108778 | 1108 | 1.018588% |
| B | 108667 | 1273 | 1.171469% |
| C | 108761 | 639 | 0.587527% |
| D | 108739 | 2654 | 2.440707% |
Noise dominated data is calculated using 1-second bins in cleaned event files. If a bin has >2000 counts, and if more than 50% of those come from <1% of pixels, then it is considered to be noise-dominated and hence unusable.
| Quadrant | # 1 sec bins | Bins with >0 counts | Bins with >2000 counts | High rate bins dominated by noise | Noise dominated (total time) | Noise dominated (detector-on time) | Marked lightcurve |
|---|---|---|---|---|---|---|---|
| A | 131230 | 109098 | 0 | 0 | 0.00% | 0.00% | 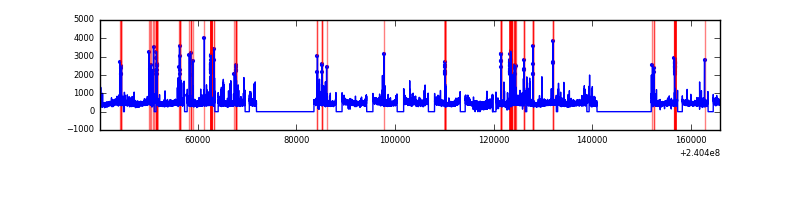 |
| B | 131230 | 109013 | 0 | 0 | 0.00% | 0.00% |  |
| C | 131230 | 109093 | 0 | 0 | 0.00% | 0.00% |  |
| D | 131230 | 108844 | 0 | 0 | 0.00% | 0.00% |  |
Top three noisy pixels from each quadrant. If the there are fewer than three noisy pixels in the level2.evt file, extra rows are filled as -1
| Pixel properties | Quadrant properties | ||||||
|---|---|---|---|---|---|---|---|
| Quadrant | DetID | PixID | Counts | Sigma | Mean | Median | Sigma |
| A | 0 | 29 | 5967 | 11.25 | 1594 | 1489 | 397.9 |
| A | 7 | 110 | 5102 | 9.08 | 1594 | 1489 | 397.9 |
| A | 0 | 30 | 4739 | 8.17 | 1594 | 1489 | 397.9 |
| B | 2 | 9 | 5072 | 11.9 | 1551 | 1476 | 302.2 |
| B | 3 | 17 | 4025 | 8.43 | 1551 | 1476 | 302.2 |
| B | 12 | 226 | 3972 | 8.26 | 1551 | 1476 | 302.2 |
| C | 12 | 241 | 4233 | 6.72 | 1588 | 1475 | 410.1 |
| C | 7 | 111 | 3970 | 6.08 | 1588 | 1475 | 410.1 |
| C | 2 | 191 | 3926 | 5.98 | 1588 | 1475 | 410.1 |
| D | 3 | 14 | 3896 | 6.46 | 1475 | 1340 | 395.5 |
| D | 6 | 231 | 3773 | 6.15 | 1475 | 1340 | 395.5 |
| D | 3 | 31 | 3615 | 5.75 | 1475 | 1340 | 395.5 |
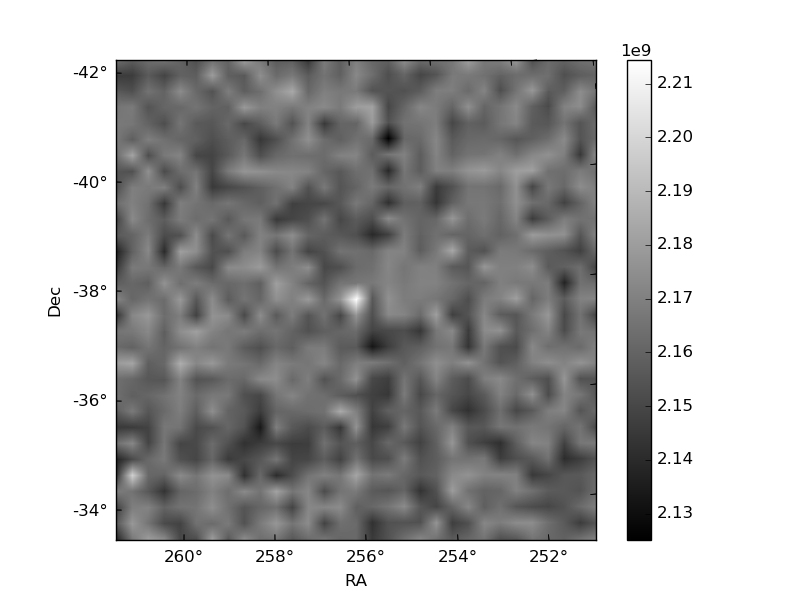
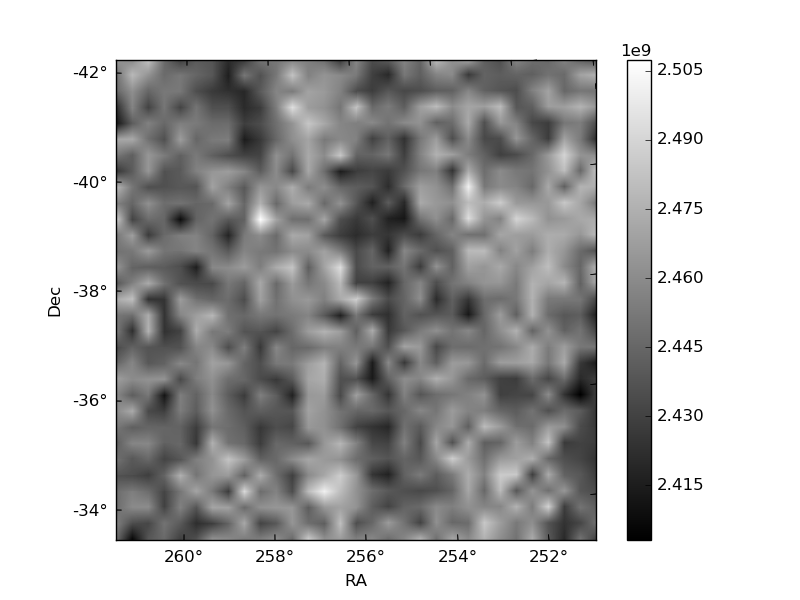
Histogram calculated using DETX and DETY for each event in the final _common_clean file
| Quadrant A | 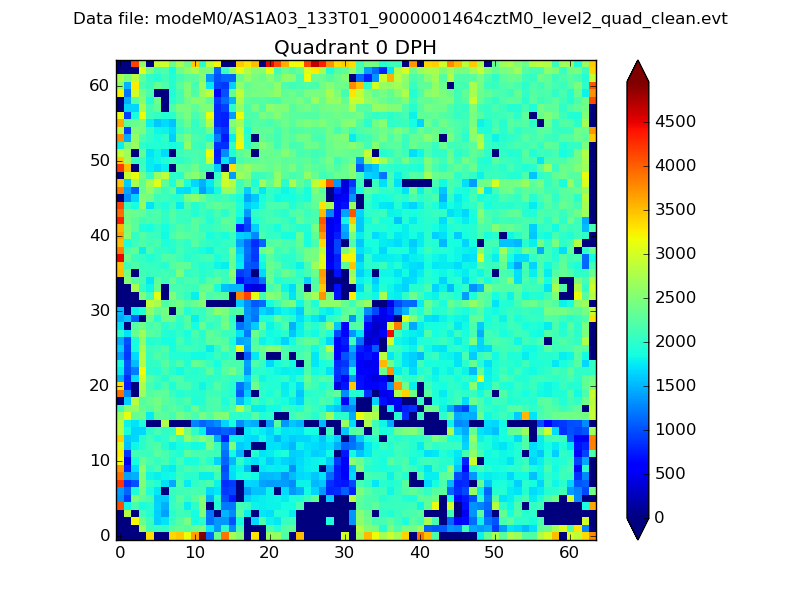 |
 |
Quadrant B |
|---|---|---|---|
| Quadrant D |  |
 |
Quadrant C |
| Plot type | Count rate plots | Images |
|---|---|---|
| Comparison with Poisson distribution Blue bars denote a histogram of data divided into 1 sec bins. Red curve is a Poisson curve with rate = median count rate of data. |
 |
 |
| Quadrant-wise count rates Data is divided into 100 sec bins |
 |
|
| Module-wise count rates for Quadrant A Data is divided into 100 sec bins |
 |
 |
| Module-wise count rates for Quadrant B Data is divided into 100 sec bins |
 |
 |
| Module-wise count rates for Quadrant C Data is divided into 100 sec bins |
 |
 |
| Module-wise count rates for Quadrant D Data is divided into 100 sec bins |
 |
 |
| Parameter | Plot |
|---|---|
| CZT HV Monitor |  |
| D_VDD | 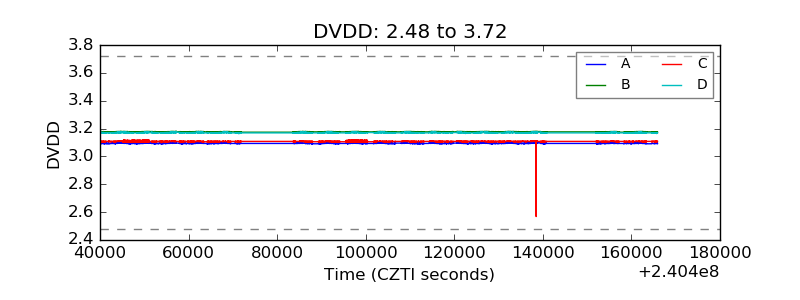 |
| Temperature 1 |  |
| Veto HV Monitor | 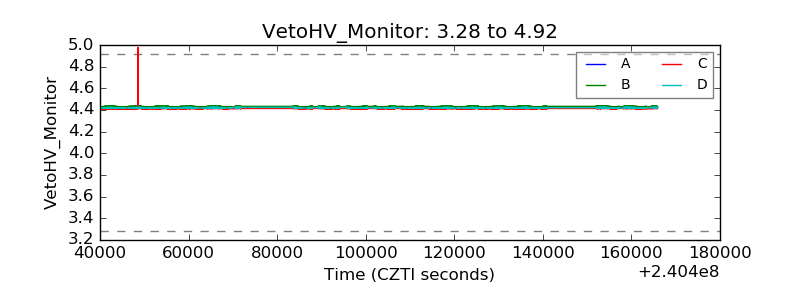 |
| Veto LLD | 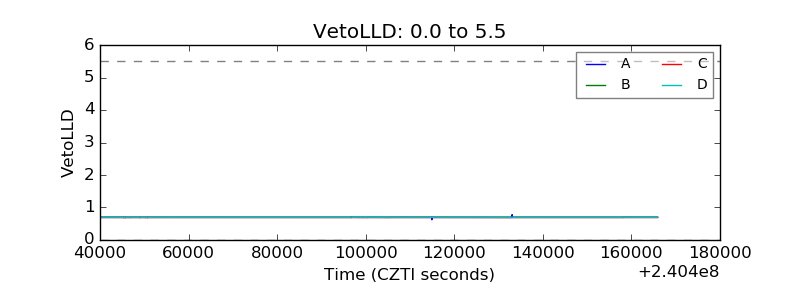 |
| Alpha Counter |  |
| _CPM_Rate |  |
| CZT Counter |  |
| +2.5 Volts monitor |  |
| +5 Volts monitor |  |
| _ROLL_ROT | 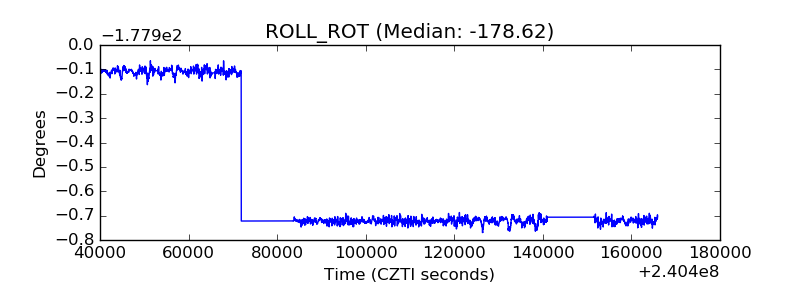 |
| _Roll_DEC |  |
| _Roll_RA |  |
| Veto Counter |  |