| Param | Original file | Final file |
|---|---|---|
| Filename | modeM0/AS1A03_133T01_9000001464_10164cztM0_level2.evt | modeM0/AS1A03_133T01_9000001464_10164cztM0_level2_quad_clean.evt |
| Size (bytes) | 339,341,760 | 57,473,280 |
| Size | 323.6 MB | 54.8 MB |
| Events in quadrant A | 2,171,759 | 362,481 |
| Events in quadrant B | 2,278,454 | 365,929 |
| Events in quadrant C | 2,078,835 | 362,021 |
| Events in quadrant D | 3,438,738 | 330,666 |
| Mode SS | |||
|---|---|---|---|
| Quadrant | BADHDUFLAG | Total packets | Discarded packets |
| A | 0 | 94 | 0 |
| B | 0 | 94 | 0 |
| C | 0 | 94 | 0 |
| D | 0 | 94 | 0 |
| Mode M0 | |||
|---|---|---|---|
| Quadrant | BADHDUFLAG | Total packets | Discarded packets |
| A | 0 | 9424 | 2 |
| B | 0 | 9757 | 1 |
| C | 0 | 9306 | 1 |
| D | 0 | 13337 | 1 |
| Mode M9 | |||
|---|---|---|---|
| Quadrant | BADHDUFLAG | Total packets | Discarded packets |
| A | 0 | 4 | 0 |
| B | 0 | 4 | 0 |
| C | 0 | 4 | 0 |
| D | 0 | 4 | 0 |
| Quadrant | Total seconds | Saturated seconds | Saturation percentage |
|---|---|---|---|
| A | 4532 | 46 | 1.015004% |
| B | 4532 | 43 | 0.948808% |
| C | 4532 | 11 | 0.242718% |
| D | 4532 | 304 | 6.707855% |
Noise dominated data is calculated using 1-second bins in cleaned event files. If a bin has >2000 counts, and if more than 50% of those come from <1% of pixels, then it is considered to be noise-dominated and hence unusable.
| Quadrant | # 1 sec bins | Bins with >0 counts | Bins with >2000 counts | High rate bins dominated by noise | Noise dominated (total time) | Noise dominated (detector-on time) | Marked lightcurve |
|---|---|---|---|---|---|---|---|
| A | 4977 | 4533 | 1 | 1 | 0.02% | 0.02% | 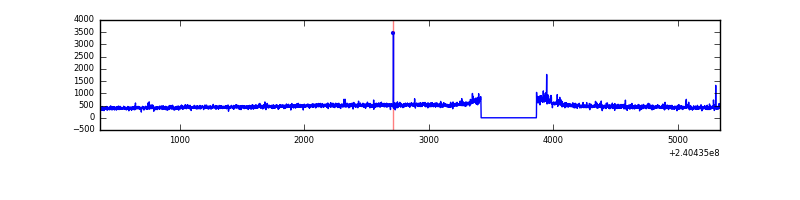 |
| B | 4977 | 4533 | 1 | 1 | 0.02% | 0.02% | 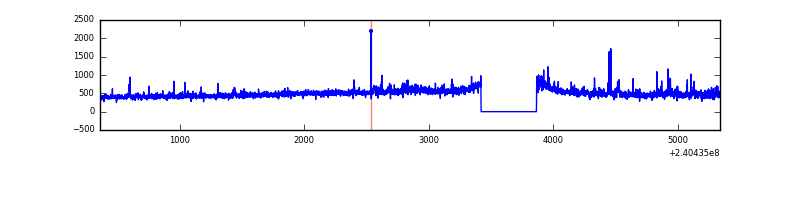 |
| C | 4977 | 4533 | 0 | 0 | 0.00% | 0.00% | 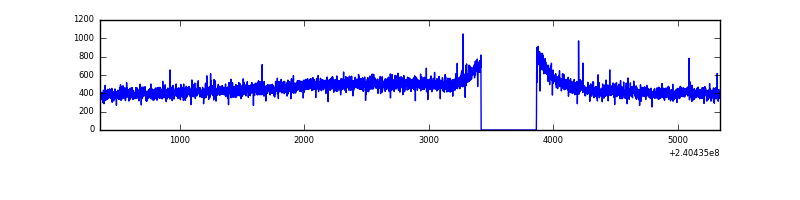 |
| D | 4977 | 4533 | 276 | 276 | 5.55% | 6.09% | 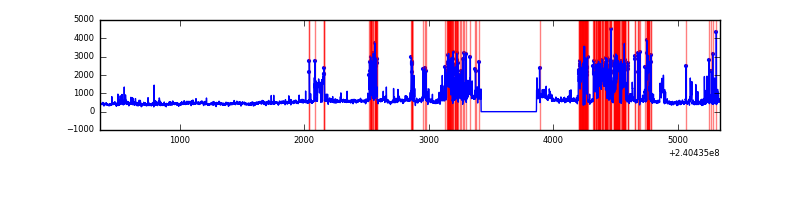 |
Top three noisy pixels from each quadrant. If the there are fewer than three noisy pixels in the level2.evt file, extra rows are filled as -1
| Pixel properties | Quadrant properties | ||||||
|---|---|---|---|---|---|---|---|
| Quadrant | DetID | PixID | Counts | Sigma | Mean | Median | Sigma |
| A | 15 | 174 | 18184 | 155.49 | 549 | 537 | 113.5 |
| A | 8 | 15 | 10910 | 91.4 | 549 | 537 | 113.5 |
| A | 1 | 162 | 9210 | 76.42 | 549 | 537 | 113.5 |
| B | 11 | 51 | 36184 | 334.51 | 550 | 536 | 106.6 |
| B | 0 | 214 | 33499 | 309.31 | 550 | 536 | 106.6 |
| B | 5 | 255 | 19774 | 180.52 | 550 | 536 | 106.6 |
| C | 13 | 61 | 3949 | 27.53 | 531 | 533 | 124.1 |
| C | 14 | 67 | 2485 | 15.73 | 531 | 533 | 124.1 |
| C | 14 | 234 | 2370 | 14.8 | 531 | 533 | 124.1 |
| D | 1 | 52 | 660404 | 5246.52 | 518 | 502 | 125.8 |
| D | 8 | 195 | 331549 | 2631.98 | 518 | 502 | 125.8 |
| D | 4 | 95 | 250587 | 1988.29 | 518 | 502 | 125.8 |
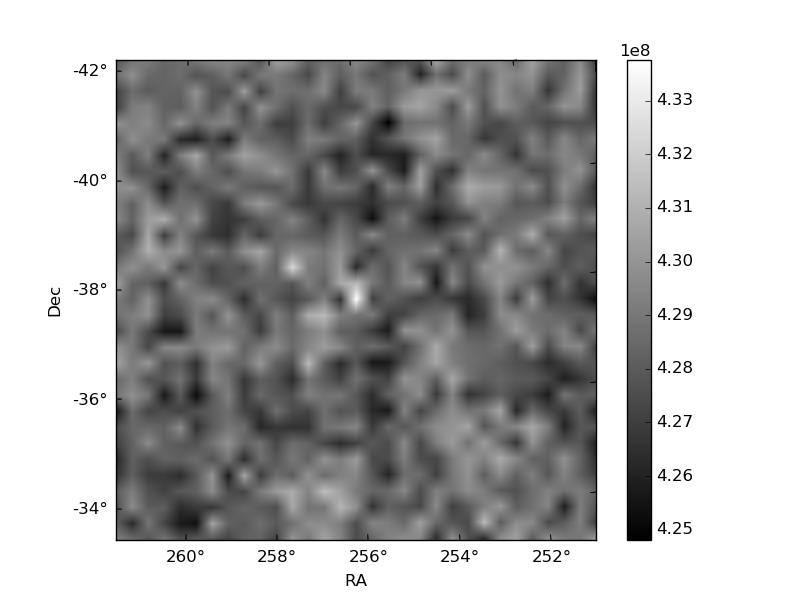
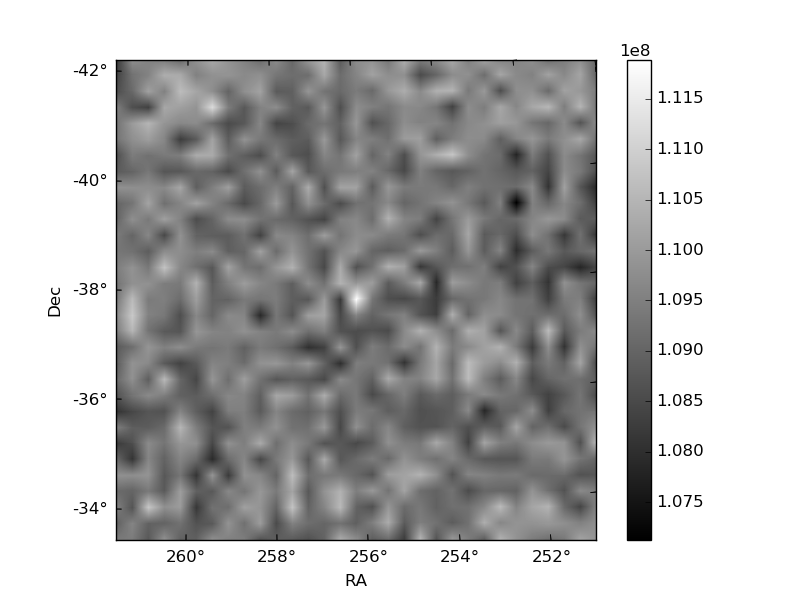
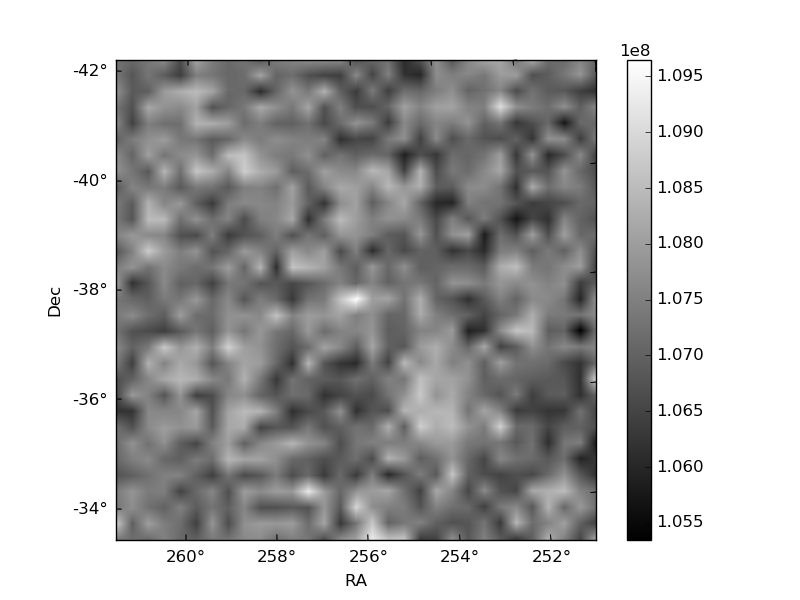
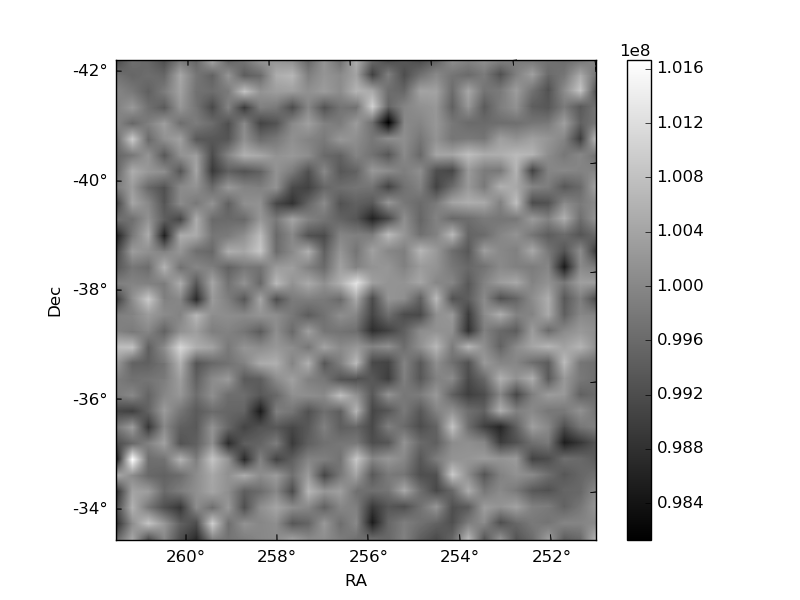
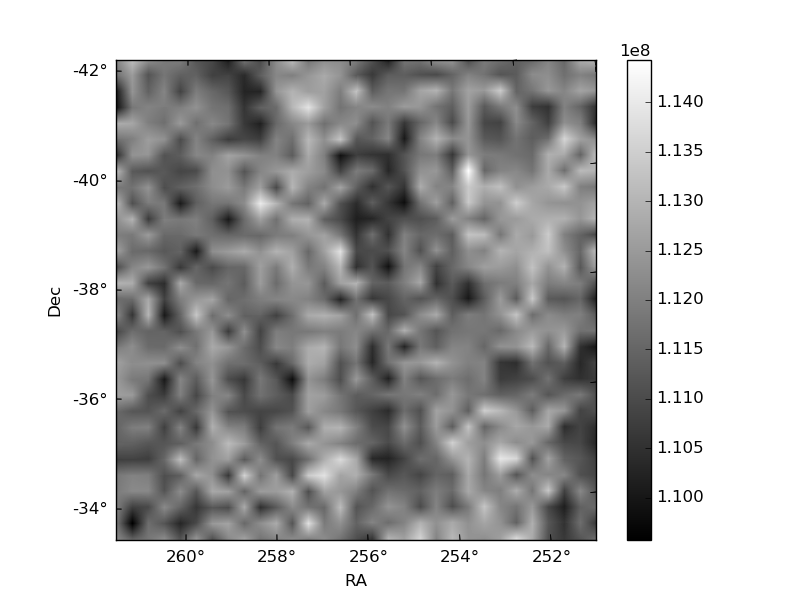
Histogram calculated using DETX and DETY for each event in the final _common_clean file
| Quadrant A | 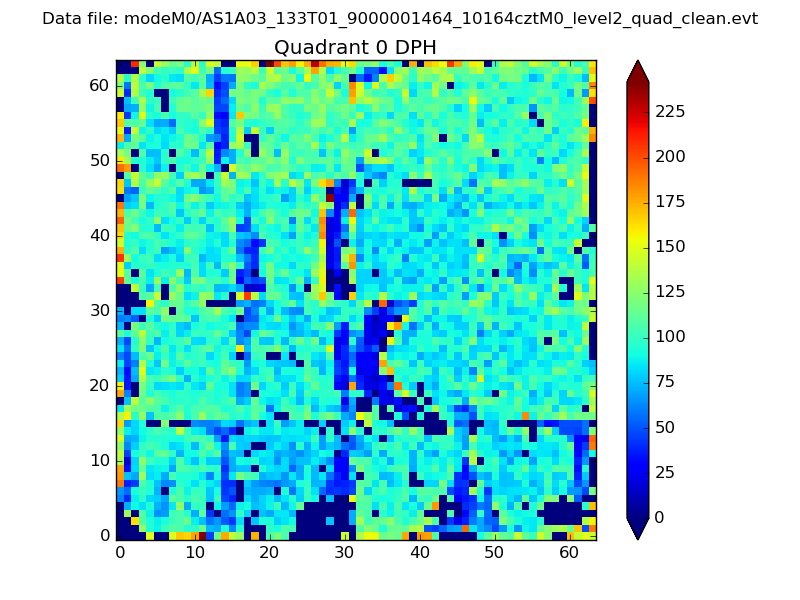 |
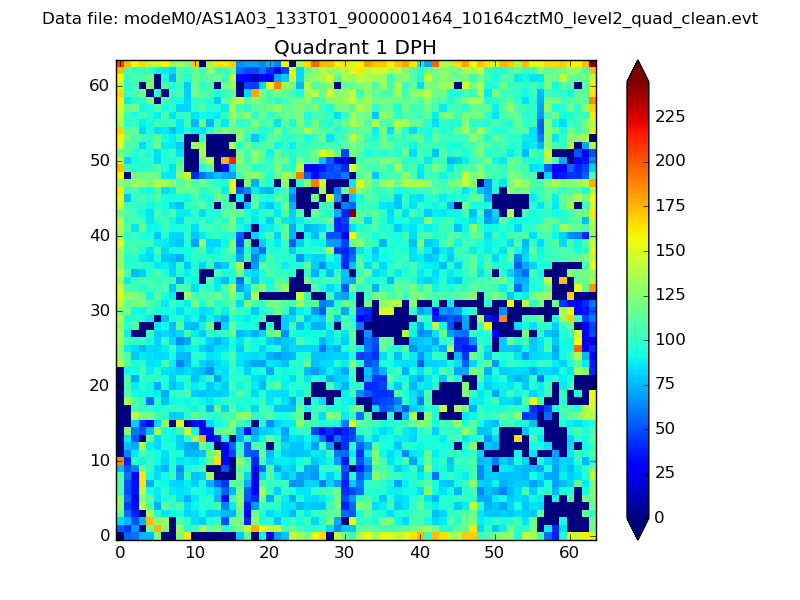 |
Quadrant B |
|---|---|---|---|
| Quadrant D | 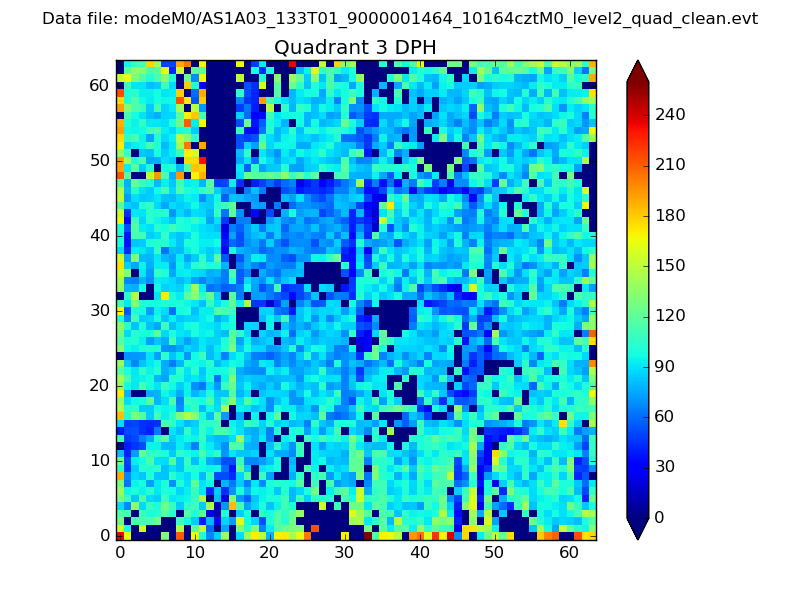 |
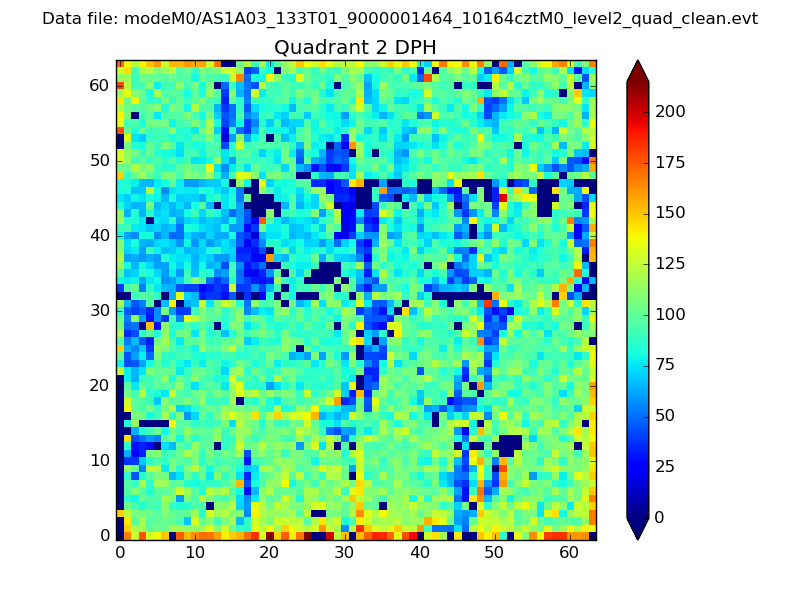 |
Quadrant C |
| Plot type | Count rate plots | Images |
|---|---|---|
| Comparison with Poisson distribution Blue bars denote a histogram of data divided into 1 sec bins. Red curve is a Poisson curve with rate = median count rate of data. |
 |
 |
| Quadrant-wise count rates Data is divided into 100 sec bins |
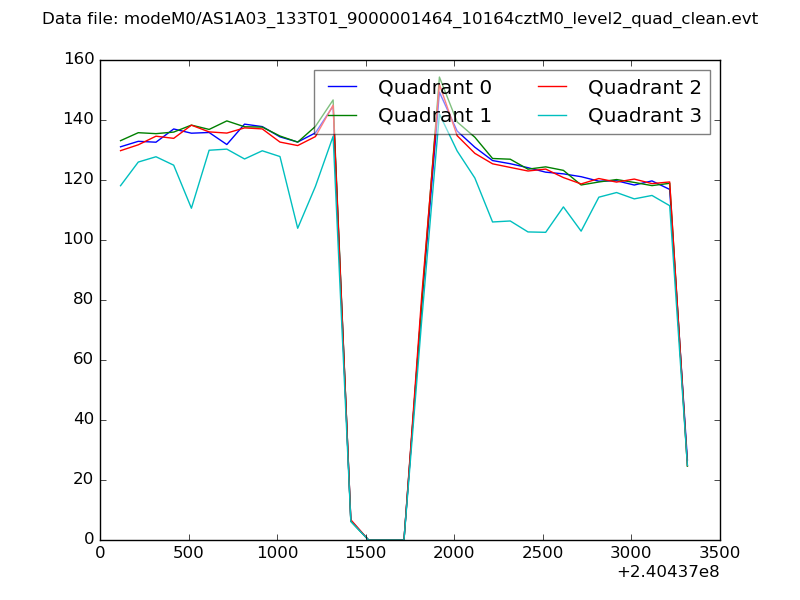 |
|
| Module-wise count rates for Quadrant A Data is divided into 100 sec bins |
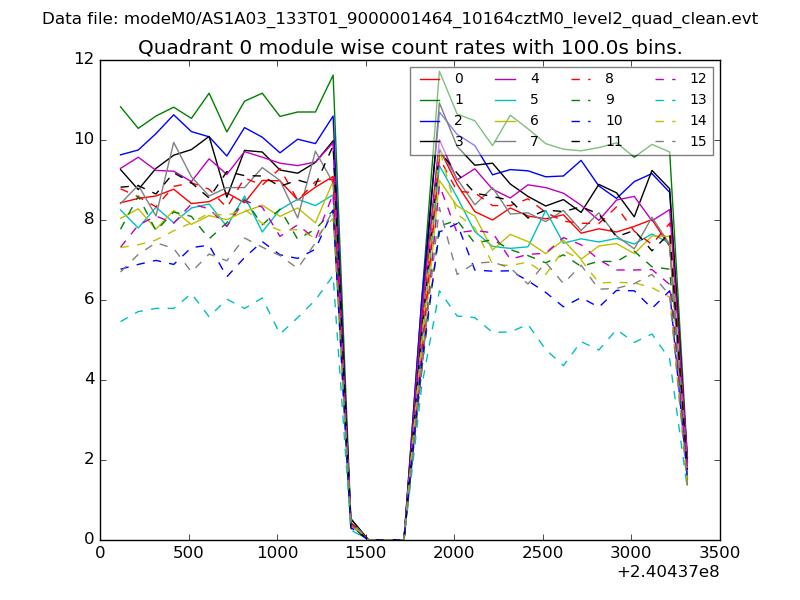 |
 |
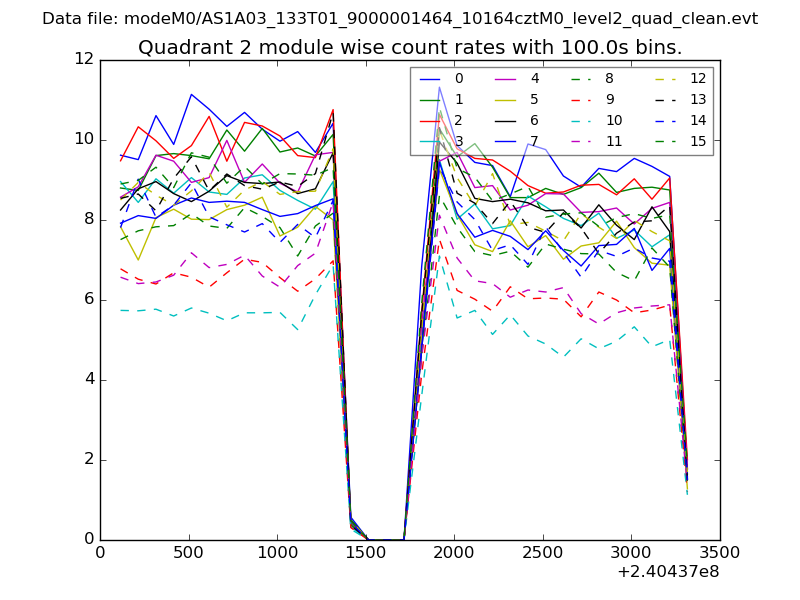
| Module-wise count rates for Quadrant B Data is divided into 100 sec bins |
 |
 |
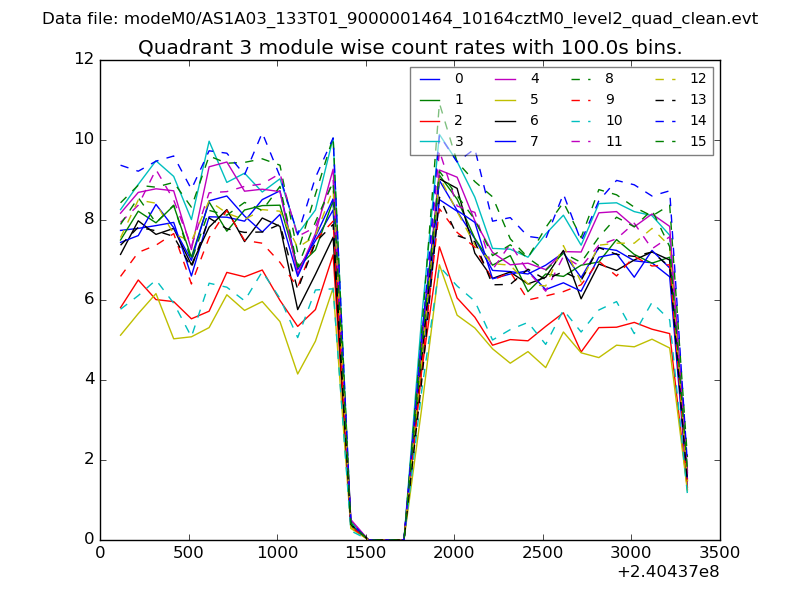
| Module-wise count rates for Quadrant C Data is divided into 100 sec bins |
 |
 |
| Module-wise count rates for Quadrant D Data is divided into 100 sec bins |
 |
 |
| Parameter | Plot |
|---|---|
| CZT HV Monitor | 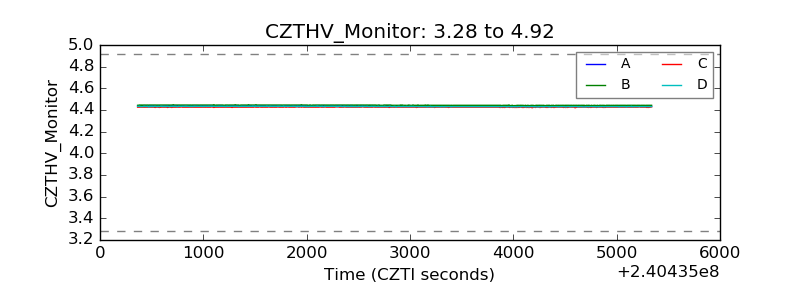 |
| D_VDD | 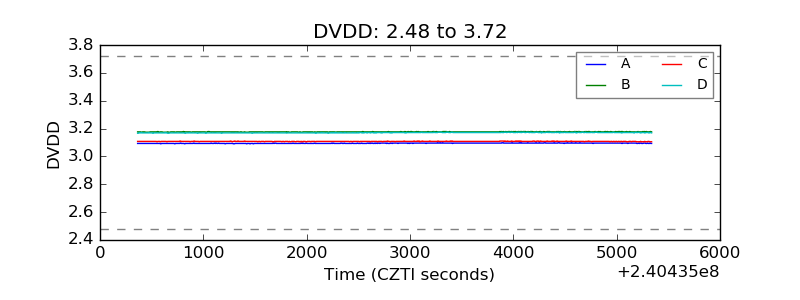 |
| Temperature 1 |  |
| Veto HV Monitor | 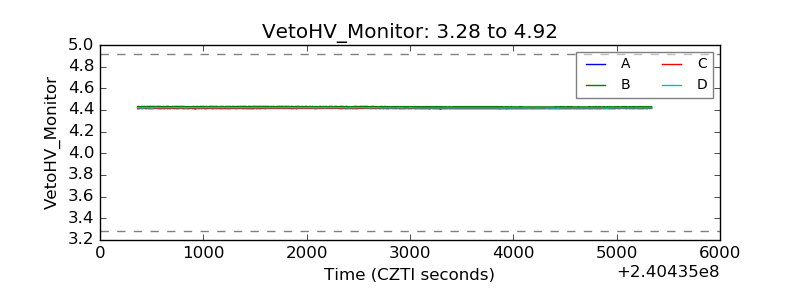 |
| Veto LLD | 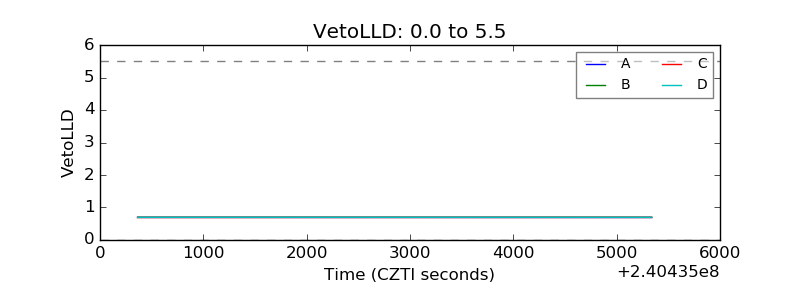 |
| Alpha Counter | 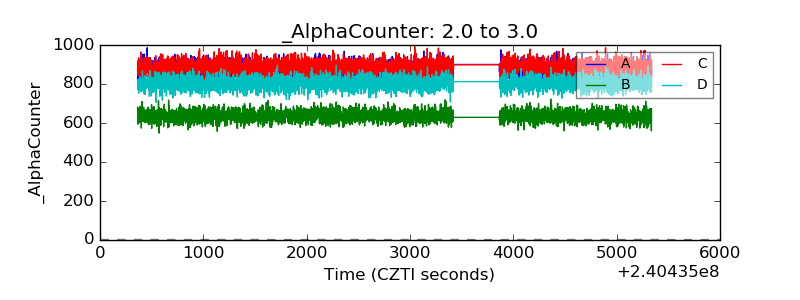 |
| _CPM_Rate | 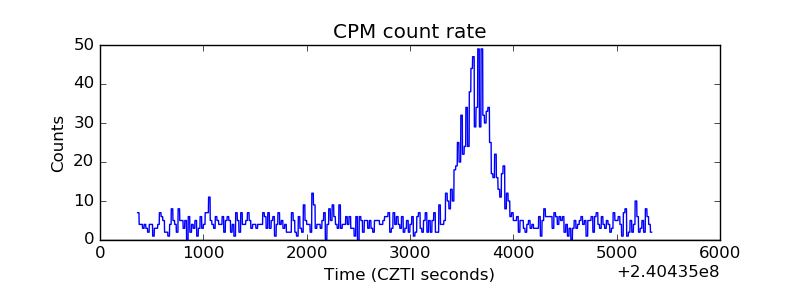 |
| CZT Counter | 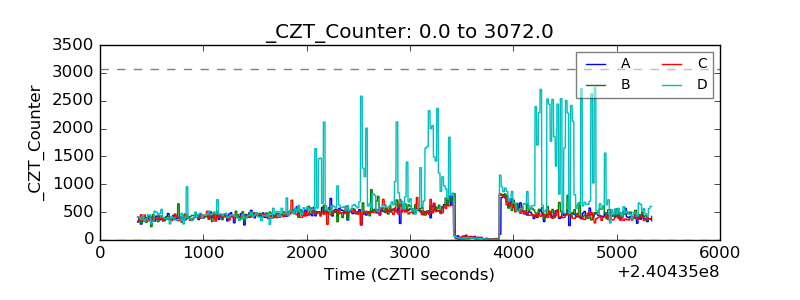 |
| +2.5 Volts monitor |  |
| +5 Volts monitor |  |
| _ROLL_ROT |  |
| _Roll_DEC | 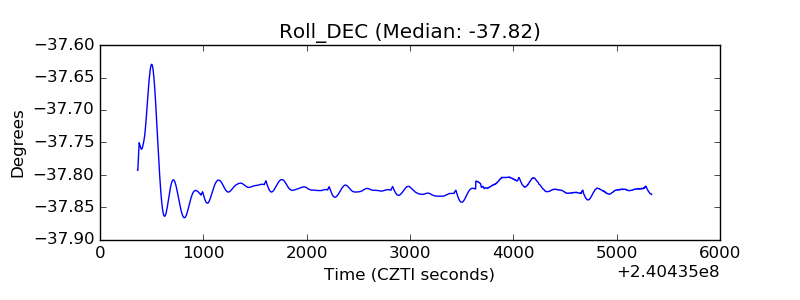 |
| _Roll_RA | 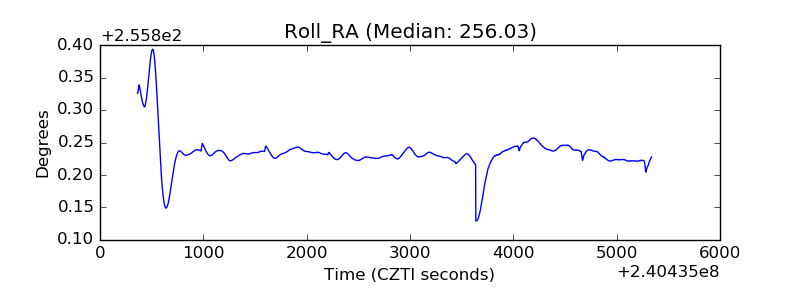 |
| Veto Counter | 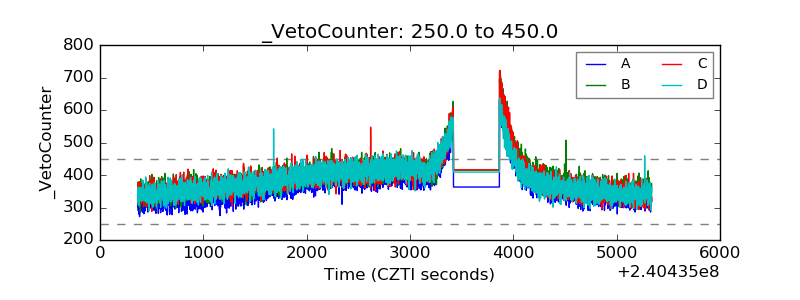 |