| Param | Original file | Final file |
|---|---|---|
| Filename | modeM0/AS1A03_133T01_9000001464_10169cztM0_level2.evt | modeM0/AS1A03_133T01_9000001464_10169cztM0_level2_quad_clean.evt |
| Size (bytes) | 2,214,181,440 | 354,156,480 |
| Size | 2.1 GB | 337.7 MB |
| Events in quadrant A | 13,706,241 | 2,217,468 |
| Events in quadrant B | 14,138,739 | 2,239,259 |
| Events in quadrant C | 12,797,953 | 2,223,607 |
| Events in quadrant D | 24,454,079 | 2,047,903 |
| Mode SS | |||
|---|---|---|---|
| Quadrant | BADHDUFLAG | Total packets | Discarded packets |
| A | 0 | 588 | 0 |
| B | 0 | 588 | 0 |
| C | 0 | 588 | 0 |
| D | 0 | 588 | 0 |
| Mode M0 | |||
|---|---|---|---|
| Quadrant | BADHDUFLAG | Total packets | Discarded packets |
| A | 0 | 60885 | 6 |
| B | 0 | 61556 | 7 |
| C | 0 | 59056 | 5 |
| D | 0 | 92689 | 5 |
| Mode M9 | |||
|---|---|---|---|
| Quadrant | BADHDUFLAG | Total packets | Discarded packets |
| A | 0 | 28 | 0 |
| B | 0 | 28 | 0 |
| C | 0 | 28 | 0 |
| D | 0 | 28 | 0 |
| Quadrant | Total seconds | Saturated seconds | Saturation percentage |
|---|---|---|---|
| A | 29078 | 244 | 0.839122% |
| B | 29077 | 256 | 0.880421% |
| C | 29078 | 110 | 0.378293% |
| D | 29078 | 1076 | 3.700392% |
Noise dominated data is calculated using 1-second bins in cleaned event files. If a bin has >2000 counts, and if more than 50% of those come from <1% of pixels, then it is considered to be noise-dominated and hence unusable.
| Quadrant | # 1 sec bins | Bins with >0 counts | Bins with >2000 counts | High rate bins dominated by noise | Noise dominated (total time) | Noise dominated (detector-on time) | Marked lightcurve |
|---|---|---|---|---|---|---|---|
| A | 31718 | 29081 | 65 | 65 | 0.20% | 0.22% | 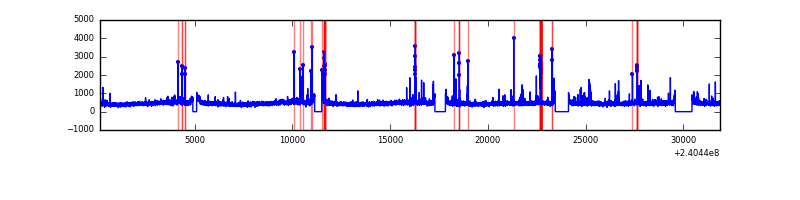 |
| B | 31718 | 29082 | 26 | 26 | 0.08% | 0.09% | 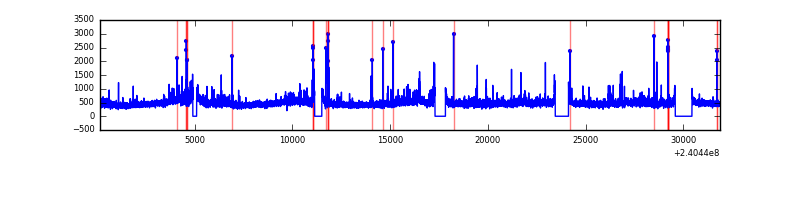 |
| C | 31718 | 29082 | 0 | 0 | 0.00% | 0.00% | 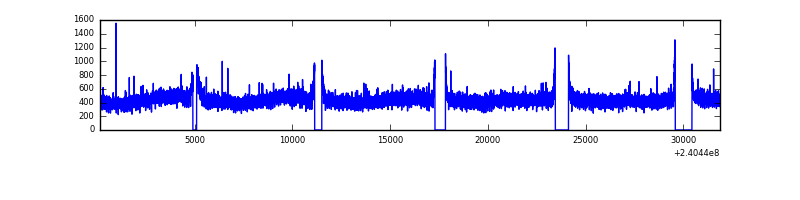 |
| D | 31718 | 29081 | 874 | 874 | 2.76% | 3.01% | 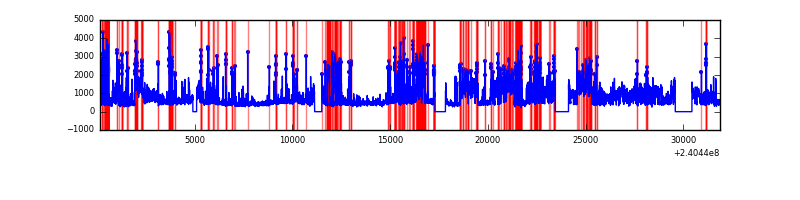 |
Top three noisy pixels from each quadrant. If the there are fewer than three noisy pixels in the level2.evt file, extra rows are filled as -1
| Pixel properties | Quadrant properties | ||||||
|---|---|---|---|---|---|---|---|
| Quadrant | DetID | PixID | Counts | Sigma | Mean | Median | Sigma |
| A | 15 | 174 | 353278 | 513.8 | 3365 | 3291 | 681.2 |
| A | 8 | 15 | 151834 | 218.07 | 3365 | 3291 | 681.2 |
| A | 15 | 223 | 146874 | 210.79 | 3365 | 3291 | 681.2 |
| B | 0 | 214 | 239039 | 365.67 | 3385 | 3305 | 644.7 |
| B | 4 | 48 | 144576 | 219.14 | 3385 | 3305 | 644.7 |
| B | 11 | 51 | 136892 | 207.22 | 3385 | 3305 | 644.7 |
| C | 13 | 61 | 24733 | 28.46 | 3268 | 3289 | 753.5 |
| C | 14 | 67 | 18235 | 19.83 | 3268 | 3289 | 753.5 |
| C | 12 | 4 | 18145 | 19.72 | 3268 | 3289 | 753.5 |
| D | 1 | 52 | 8899147 | 11546.18 | 3194 | 3109 | 770.5 |
| D | 8 | 195 | 1304864 | 1689.55 | 3194 | 3109 | 770.5 |
| D | 12 | 33 | 572211 | 738.64 | 3194 | 3109 | 770.5 |
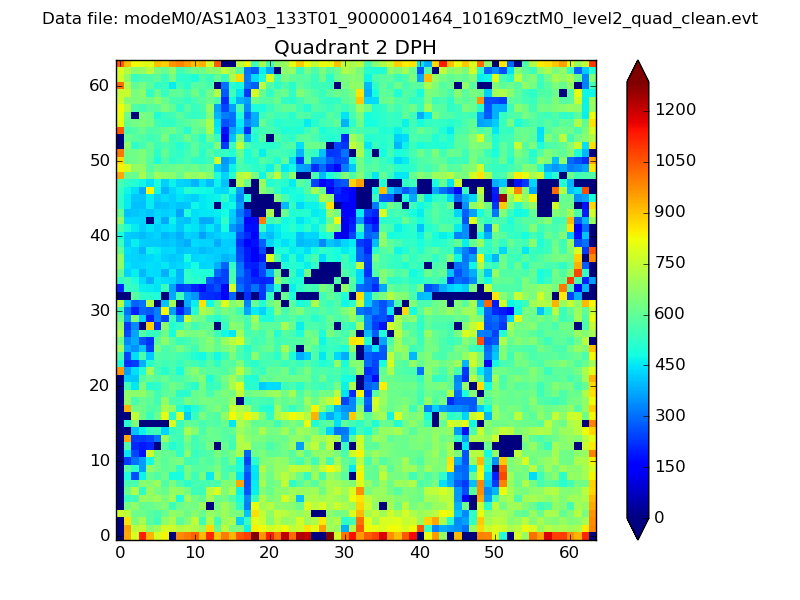
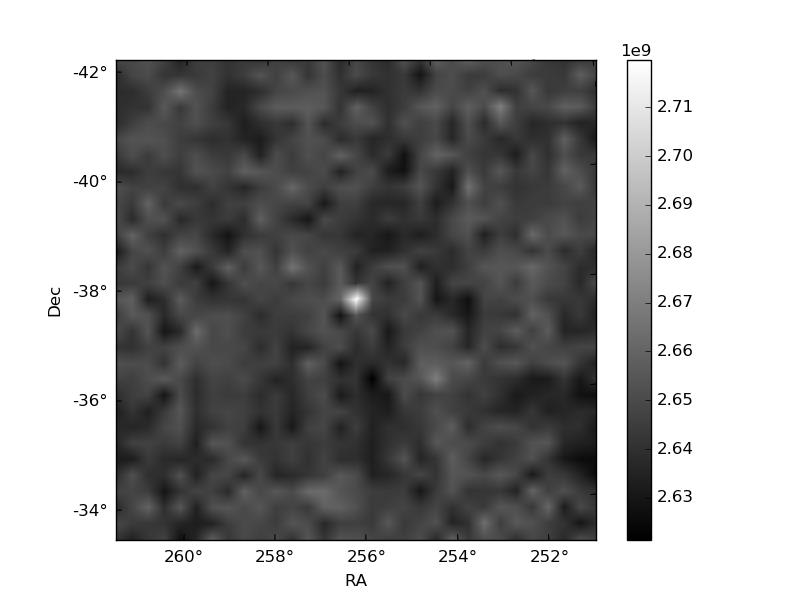
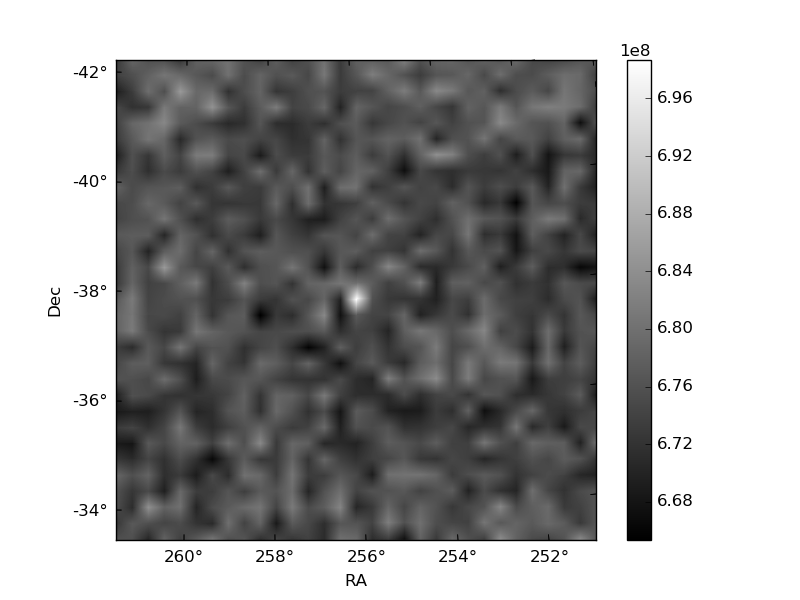
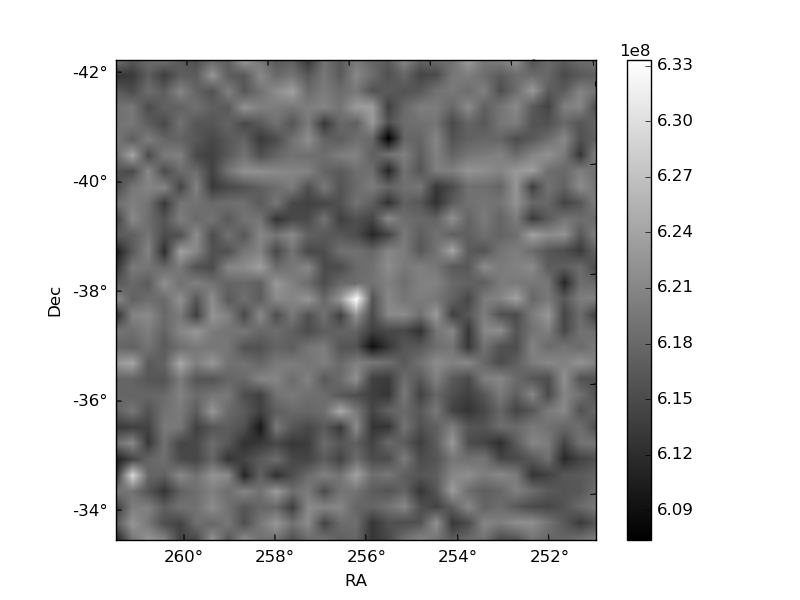
Histogram calculated using DETX and DETY for each event in the final _common_clean file
| Quadrant A | 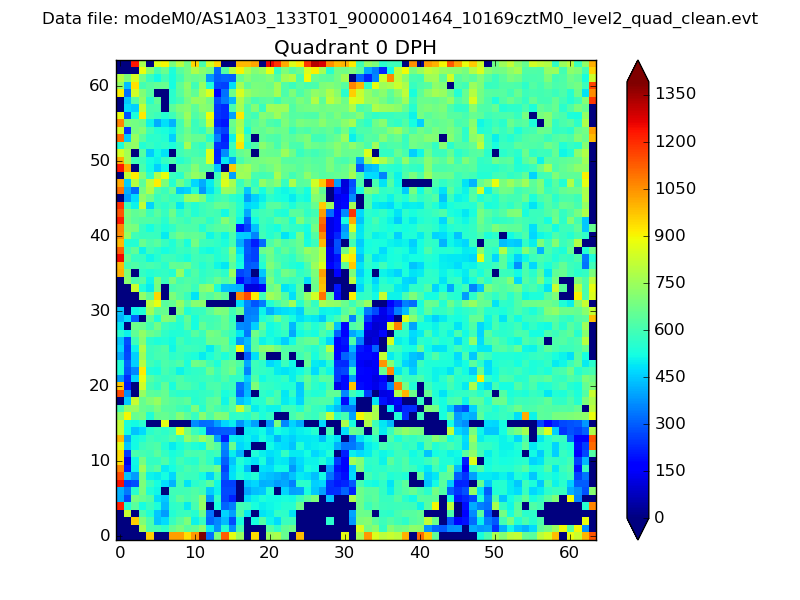 |
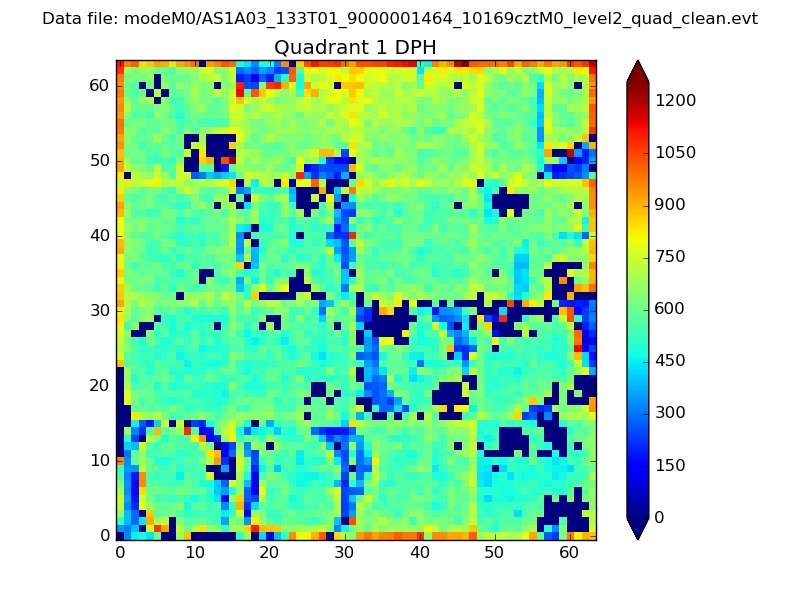 |
Quadrant B |
|---|---|---|---|
| Quadrant D | 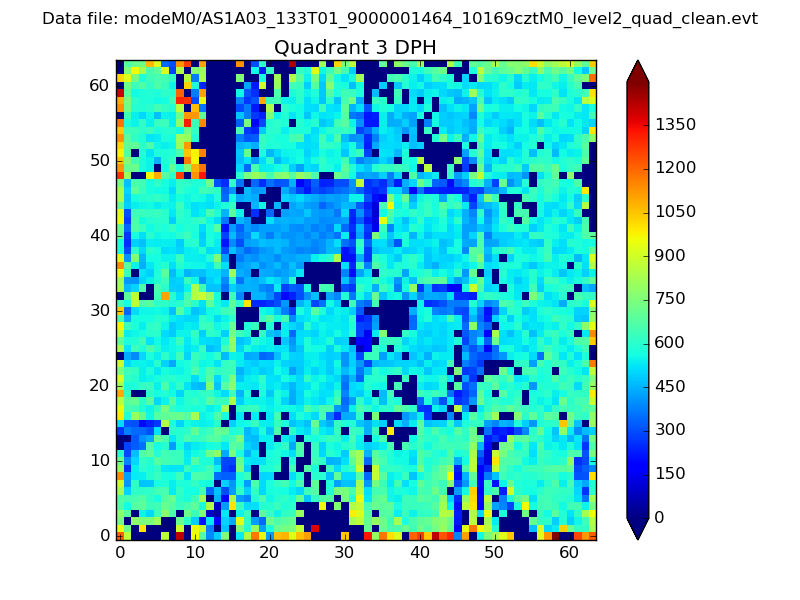 |
 |
Quadrant C |
| Plot type | Count rate plots | Images |
|---|---|---|
| Comparison with Poisson distribution Blue bars denote a histogram of data divided into 1 sec bins. Red curve is a Poisson curve with rate = median count rate of data. |
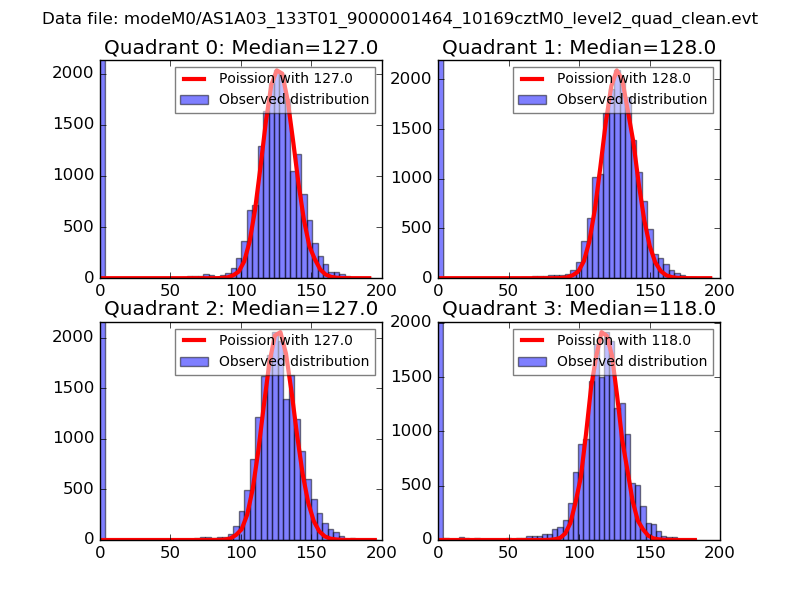 |
 |
| Quadrant-wise count rates Data is divided into 100 sec bins |
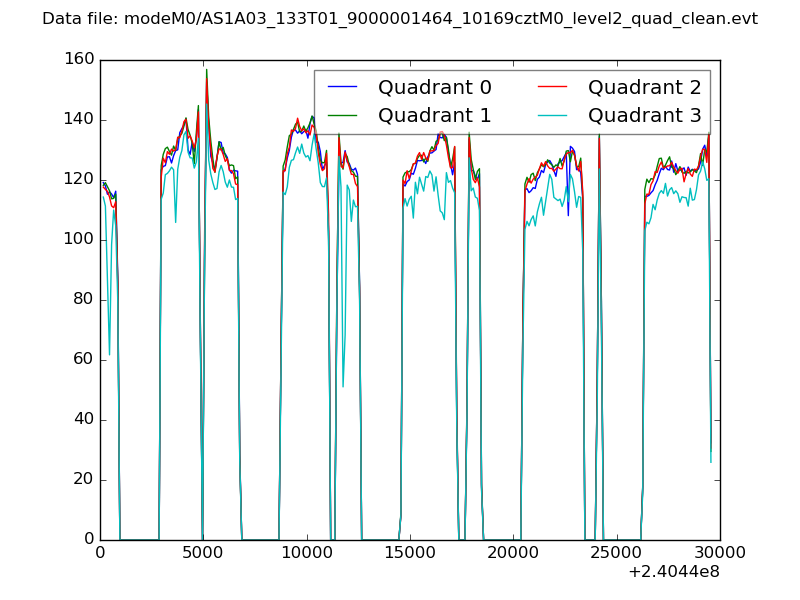 |
|
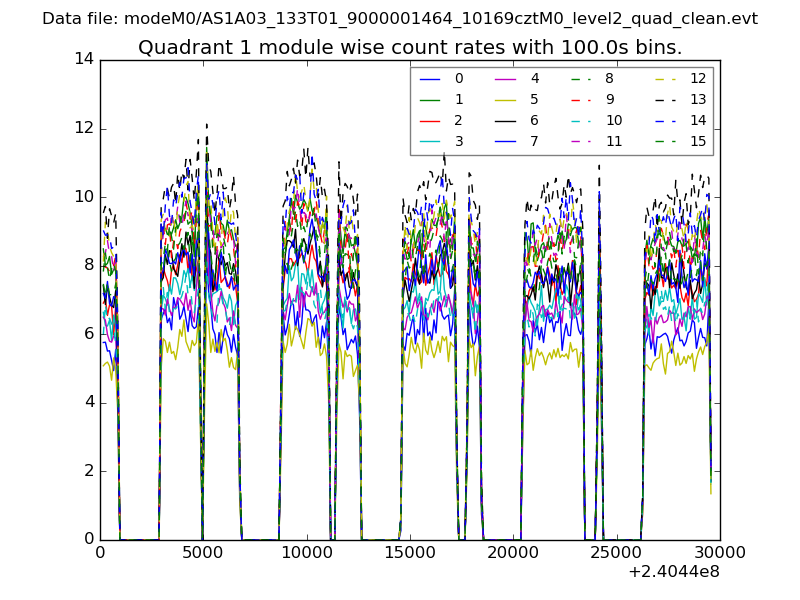
| Module-wise count rates for Quadrant A Data is divided into 100 sec bins |
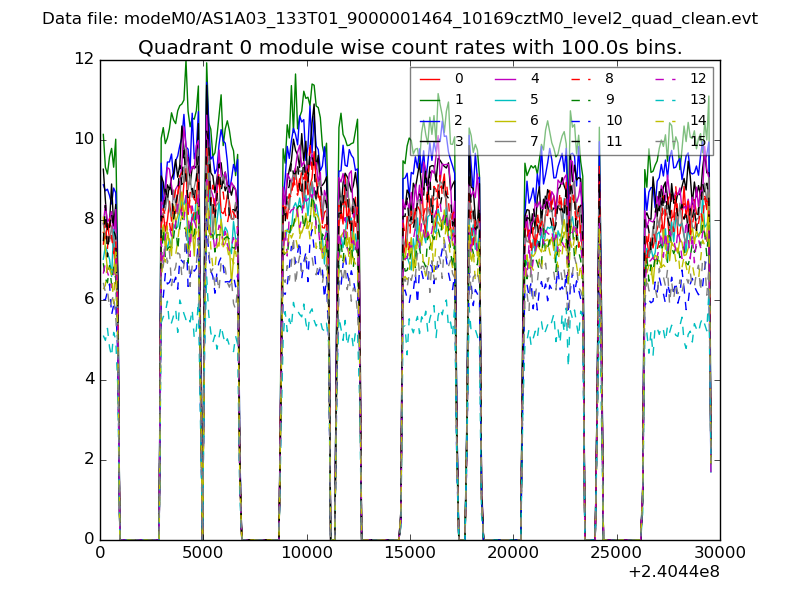 |
 |
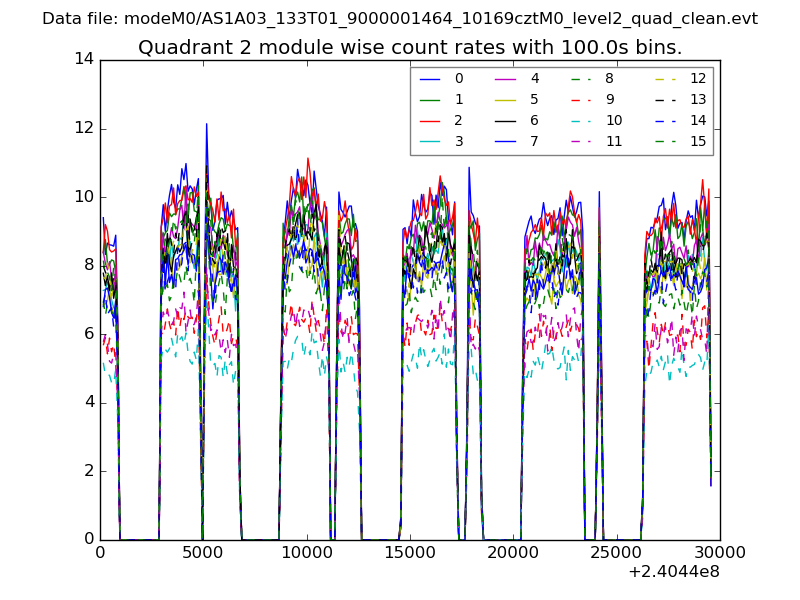
| Module-wise count rates for Quadrant B Data is divided into 100 sec bins |
 |
 |
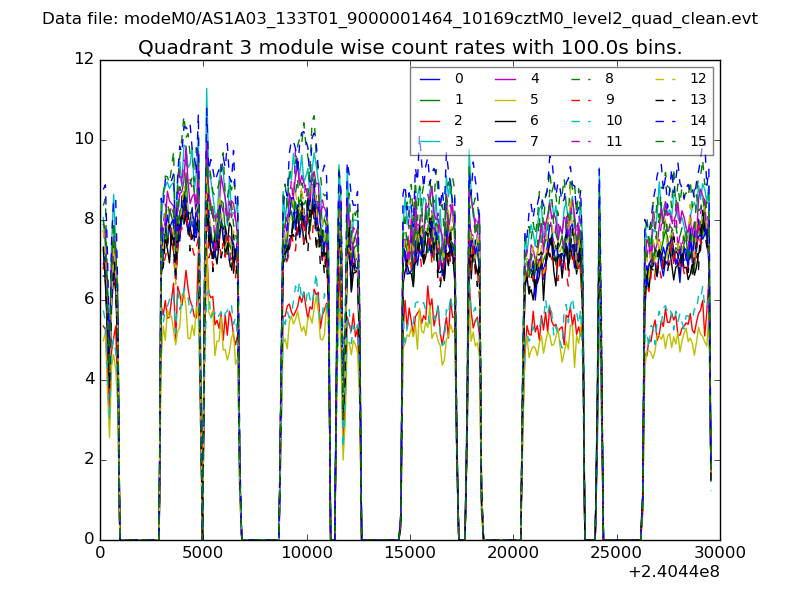
| Module-wise count rates for Quadrant C Data is divided into 100 sec bins |
 |
 |
| Module-wise count rates for Quadrant D Data is divided into 100 sec bins |
 |
 |
| Parameter | Plot |
|---|---|
| CZT HV Monitor | 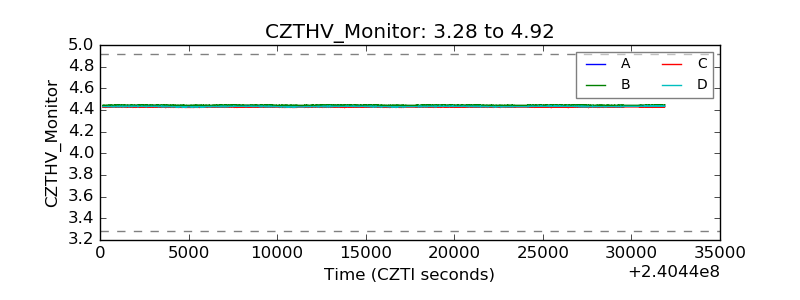 |
| D_VDD | 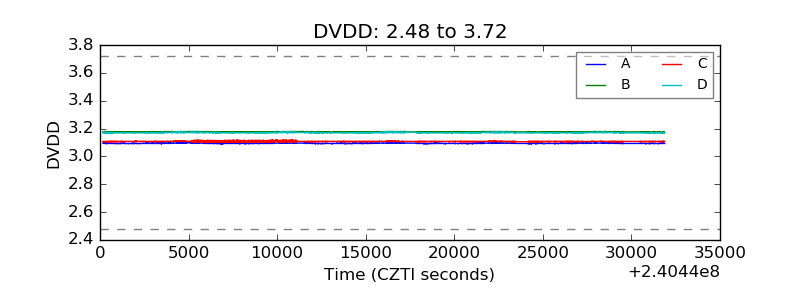 |
| Temperature 1 | 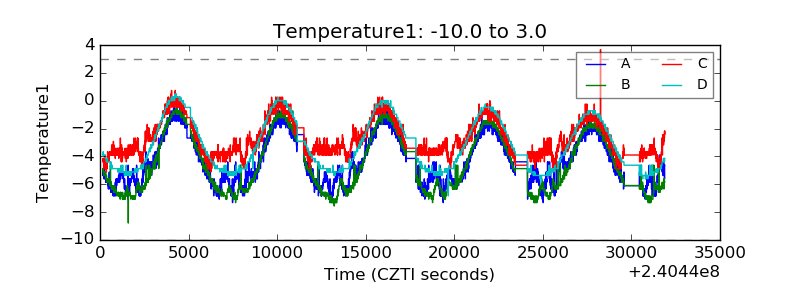 |
| Veto HV Monitor | 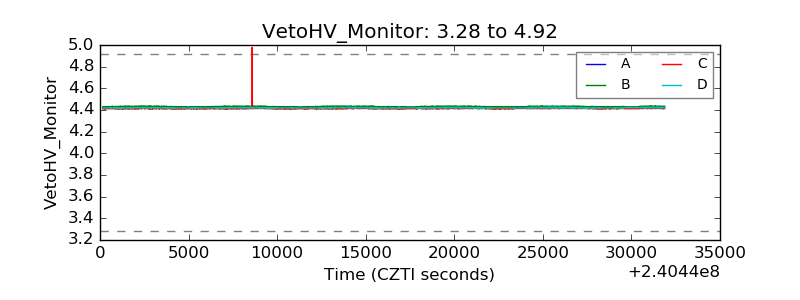 |
| Veto LLD | 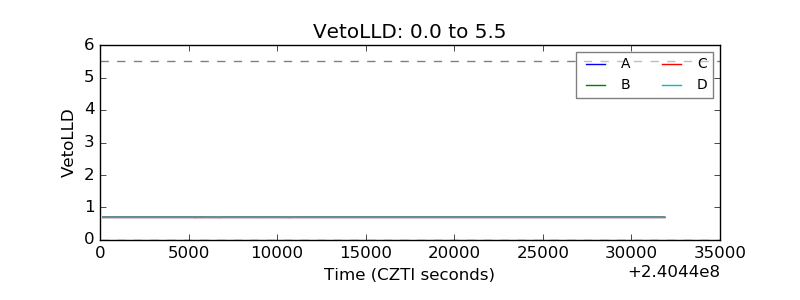 |
| Alpha Counter | 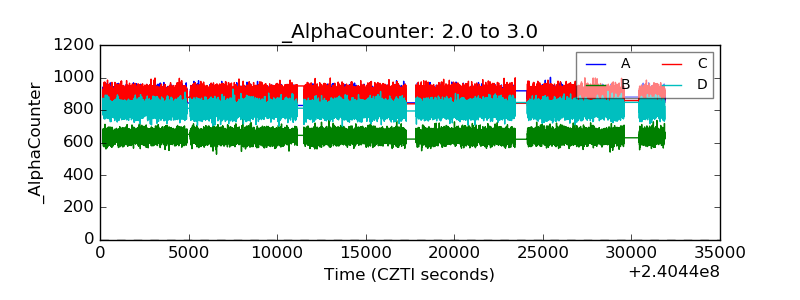 |
| _CPM_Rate | 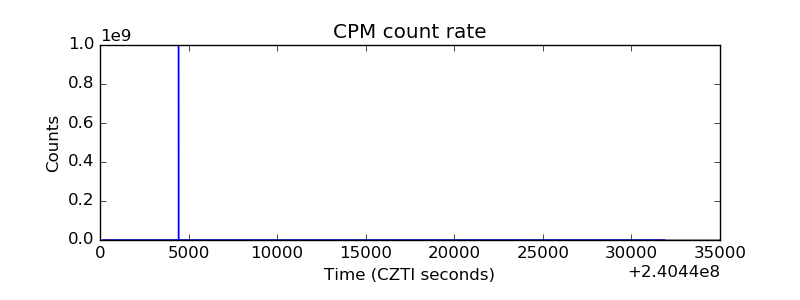 |
| CZT Counter | 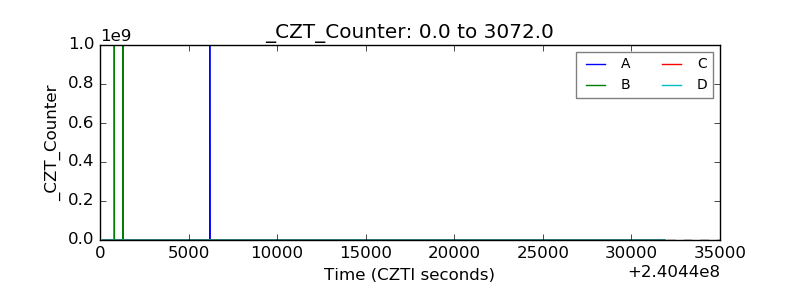 |
| +2.5 Volts monitor |  |
| +5 Volts monitor |  |
| _ROLL_ROT | 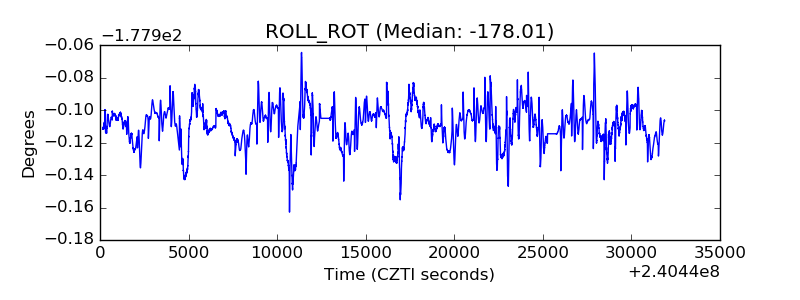 |
| _Roll_DEC | 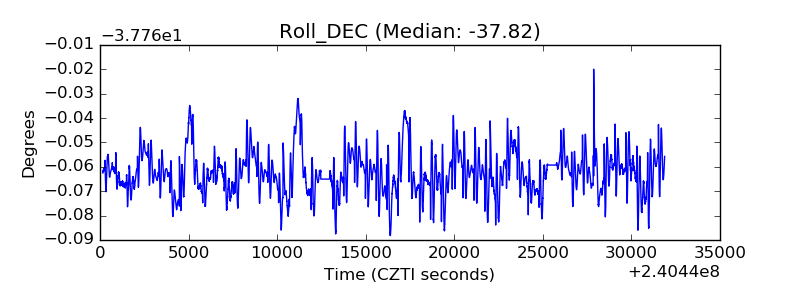 |
| _Roll_RA | 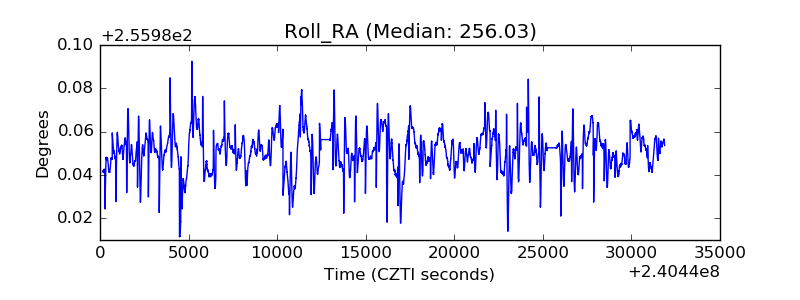 |
| Veto Counter | 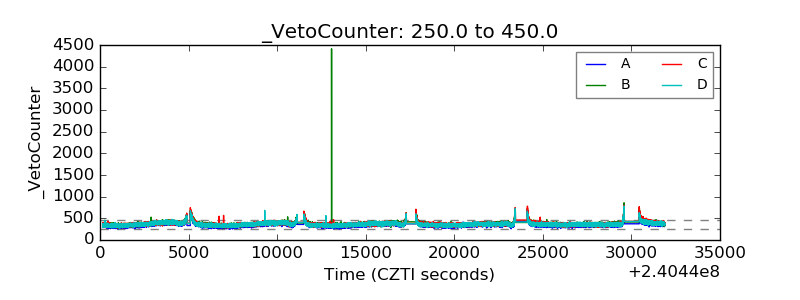 |