| Param | Original file | Final file |
|---|---|---|
| Filename | modeM0/AS1A03_133T01_9000001464_10172cztM0_level2.evt | modeM0/AS1A03_133T01_9000001464_10172cztM0_level2_quad_clean.evt |
| Size (bytes) | 489,026,880 | 93,620,160 |
| Size | 466.4 MB | 89.3 MB |
| Events in quadrant A | 3,466,934 | 597,966 |
| Events in quadrant B | 3,569,918 | 603,464 |
| Events in quadrant C | 3,225,463 | 598,233 |
| Events in quadrant D | 4,090,792 | 566,546 |
| Mode SS | |||
|---|---|---|---|
| Quadrant | BADHDUFLAG | Total packets | Discarded packets |
| A | 0 | 142 | 0 |
| B | 0 | 142 | 0 |
| C | 0 | 142 | 0 |
| D | 0 | 142 | 0 |
| Mode M0 | |||
|---|---|---|---|
| Quadrant | BADHDUFLAG | Total packets | Discarded packets |
| A | 0 | 14503 | 3 |
| B | 0 | 14803 | 2 |
| C | 0 | 14011 | 2 |
| D | 0 | 16196 | 2 |
| Mode M9 | |||
|---|---|---|---|
| Quadrant | BADHDUFLAG | Total packets | Discarded packets |
| A | 0 | 20 | 0 |
| B | 0 | 20 | 0 |
| C | 0 | 20 | 0 |
| D | 0 | 20 | 0 |
| Quadrant | Total seconds | Saturated seconds | Saturation percentage |
|---|---|---|---|
| A | 6716 | 147 | 2.188803% |
| B | 6716 | 145 | 2.159023% |
| C | 6716 | 118 | 1.756998% |
| D | 6716 | 222 | 3.305539% |
Noise dominated data is calculated using 1-second bins in cleaned event files. If a bin has >2000 counts, and if more than 50% of those come from <1% of pixels, then it is considered to be noise-dominated and hence unusable.
| Quadrant | # 1 sec bins | Bins with >0 counts | Bins with >2000 counts | High rate bins dominated by noise | Noise dominated (total time) | Noise dominated (detector-on time) | Marked lightcurve |
|---|---|---|---|---|---|---|---|
| A | 8811 | 6716 | 20 | 20 | 0.23% | 0.30% | 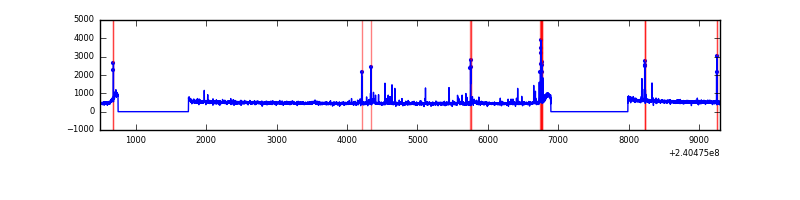 |
| B | 8811 | 6716 | 7 | 7 | 0.08% | 0.10% | 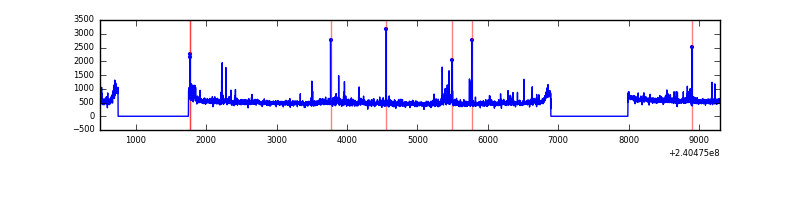 |
| C | 8811 | 6716 | 0 | 0 | 0.00% | 0.00% | 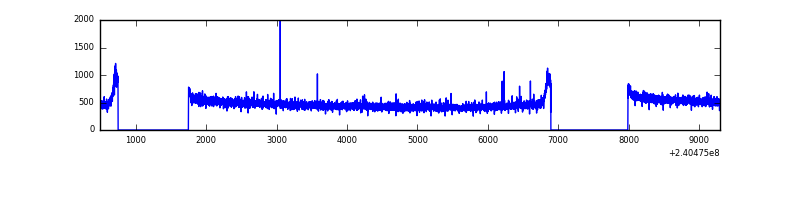 |
| D | 8811 | 6716 | 91 | 91 | 1.03% | 1.35% | 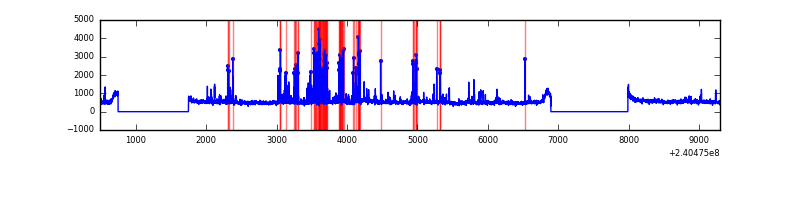 |
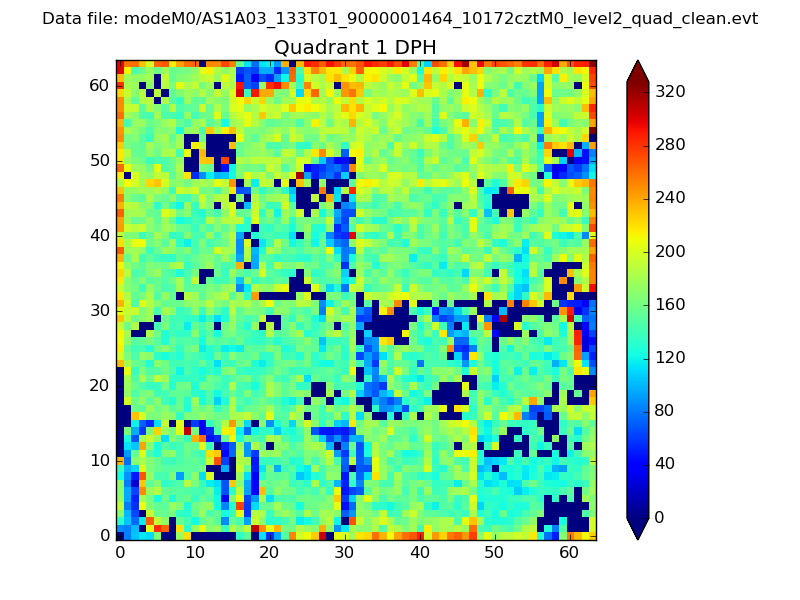
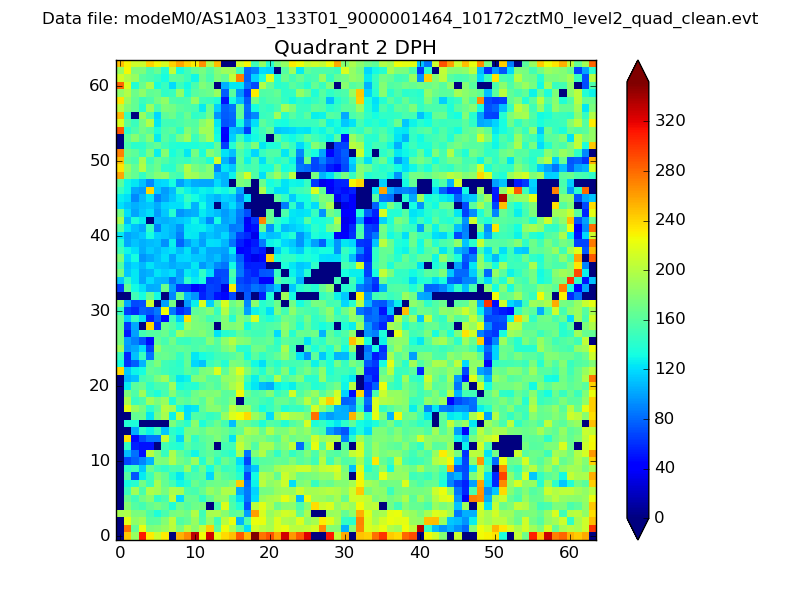
Top three noisy pixels from each quadrant. If the there are fewer than three noisy pixels in the level2.evt file, extra rows are filled as -1
| Pixel properties | Quadrant properties | ||||||
|---|---|---|---|---|---|---|---|
| Quadrant | DetID | PixID | Counts | Sigma | Mean | Median | Sigma |
| A | 15 | 223 | 122414 | 712.16 | 849 | 834 | 170.7 |
| A | 15 | 239 | 33874 | 193.53 | 849 | 834 | 170.7 |
| A | 8 | 15 | 16686 | 92.85 | 849 | 834 | 170.7 |
| B | 4 | 81 | 98559 | 606.95 | 848 | 831 | 161.0 |
| B | 0 | 214 | 60055 | 367.82 | 848 | 831 | 161.0 |
| B | 5 | 255 | 54834 | 335.39 | 848 | 831 | 161.0 |
| C | 13 | 61 | 6274 | 28.58 | 825 | 832 | 190.4 |
| C | 14 | 234 | 6010 | 27.19 | 825 | 832 | 190.4 |
| C | 3 | 202 | 2154 | 6.94 | 825 | 832 | 190.4 |
| D | 1 | 52 | 460013 | 2198.55 | 816 | 799 | 208.9 |
| D | 8 | 195 | 311168 | 1485.93 | 816 | 799 | 208.9 |
| D | 7 | 71 | 46994 | 221.16 | 816 | 799 | 208.9 |
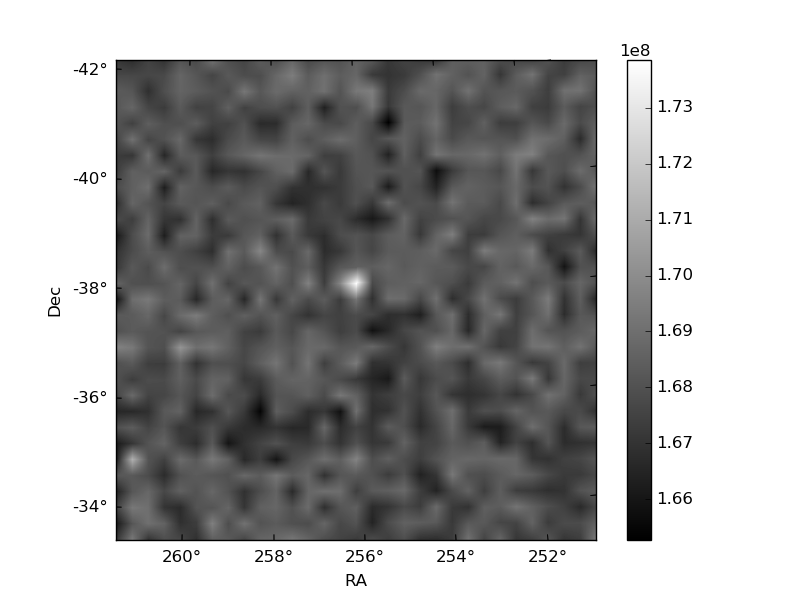
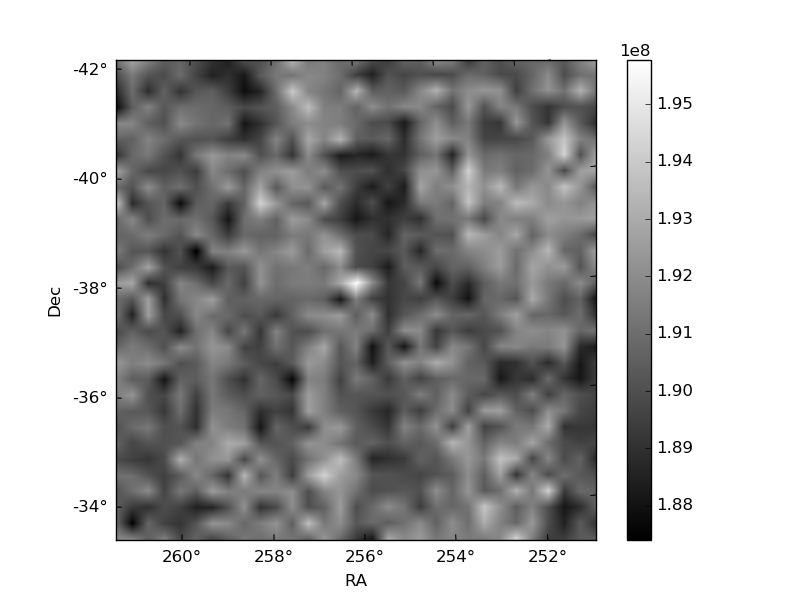
Histogram calculated using DETX and DETY for each event in the final _common_clean file
| Quadrant A | 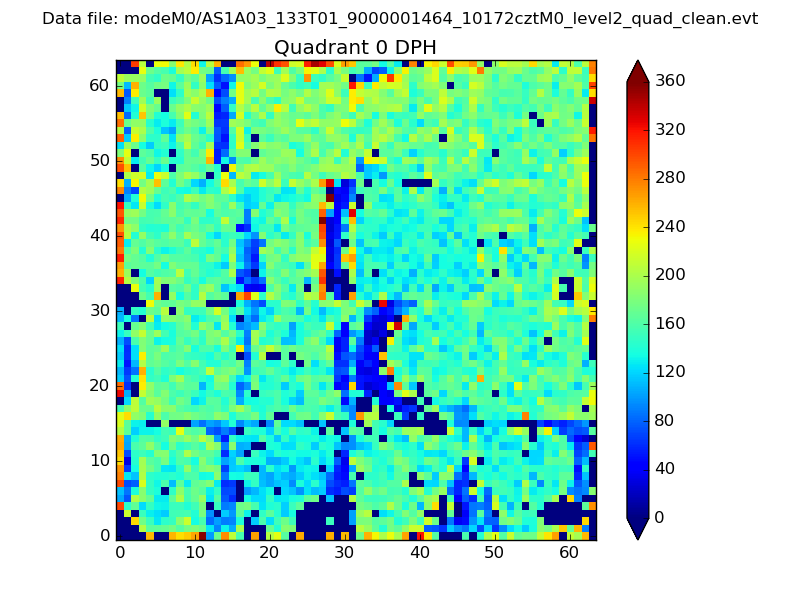 |
 |
Quadrant B |
|---|---|---|---|
| Quadrant D | 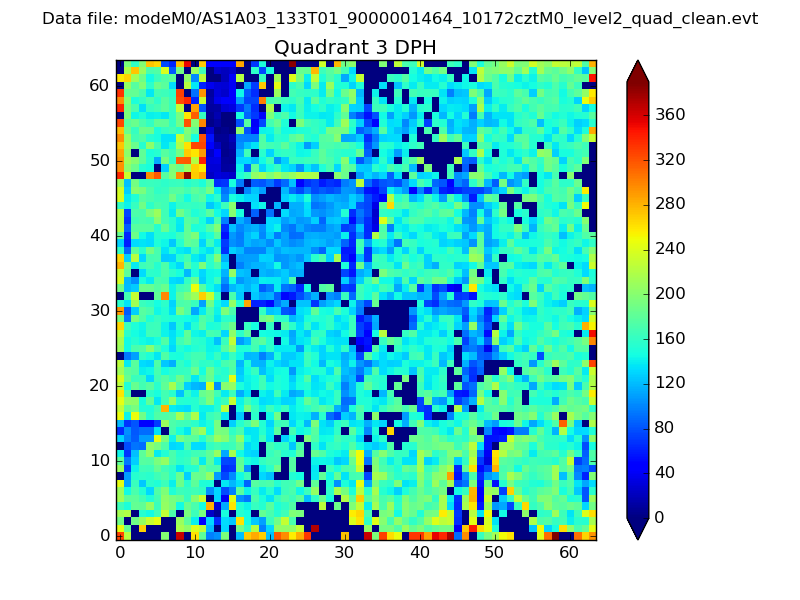 |
 |
Quadrant C |
| Plot type | Count rate plots | Images |
|---|---|---|
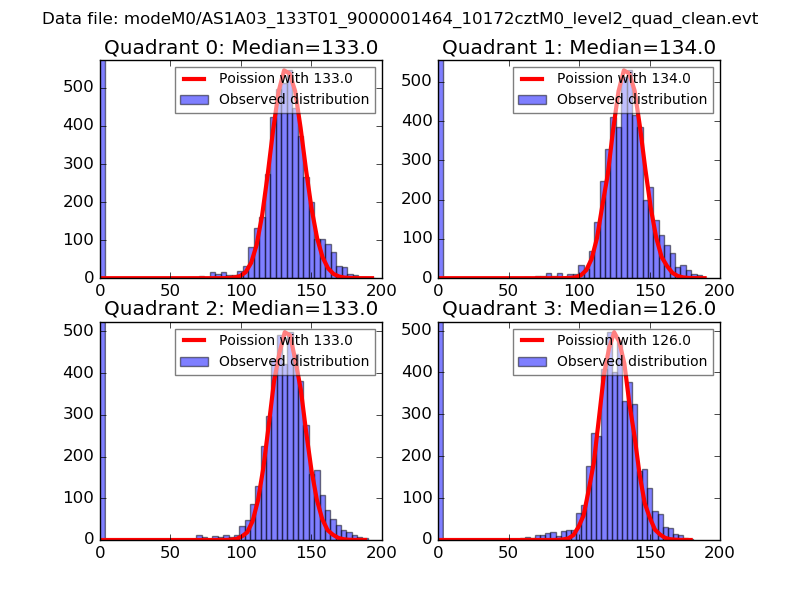
| Comparison with Poisson distribution Blue bars denote a histogram of data divided into 1 sec bins. Red curve is a Poisson curve with rate = median count rate of data. |
 |
 |
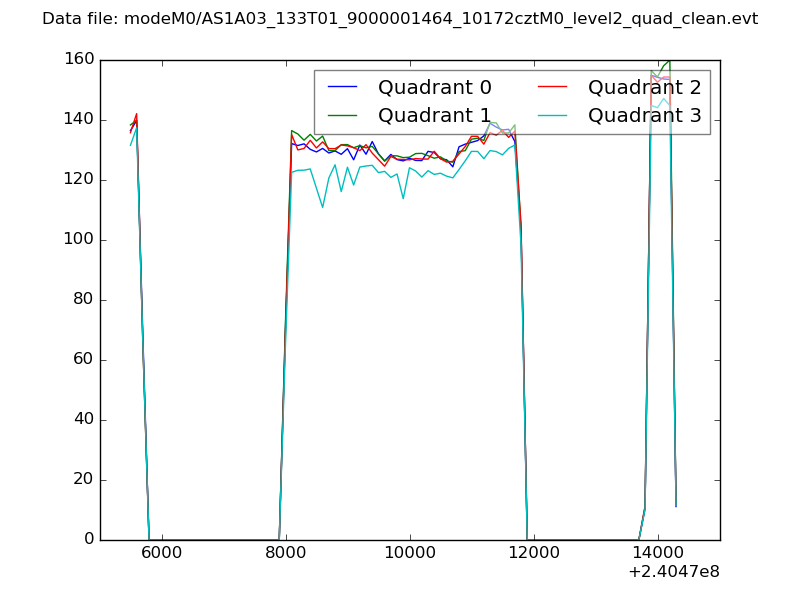
| Quadrant-wise count rates Data is divided into 100 sec bins |
 |
|
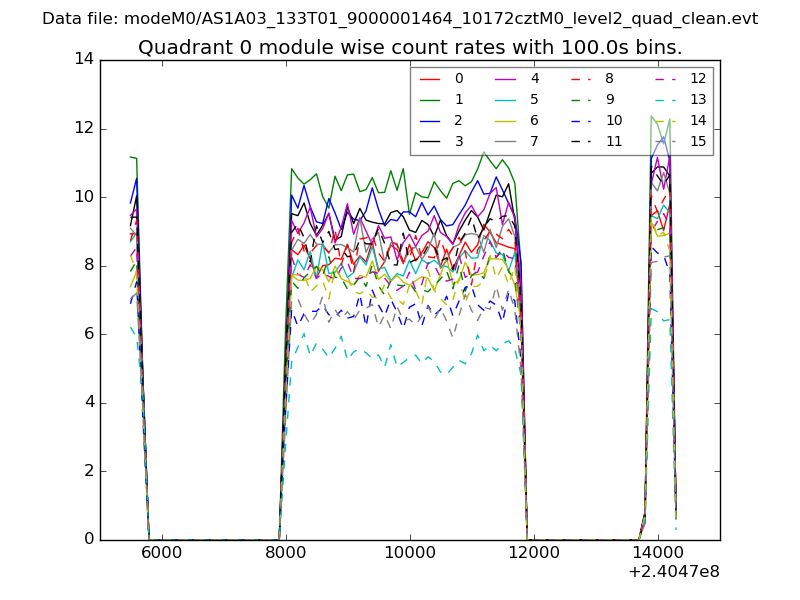
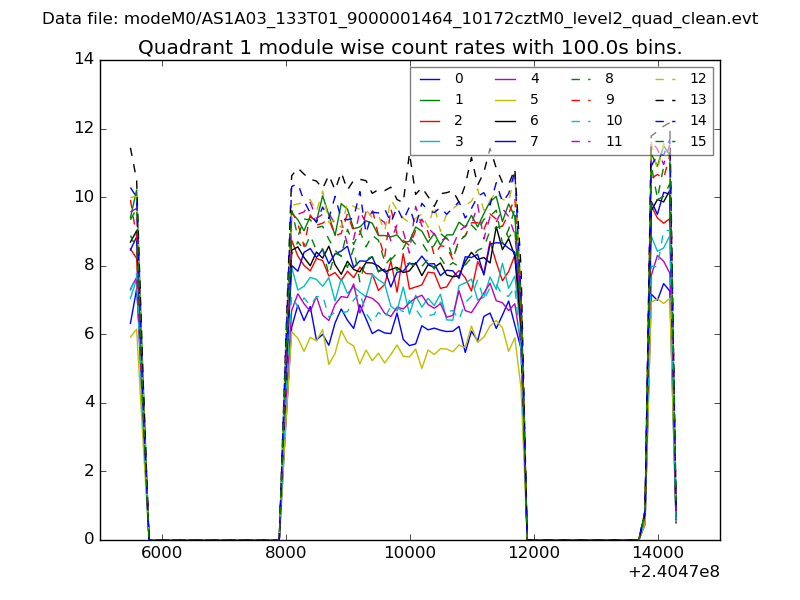
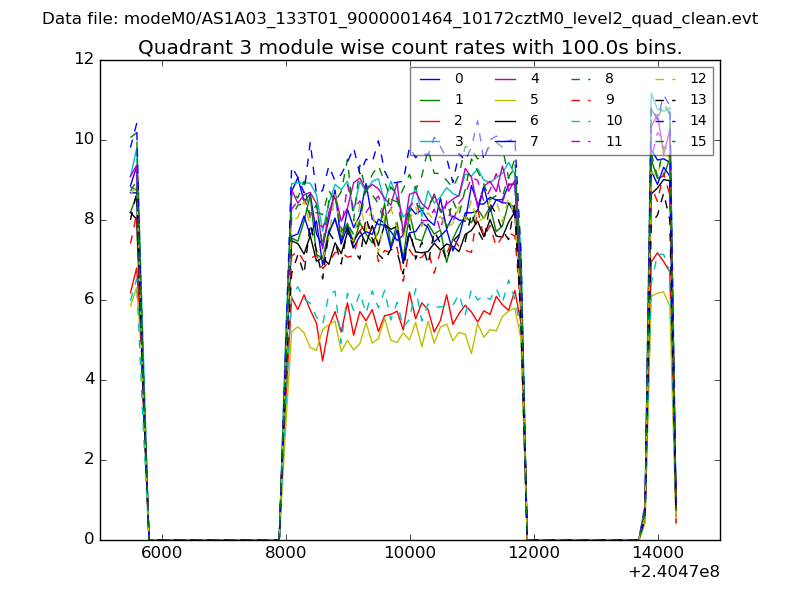
| Module-wise count rates for Quadrant A Data is divided into 100 sec bins |
 |
 |
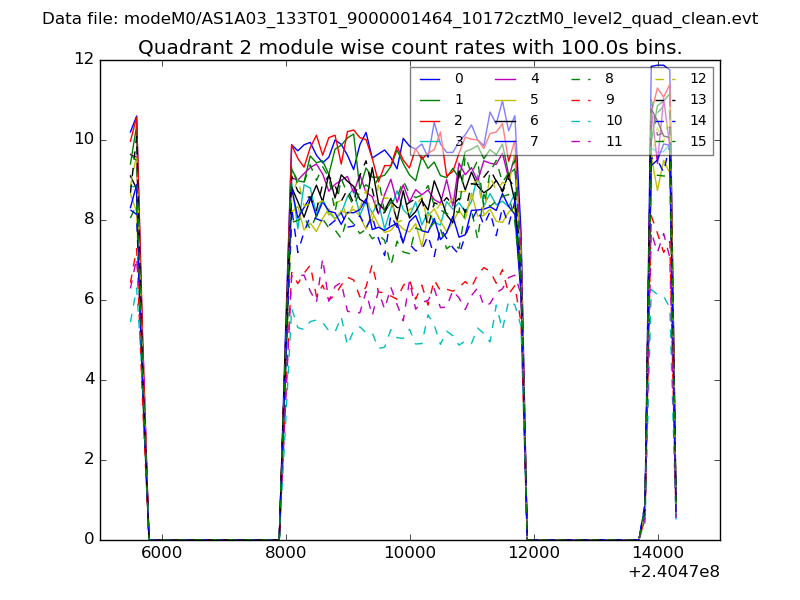
| Module-wise count rates for Quadrant B Data is divided into 100 sec bins |
 |
 |
| Module-wise count rates for Quadrant C Data is divided into 100 sec bins |
 |
 |
| Module-wise count rates for Quadrant D Data is divided into 100 sec bins |
 |
 |
| Parameter | Plot |
|---|---|
| CZT HV Monitor | 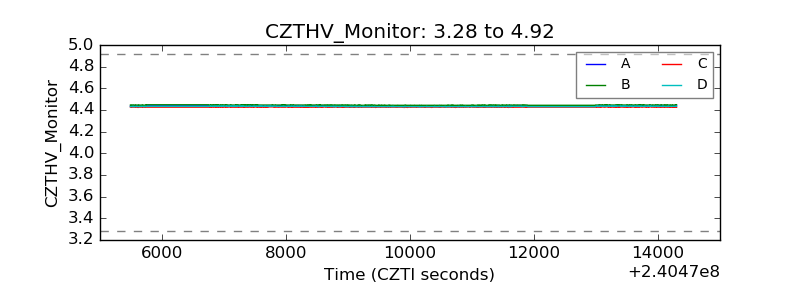 |
| D_VDD | 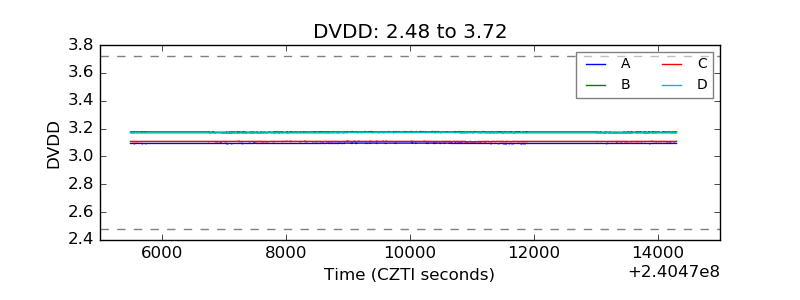 |
| Temperature 1 | 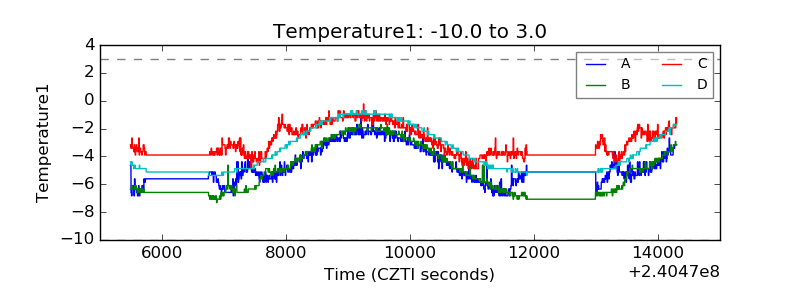 |
| Veto HV Monitor |  |
| Veto LLD | 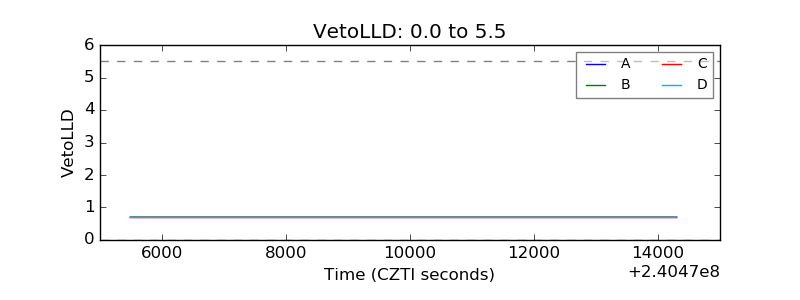 |
| Alpha Counter | 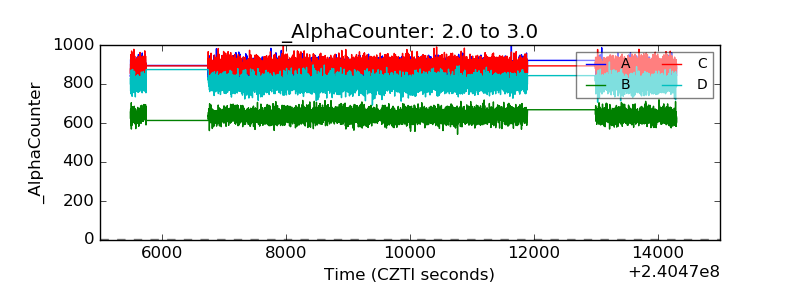 |
| _CPM_Rate | 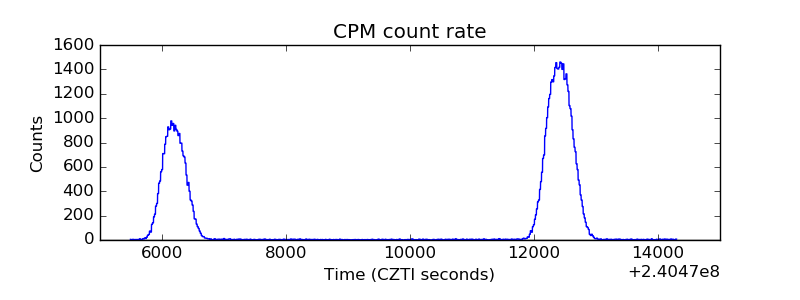 |
| CZT Counter |  |
| +2.5 Volts monitor |  |
| +5 Volts monitor |  |
| _ROLL_ROT | 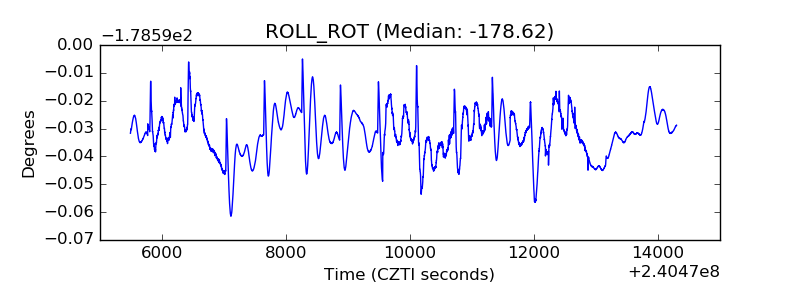 |
| _Roll_DEC | 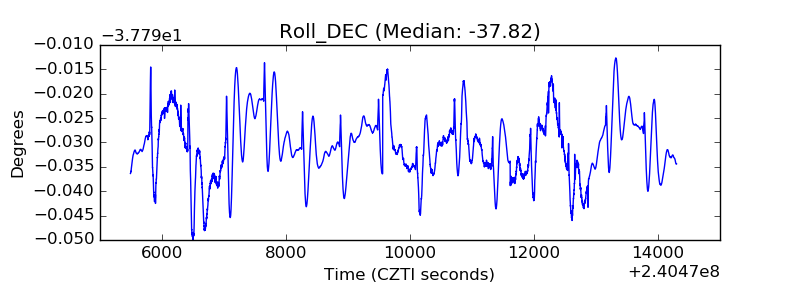 |
| _Roll_RA | 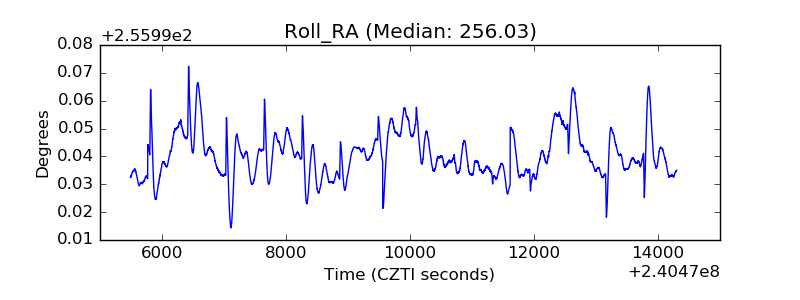 |
| Veto Counter | 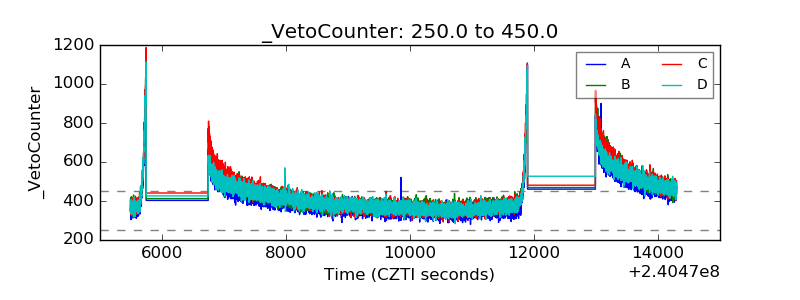 |