| Param | Original file | Final file |
|---|---|---|
| Filename | modeM0/AS1A03_133T01_9000001464_10174cztM0_level2.evt | modeM0/AS1A03_133T01_9000001464_10174cztM0_level2_quad_clean.evt |
| Size (bytes) | 427,645,440 | 111,908,160 |
| Size | 407.8 MB | 106.7 MB |
| Events in quadrant A | 2,969,792 | 760,288 |
| Events in quadrant B | 3,346,554 | 759,807 |
| Events in quadrant C | 2,845,098 | 746,312 |
| Events in quadrant D | 3,393,429 | 715,438 |
| Mode SS | |||
|---|---|---|---|
| Quadrant | BADHDUFLAG | Total packets | Discarded packets |
| A | 0 | 118 | 0 |
| B | 0 | 118 | 0 |
| C | 0 | 118 | 0 |
| D | 0 | 118 | 0 |
| Mode M0 | |||
|---|---|---|---|
| Quadrant | BADHDUFLAG | Total packets | Discarded packets |
| A | 0 | 12496 | 19 |
| B | 0 | 13820 | 30 |
| C | 0 | 12258 | 13 |
| D | 0 | 13774 | 9 |
| Mode M9 | |||
|---|---|---|---|
| Quadrant | BADHDUFLAG | Total packets | Discarded packets |
| A | 0 | 13 | 0 |
| B | 0 | 13 | 0 |
| C | 0 | 13 | 0 |
| D | 0 | 13 | 0 |
| Quadrant | Total seconds | Saturated seconds | Saturation percentage |
|---|---|---|---|
| A | 5834 | 74 | 1.268426% |
| B | 5831 | 97 | 1.663523% |
| C | 5836 | 63 | 1.079507% |
| D | 5838 | 123 | 2.106886% |
Noise dominated data is calculated using 1-second bins in cleaned event files. If a bin has >2000 counts, and if more than 50% of those come from <1% of pixels, then it is considered to be noise-dominated and hence unusable.
| Quadrant | # 1 sec bins | Bins with >0 counts | Bins with >2000 counts | High rate bins dominated by noise | Noise dominated (total time) | Noise dominated (detector-on time) | Marked lightcurve |
|---|---|---|---|---|---|---|---|
| A | 7122 | 5842 | 0 | 0 | 0.00% | 0.00% | 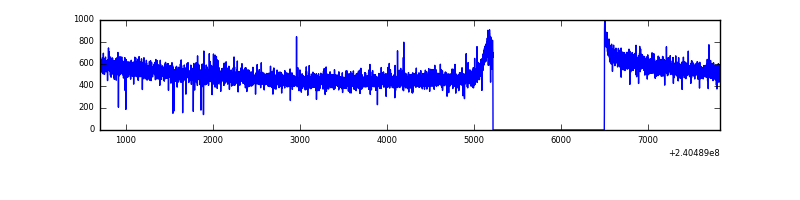 |
| B | 7122 | 5842 | 14 | 14 | 0.20% | 0.24% | 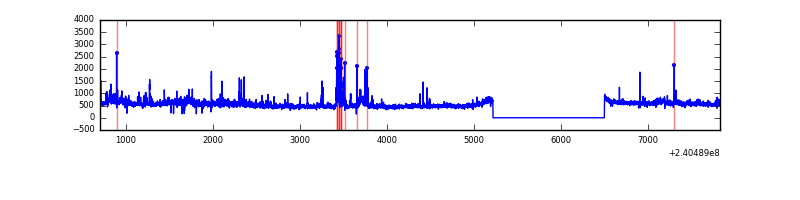 |
| C | 7122 | 5842 | 0 | 0 | 0.00% | 0.00% |  |
| D | 7122 | 5842 | 39 | 39 | 0.55% | 0.67% | 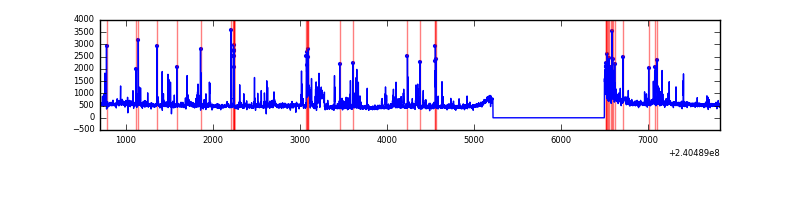 |
Top three noisy pixels from each quadrant. If the there are fewer than three noisy pixels in the level2.evt file, extra rows are filled as -1
| Pixel properties | Quadrant properties | ||||||
|---|---|---|---|---|---|---|---|
| Quadrant | DetID | PixID | Counts | Sigma | Mean | Median | Sigma |
| A | 8 | 15 | 14642 | 89.78 | 765 | 753 | 154.7 |
| A | 3 | 1 | 10635 | 63.88 | 765 | 753 | 154.7 |
| A | 0 | 226 | 7177 | 41.53 | 765 | 753 | 154.7 |
| B | 4 | 239 | 133585 | 935.29 | 753 | 738 | 142.0 |
| B | 4 | 81 | 88838 | 620.26 | 753 | 738 | 142.0 |
| B | 0 | 214 | 80733 | 563.19 | 753 | 738 | 142.0 |
| C | 13 | 61 | 5394 | 28.09 | 726 | 733 | 165.9 |
| C | 8 | 128 | 4551 | 23.01 | 726 | 733 | 165.9 |
| C | 14 | 67 | 3571 | 17.1 | 726 | 733 | 165.9 |
| D | 13 | 104 | 158330 | 899.64 | 734 | 715 | 175.2 |
| D | 7 | 71 | 157641 | 895.71 | 734 | 715 | 175.2 |
| D | 8 | 195 | 84312 | 477.16 | 734 | 715 | 175.2 |
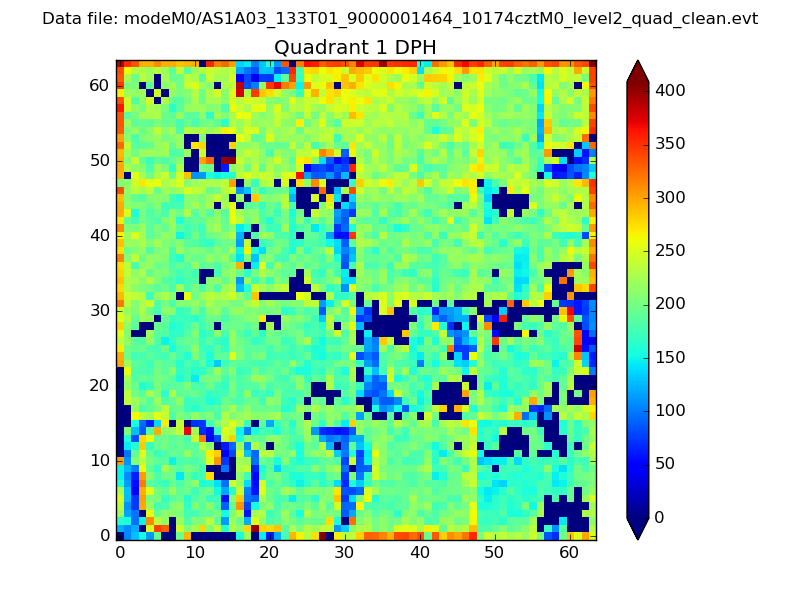
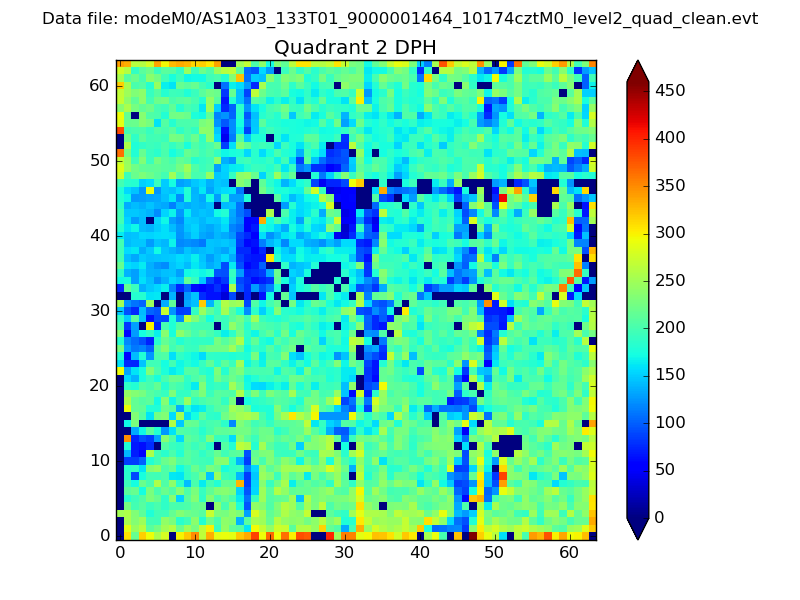
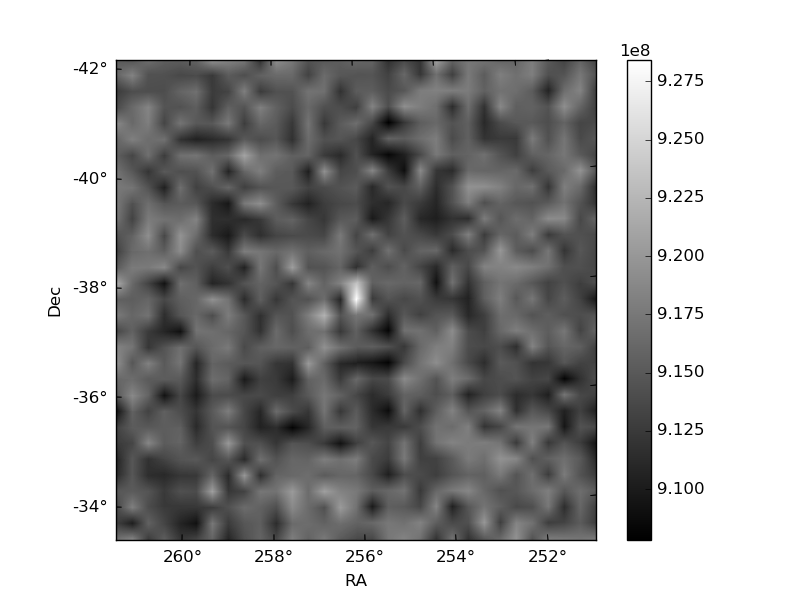
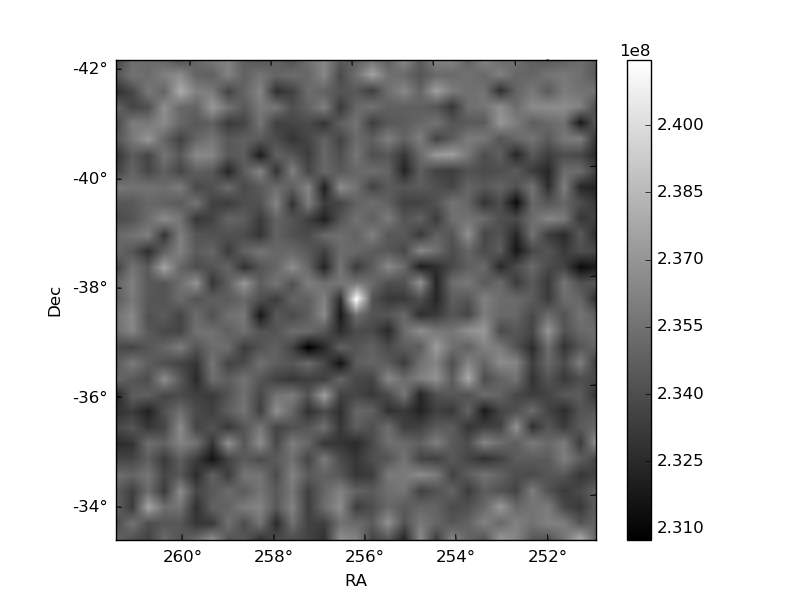
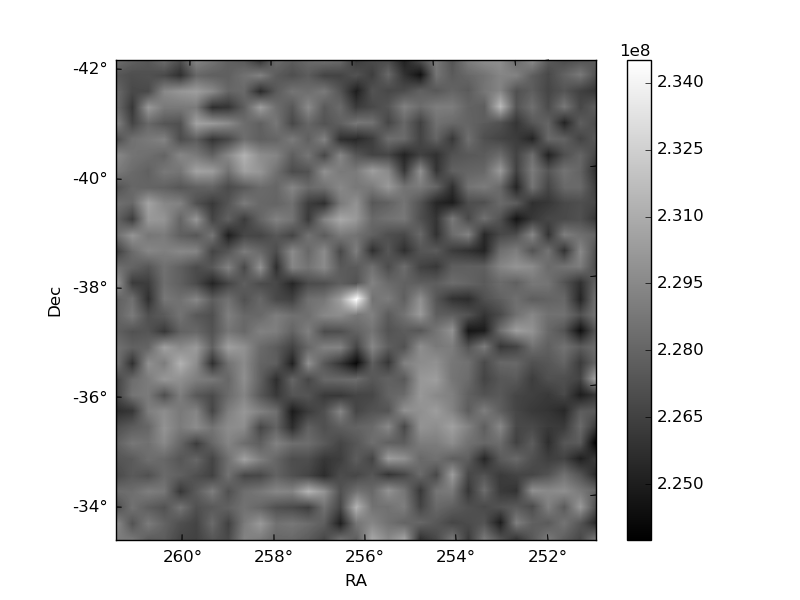
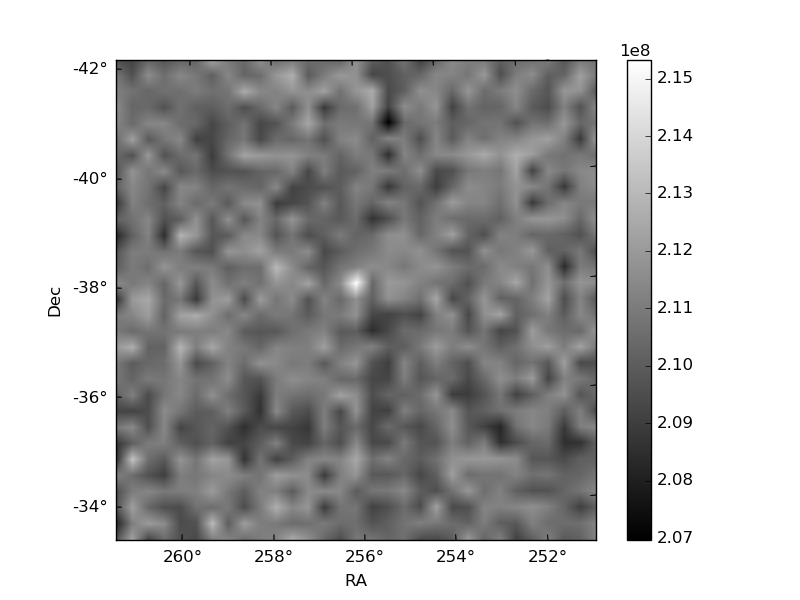
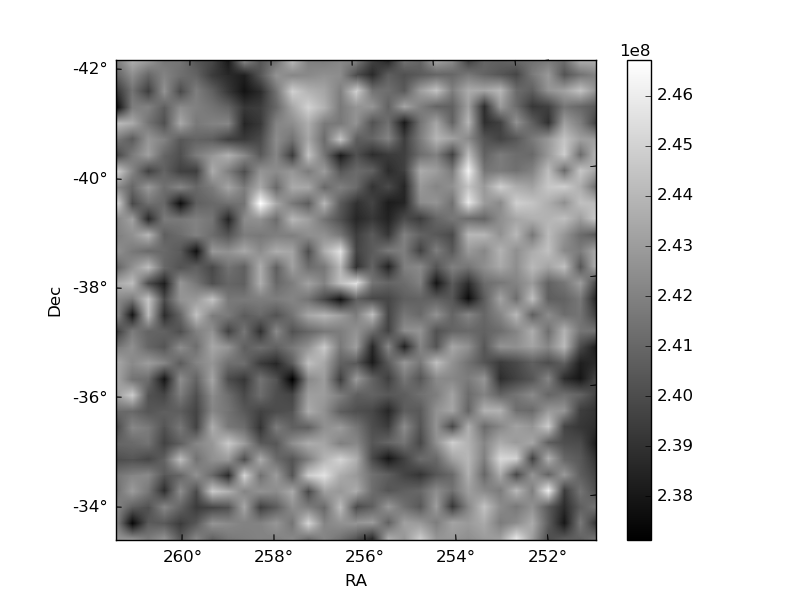
Histogram calculated using DETX and DETY for each event in the final _common_clean file
| Quadrant A | 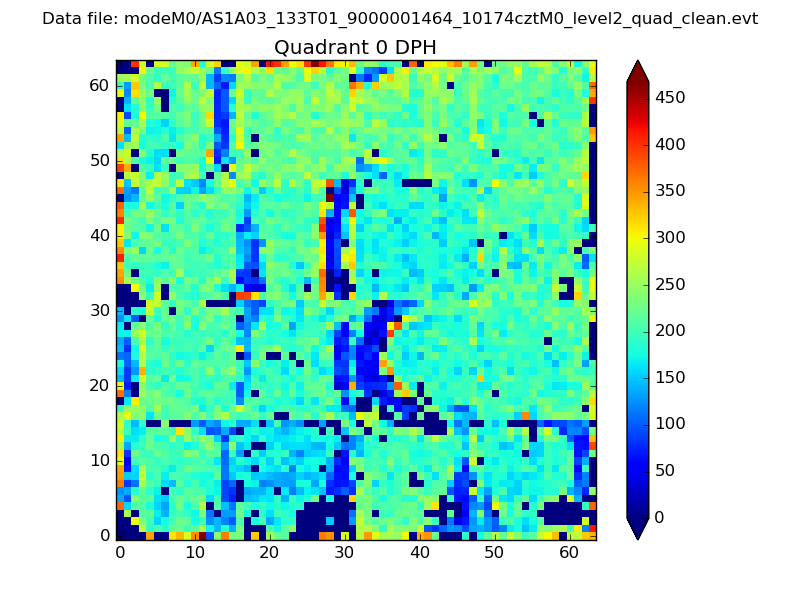 |
 |
Quadrant B |
|---|---|---|---|
| Quadrant D | 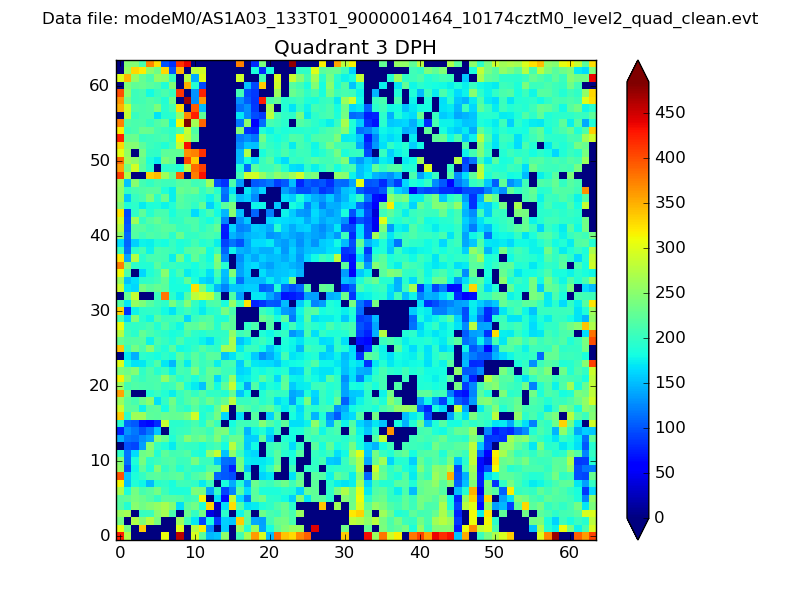 |
 |
Quadrant C |
| Plot type | Count rate plots | Images |
|---|---|---|
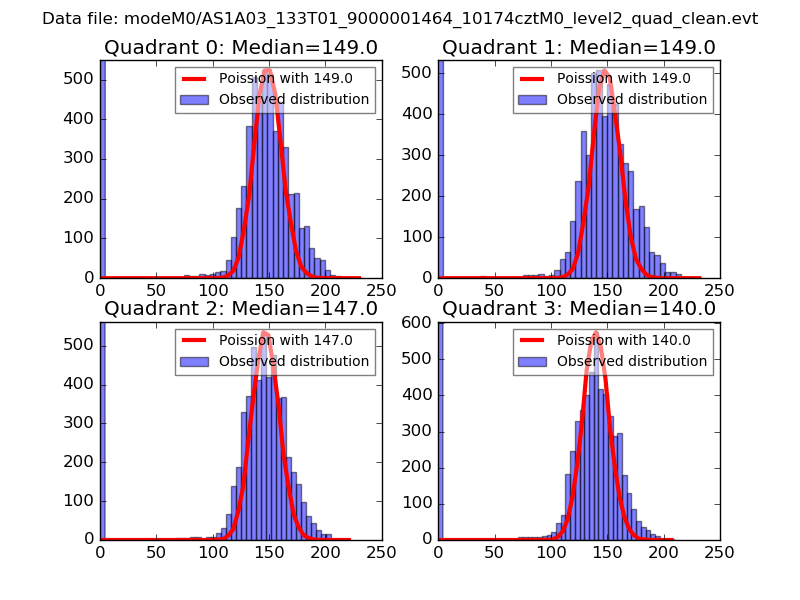
| Comparison with Poisson distribution Blue bars denote a histogram of data divided into 1 sec bins. Red curve is a Poisson curve with rate = median count rate of data. |
 |
 |
| Quadrant-wise count rates Data is divided into 100 sec bins |
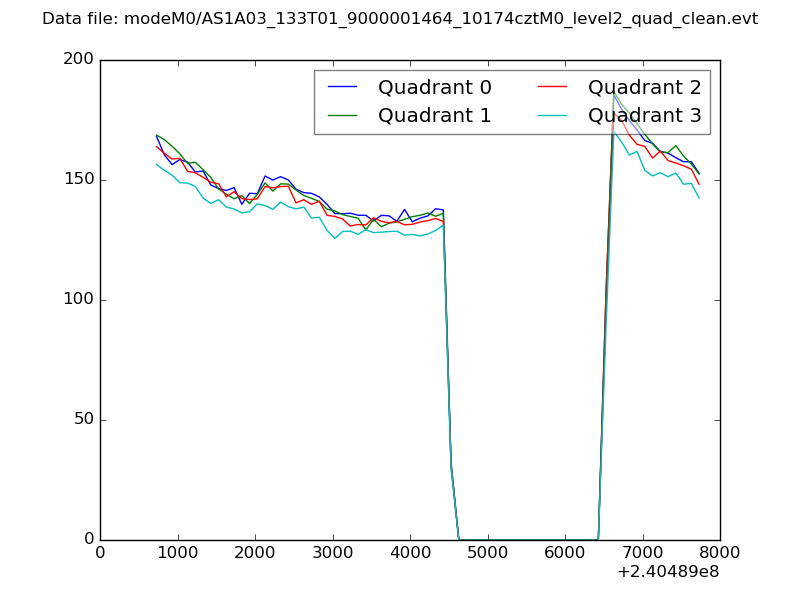 |
|
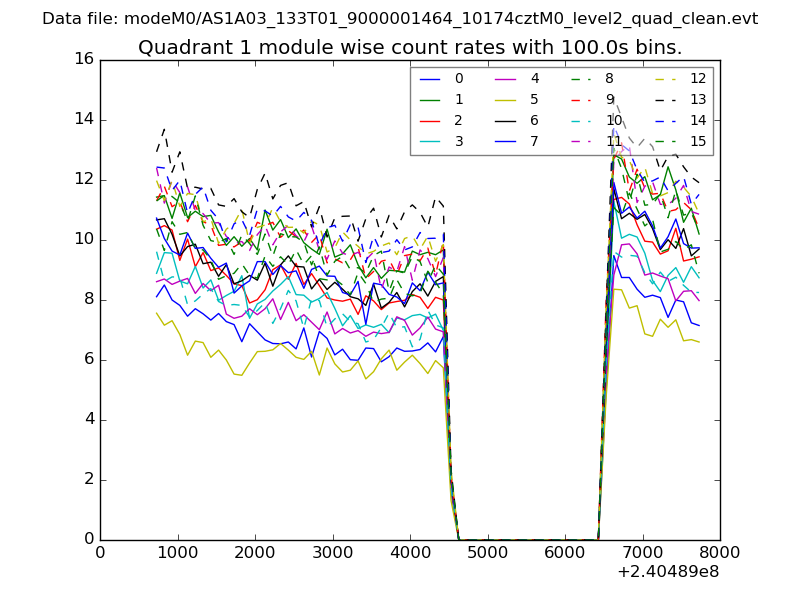
| Module-wise count rates for Quadrant A Data is divided into 100 sec bins |
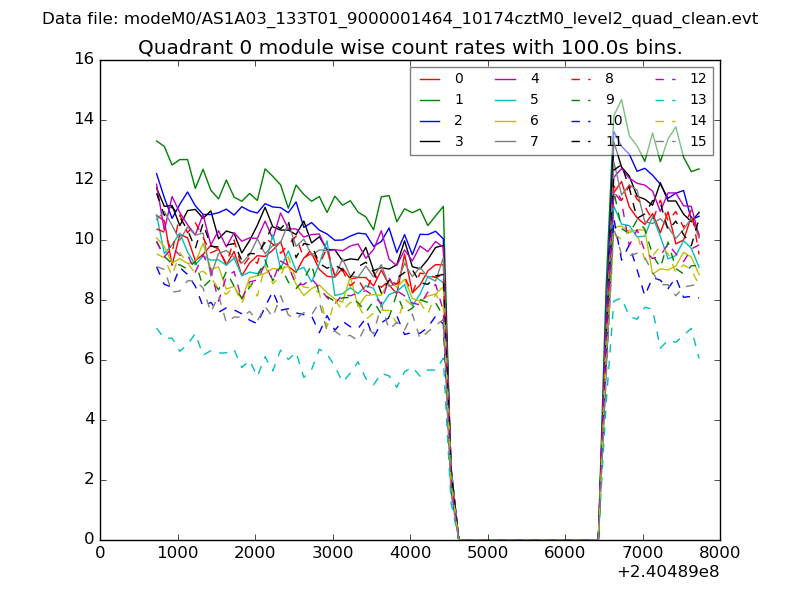 |
 |
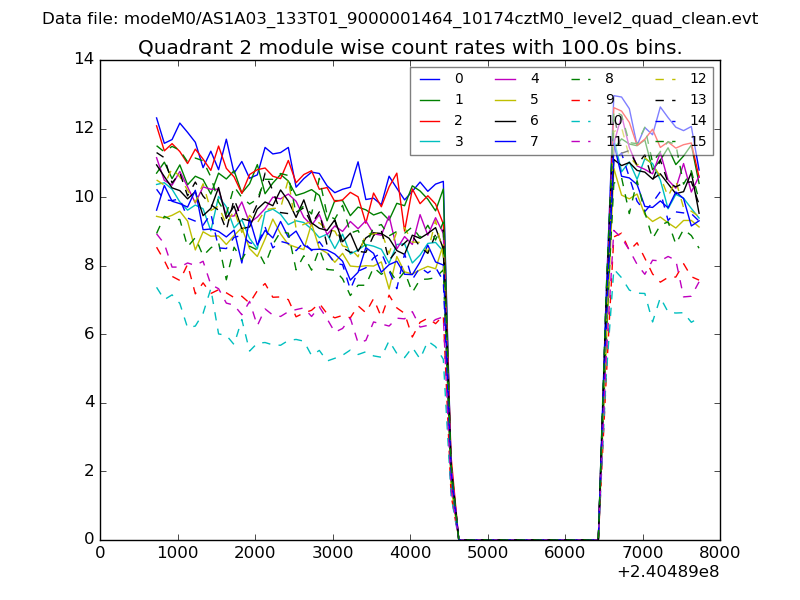
| Module-wise count rates for Quadrant B Data is divided into 100 sec bins |
 |
 |
| Module-wise count rates for Quadrant C Data is divided into 100 sec bins |
 |
 |
| Module-wise count rates for Quadrant D Data is divided into 100 sec bins |
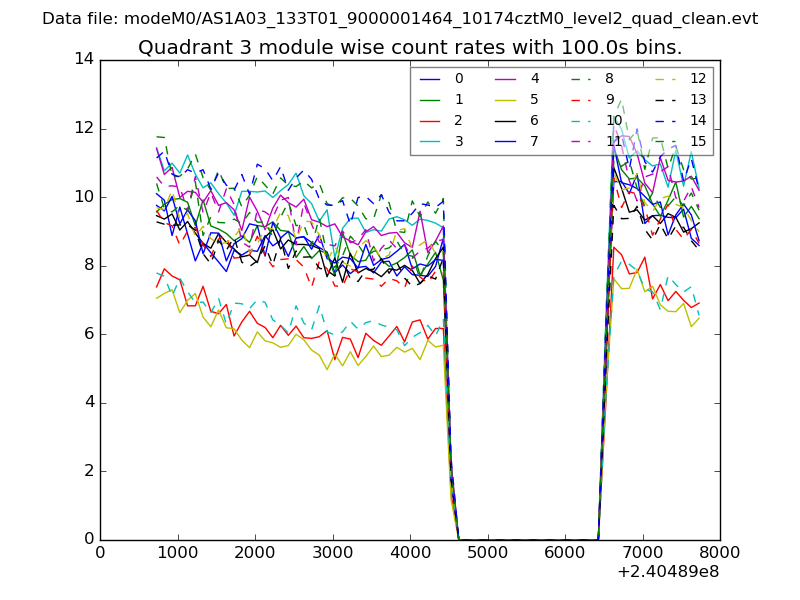 |
 |
| Parameter | Plot |
|---|---|
| CZT HV Monitor | 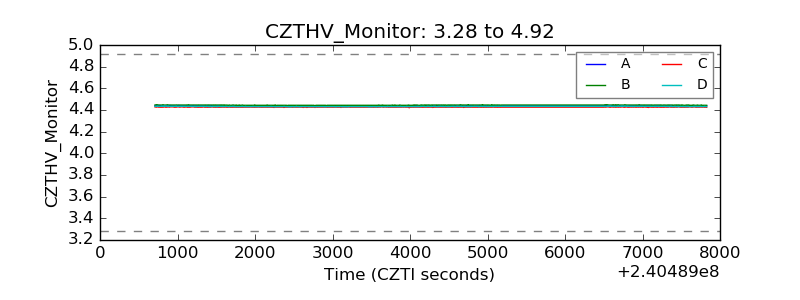 |
| D_VDD | 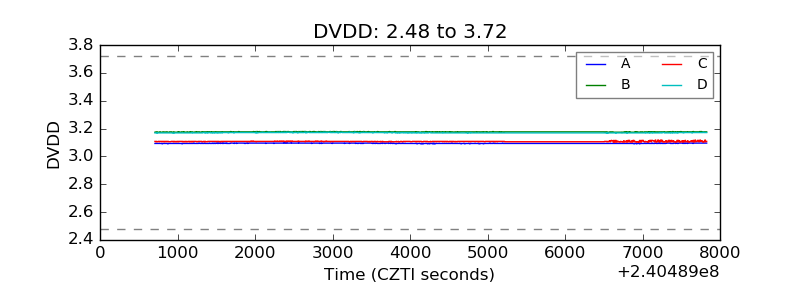 |
| Temperature 1 | 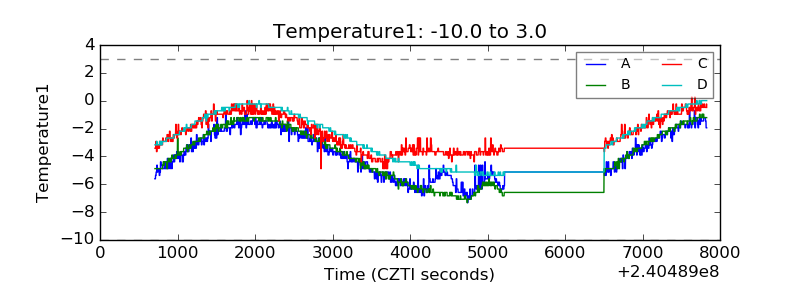 |
| Veto HV Monitor | 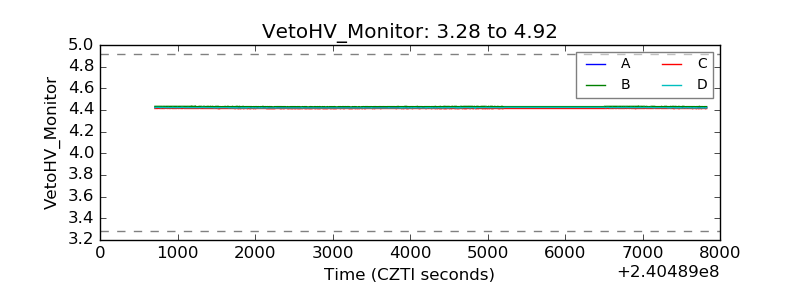 |
| Veto LLD | 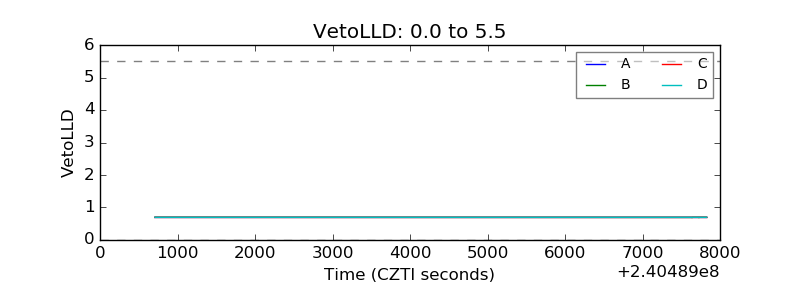 |
| Alpha Counter | 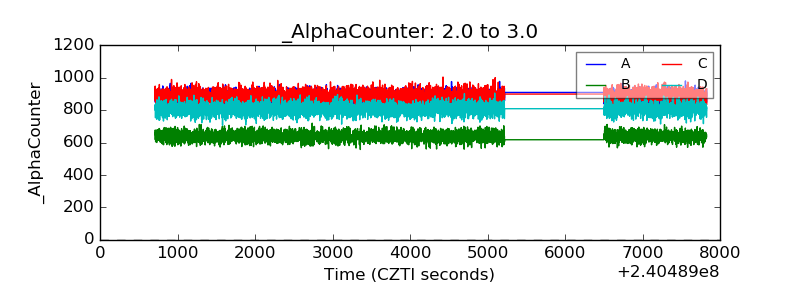 |
| _CPM_Rate | 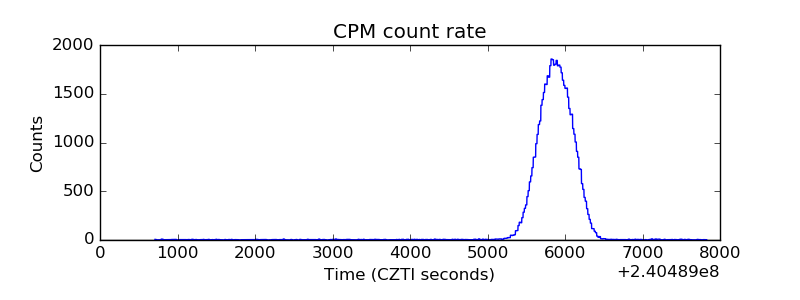 |
| CZT Counter | 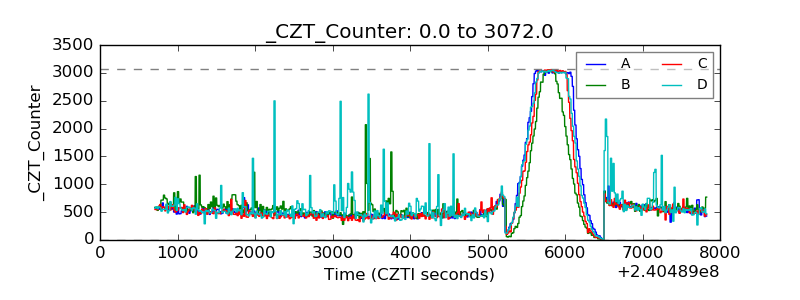 |
| +2.5 Volts monitor |  |
| +5 Volts monitor |  |
| _ROLL_ROT | 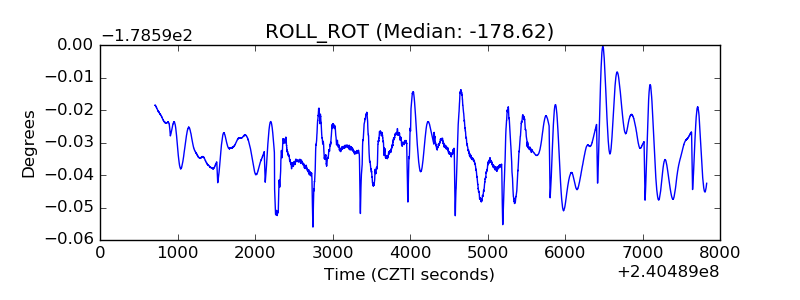 |
| _Roll_DEC | 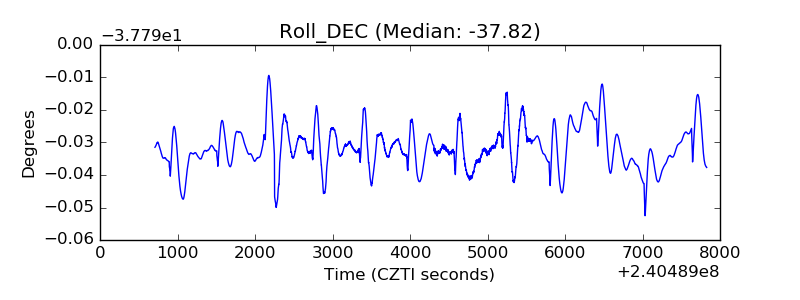 |
| _Roll_RA | 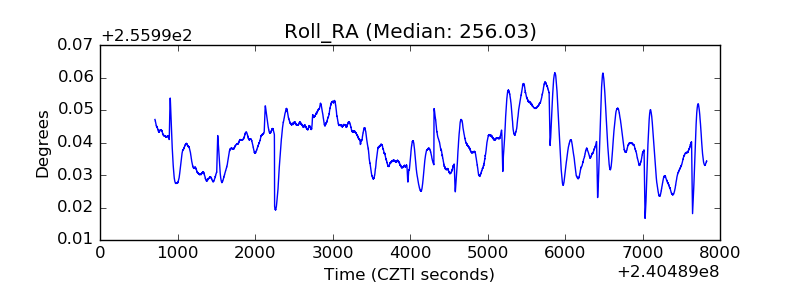 |
| Veto Counter | 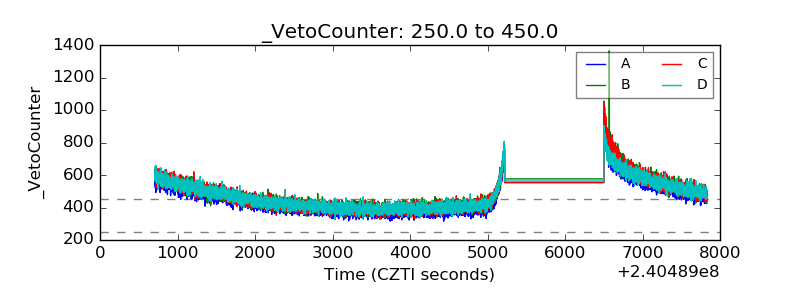 |