| Param | Original file | Final file |
|---|---|---|
| Filename | modeM0/AS1A03_133T01_9000001464_10175cztM0_level2.evt | modeM0/AS1A03_133T01_9000001464_10175cztM0_level2_quad_clean.evt |
| Size (bytes) | 427,743,360 | 108,478,080 |
| Size | 407.9 MB | 103.5 MB |
| Events in quadrant A | 2,979,673 | 736,159 |
| Events in quadrant B | 3,299,266 | 733,025 |
| Events in quadrant C | 2,819,399 | 717,609 |
| Events in quadrant D | 3,456,728 | 688,233 |
| Mode SS | |||
|---|---|---|---|
| Quadrant | BADHDUFLAG | Total packets | Discarded packets |
| A | 0 | 120 | 0 |
| B | 0 | 120 | 0 |
| C | 0 | 120 | 0 |
| D | 0 | 120 | 0 |
| Mode M0 | |||
|---|---|---|---|
| Quadrant | BADHDUFLAG | Total packets | Discarded packets |
| A | 0 | 12527 | 2 |
| B | 0 | 13637 | 1 |
| C | 0 | 12185 | 1 |
| D | 0 | 13981 | 1 |
| Mode M9 | |||
|---|---|---|---|
| Quadrant | BADHDUFLAG | Total packets | Discarded packets |
| A | 0 | 13 | 0 |
| B | 0 | 13 | 0 |
| C | 0 | 13 | 0 |
| D | 0 | 13 | 0 |
| Quadrant | Total seconds | Saturated seconds | Saturation percentage |
|---|---|---|---|
| A | 5871 | 72 | 1.226367% |
| B | 5871 | 82 | 1.396696% |
| C | 5871 | 38 | 0.647249% |
| D | 5871 | 87 | 1.481860% |
Noise dominated data is calculated using 1-second bins in cleaned event files. If a bin has >2000 counts, and if more than 50% of those come from <1% of pixels, then it is considered to be noise-dominated and hence unusable.
| Quadrant | # 1 sec bins | Bins with >0 counts | Bins with >2000 counts | High rate bins dominated by noise | Noise dominated (total time) | Noise dominated (detector-on time) | Marked lightcurve |
|---|---|---|---|---|---|---|---|
| A | 7186 | 5871 | 1 | 1 | 0.01% | 0.02% | 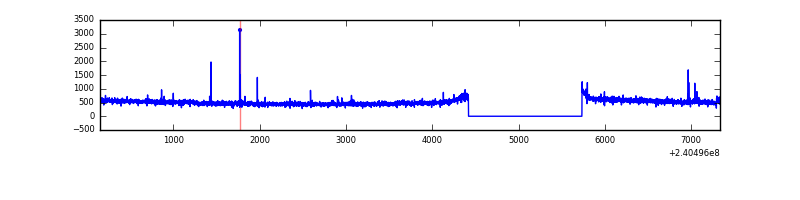 |
| B | 7186 | 5872 | 13 | 13 | 0.18% | 0.22% | 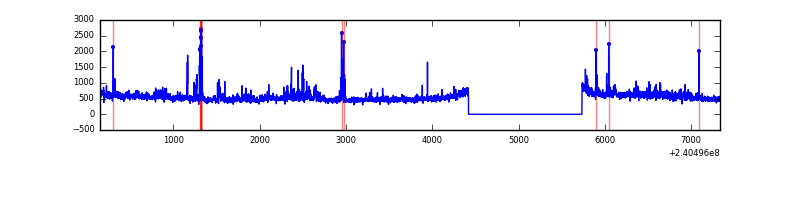 |
| C | 7186 | 5872 | 0 | 0 | 0.00% | 0.00% | 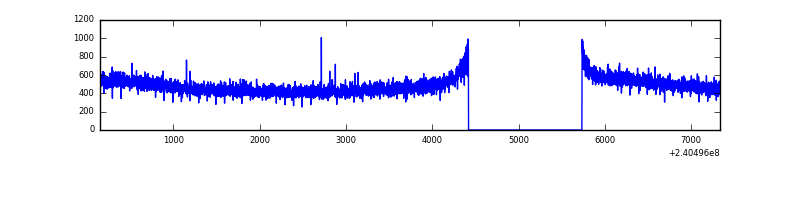 |
| D | 7186 | 5871 | 31 | 31 | 0.43% | 0.53% | 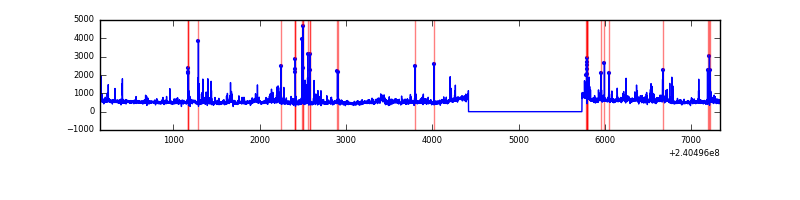 |
Top three noisy pixels from each quadrant. If the there are fewer than three noisy pixels in the level2.evt file, extra rows are filled as -1
| Pixel properties | Quadrant properties | ||||||
|---|---|---|---|---|---|---|---|
| Quadrant | DetID | PixID | Counts | Sigma | Mean | Median | Sigma |
| A | 15 | 174 | 20355 | 127.69 | 760 | 746 | 153.6 |
| A | 3 | 1 | 19105 | 119.55 | 760 | 746 | 153.6 |
| A | 8 | 15 | 16367 | 101.72 | 760 | 746 | 153.6 |
| B | 0 | 214 | 73413 | 518.4 | 748 | 735 | 140.2 |
| B | 5 | 255 | 57492 | 404.84 | 748 | 735 | 140.2 |
| B | 0 | 85 | 54611 | 384.29 | 748 | 735 | 140.2 |
| C | 8 | 128 | 7771 | 42.82 | 718 | 724 | 164.6 |
| C | 13 | 61 | 5574 | 29.47 | 718 | 724 | 164.6 |
| C | 8 | 112 | 4747 | 24.45 | 718 | 724 | 164.6 |
| D | 2 | 16 | 243243 | 1404.99 | 723 | 705 | 172.6 |
| D | 7 | 71 | 134420 | 774.59 | 723 | 705 | 172.6 |
| D | 8 | 195 | 112382 | 646.93 | 723 | 705 | 172.6 |
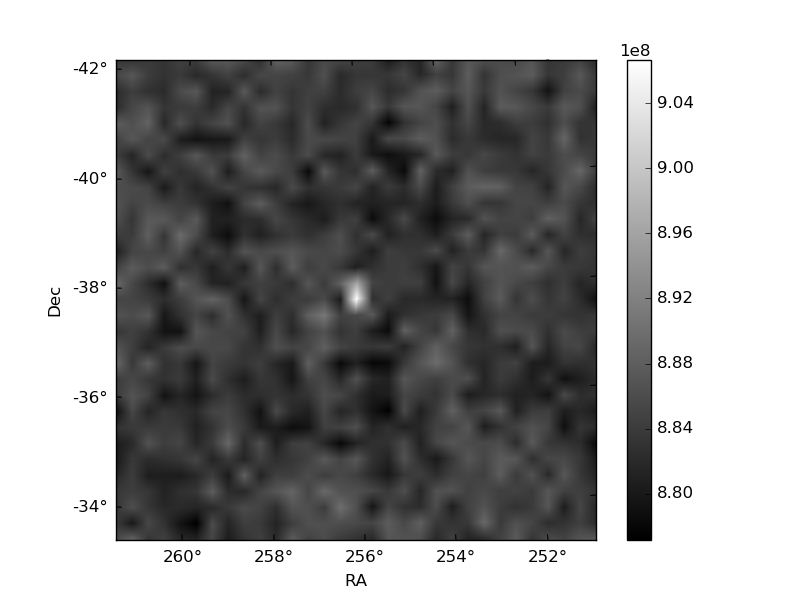
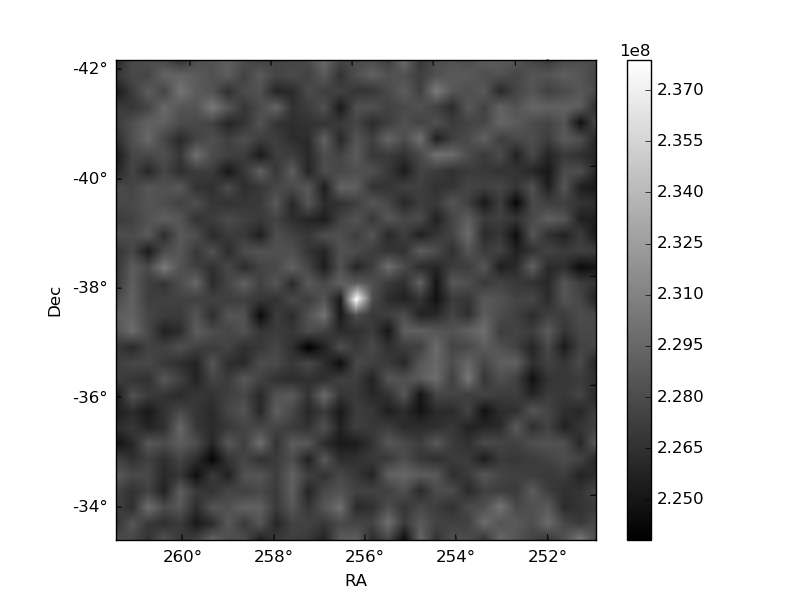
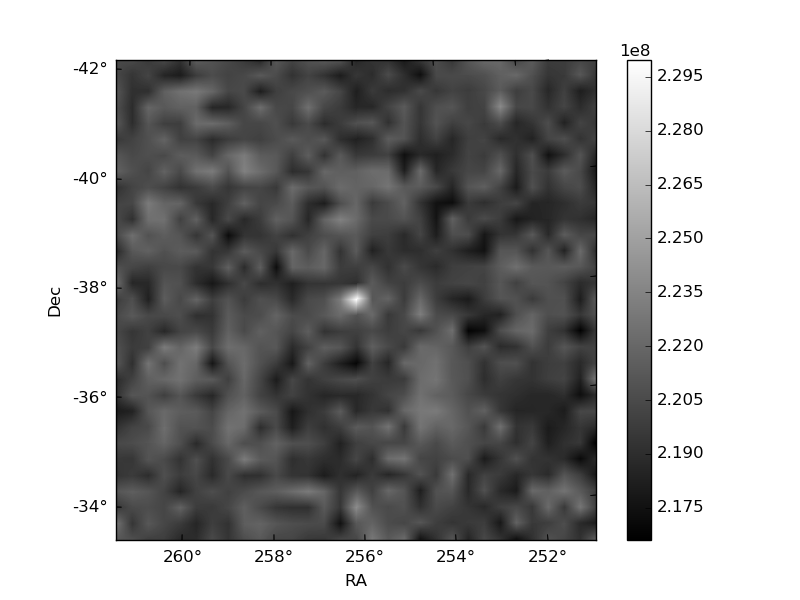
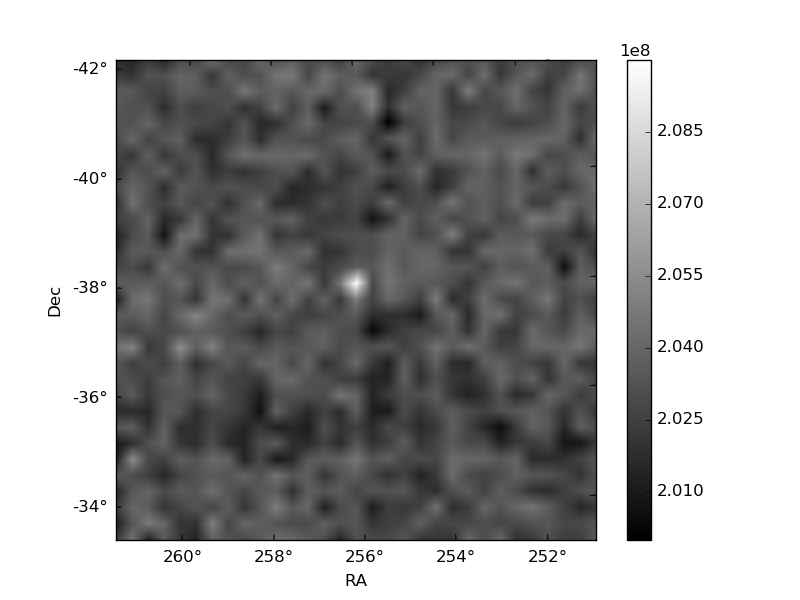
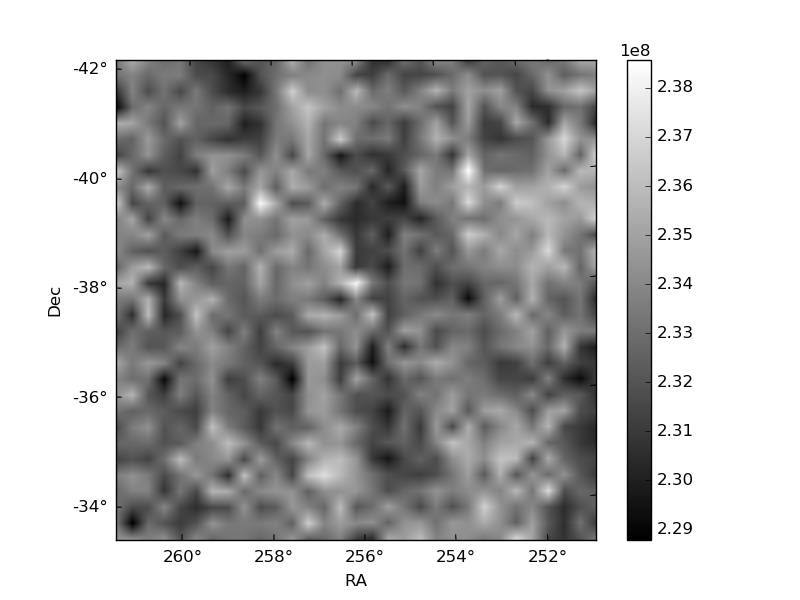
Histogram calculated using DETX and DETY for each event in the final _common_clean file
| Quadrant A | 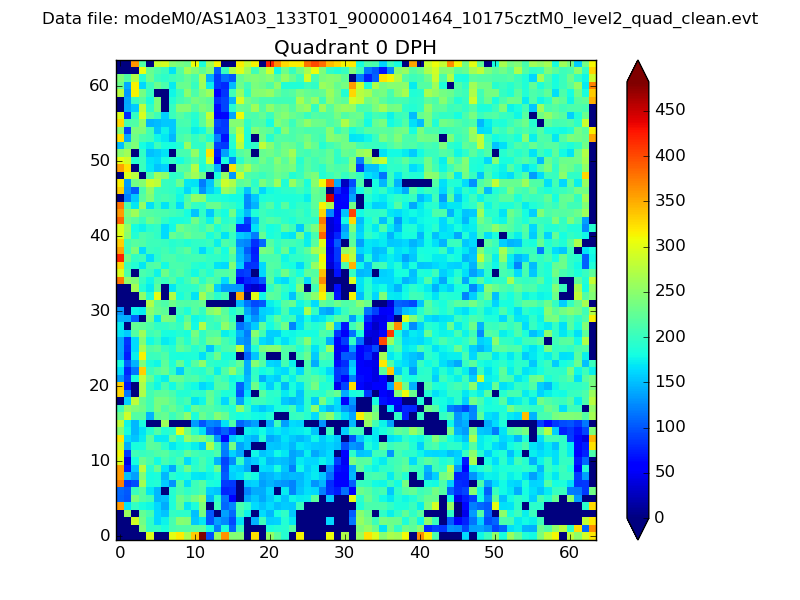 |
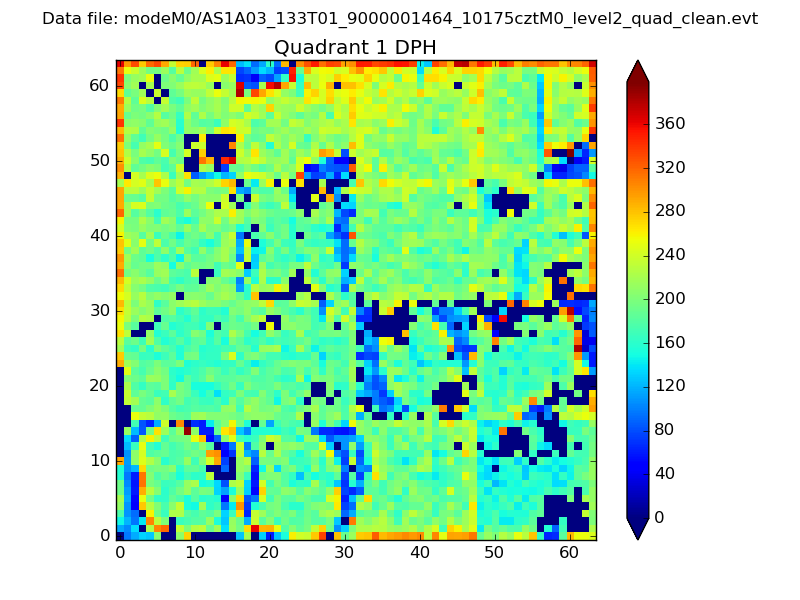 |
Quadrant B |
|---|---|---|---|
| Quadrant D | 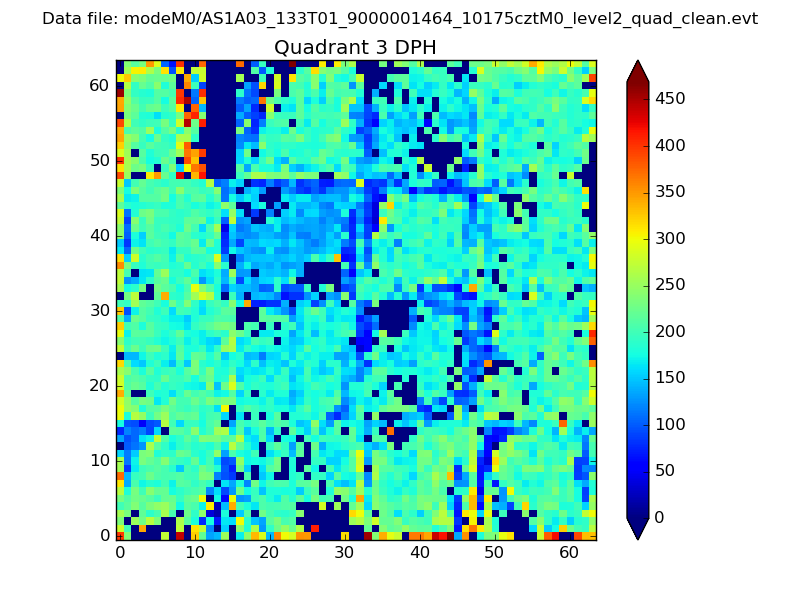 |
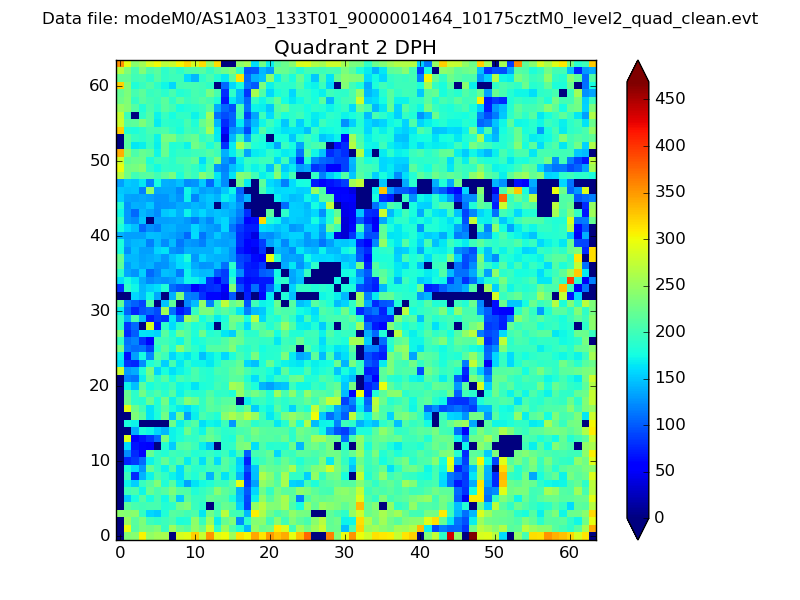 |
Quadrant C |
| Plot type | Count rate plots | Images |
|---|---|---|
| Comparison with Poisson distribution Blue bars denote a histogram of data divided into 1 sec bins. Red curve is a Poisson curve with rate = median count rate of data. |
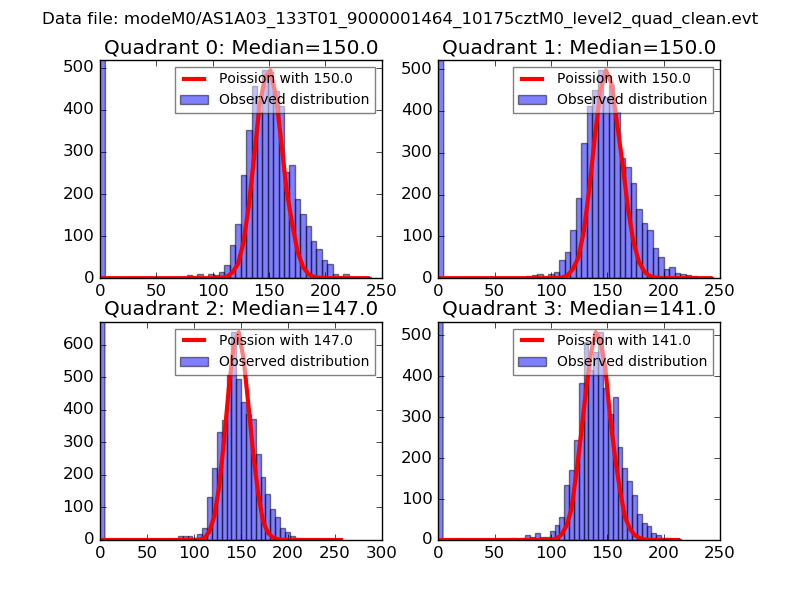 |
 |
| Quadrant-wise count rates Data is divided into 100 sec bins |
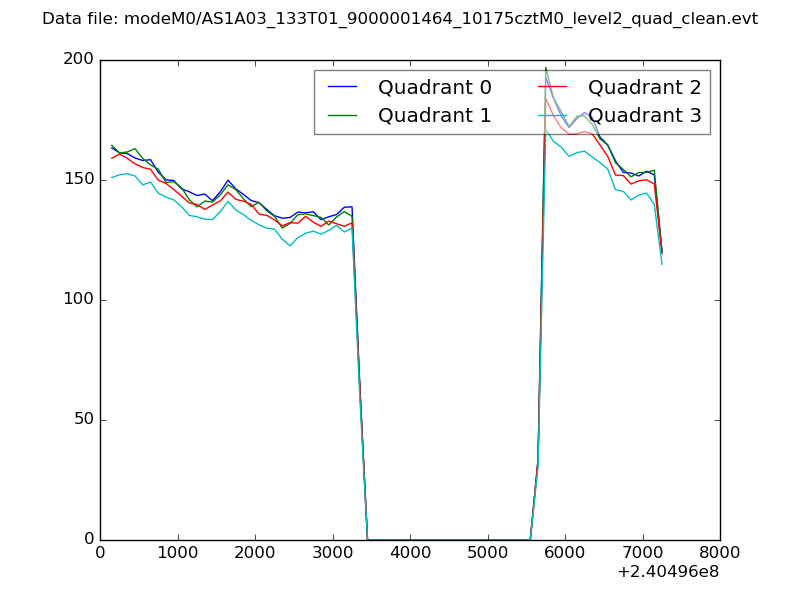 |
|
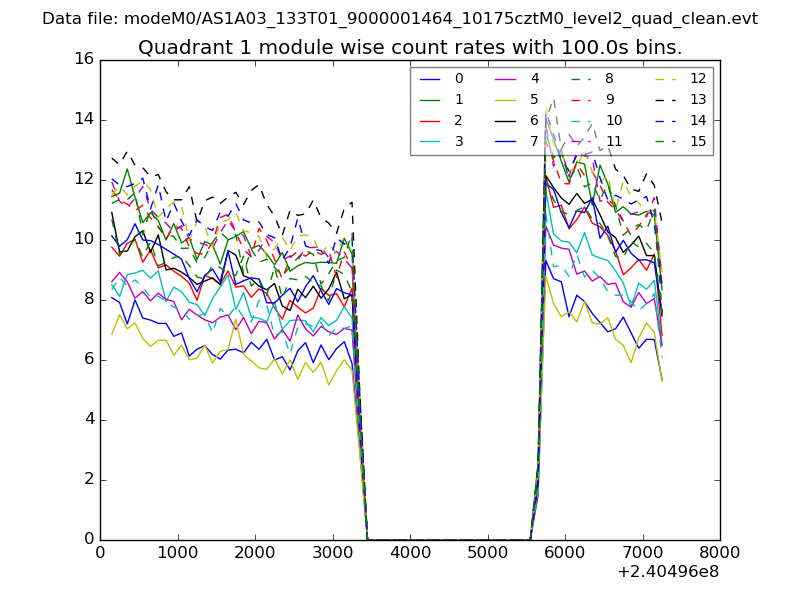
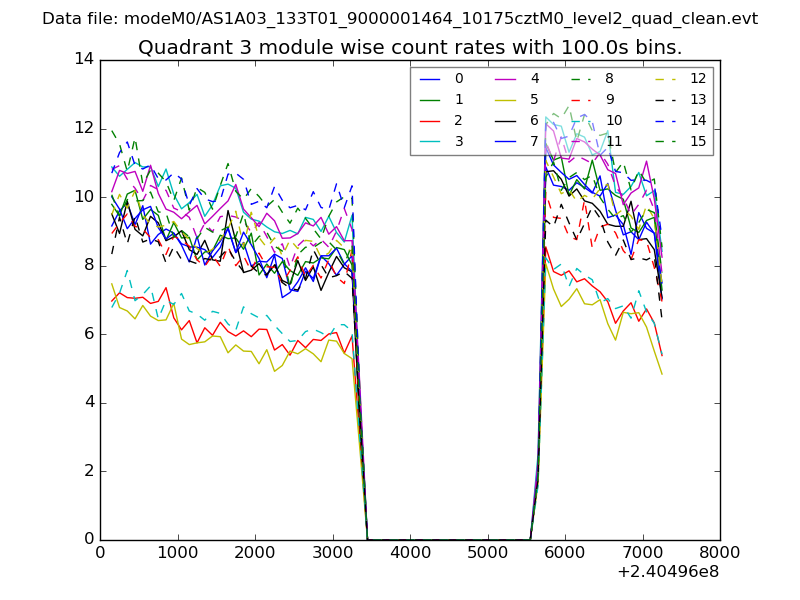
| Module-wise count rates for Quadrant A Data is divided into 100 sec bins |
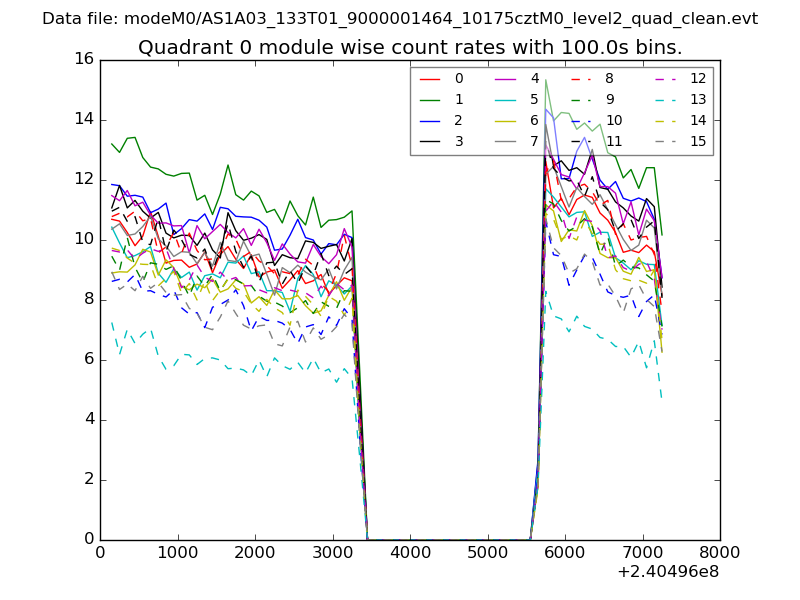 |
 |
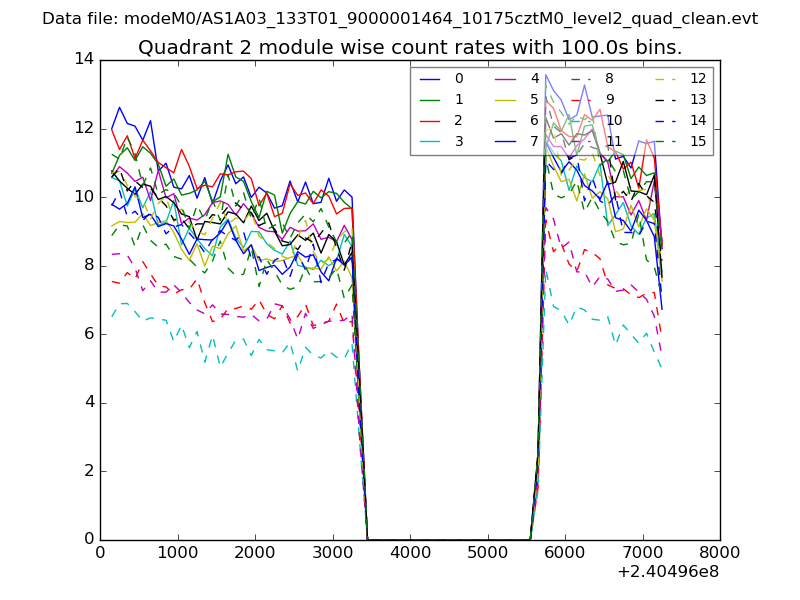
| Module-wise count rates for Quadrant B Data is divided into 100 sec bins |
 |
 |
| Module-wise count rates for Quadrant C Data is divided into 100 sec bins |
 |
 |
| Module-wise count rates for Quadrant D Data is divided into 100 sec bins |
 |
 |
| Parameter | Plot |
|---|---|
| CZT HV Monitor | 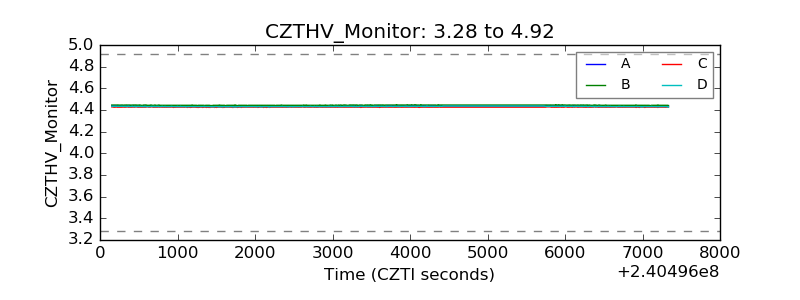 |
| D_VDD | 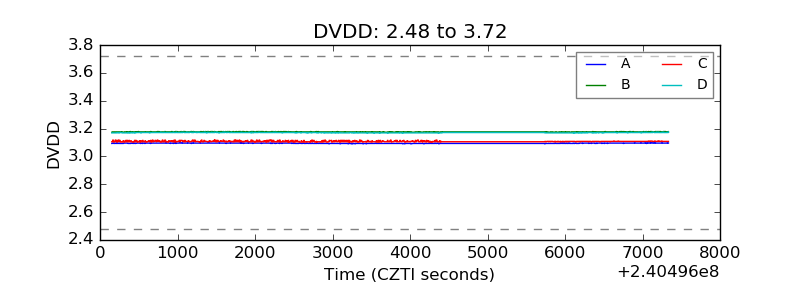 |
| Temperature 1 | 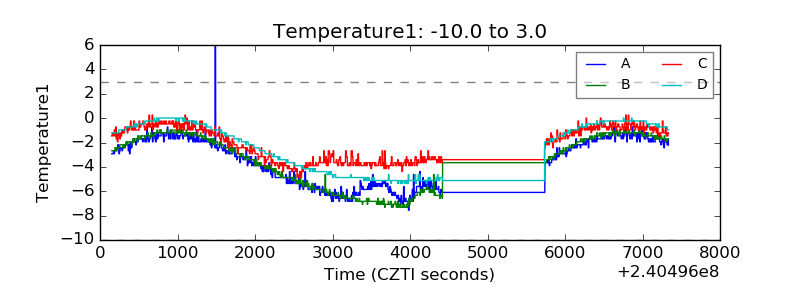 |
| Veto HV Monitor | 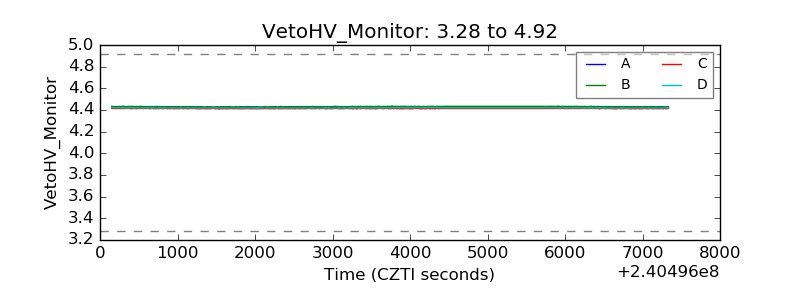 |
| Veto LLD | 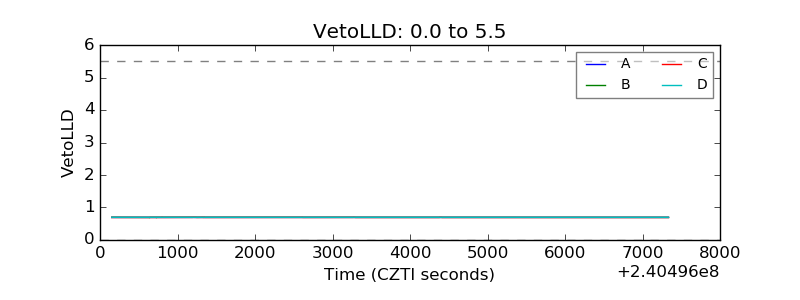 |
| Alpha Counter | 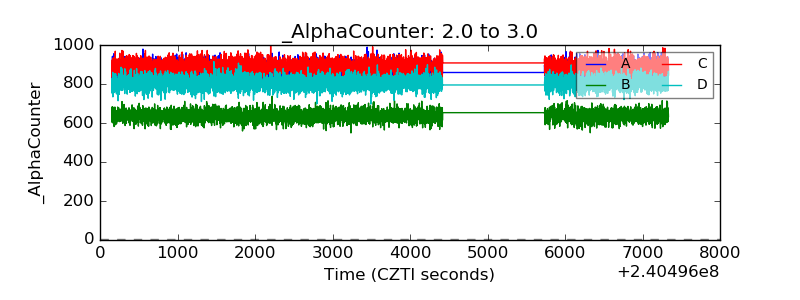 |
| _CPM_Rate | 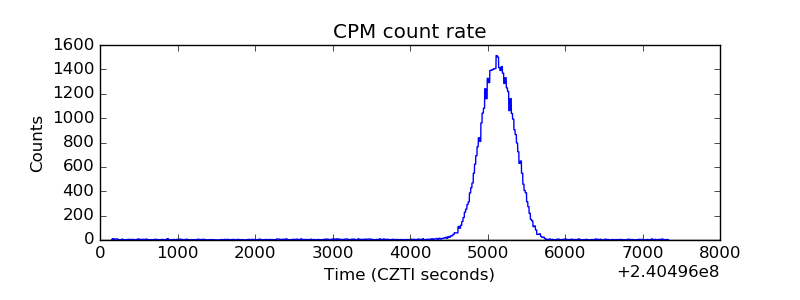 |
| CZT Counter | 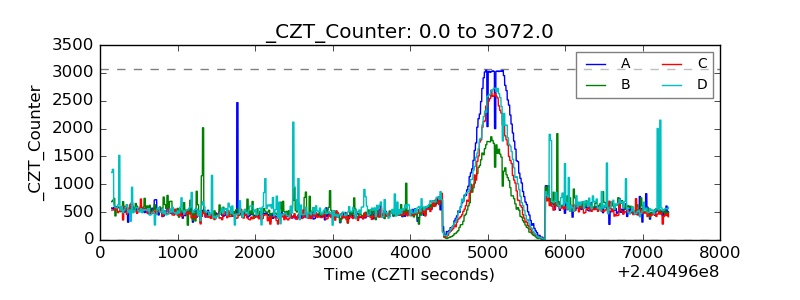 |
| +2.5 Volts monitor | 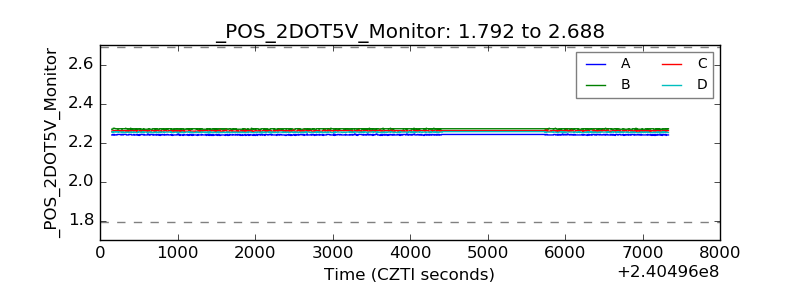 |
| +5 Volts monitor | 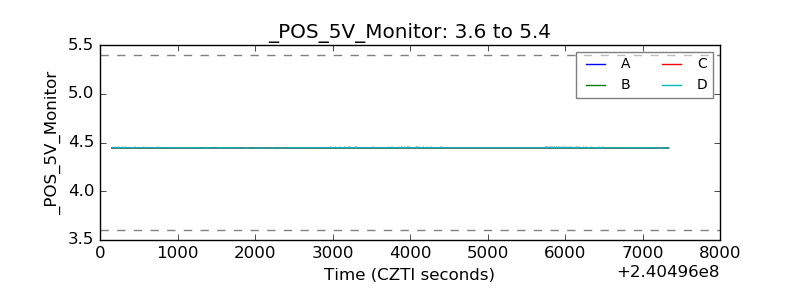 |
| _ROLL_ROT | 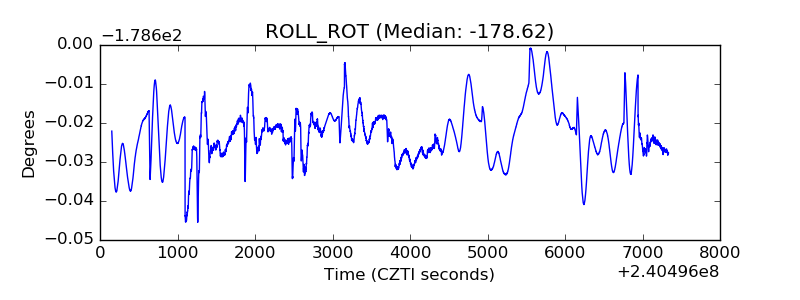 |
| _Roll_DEC | 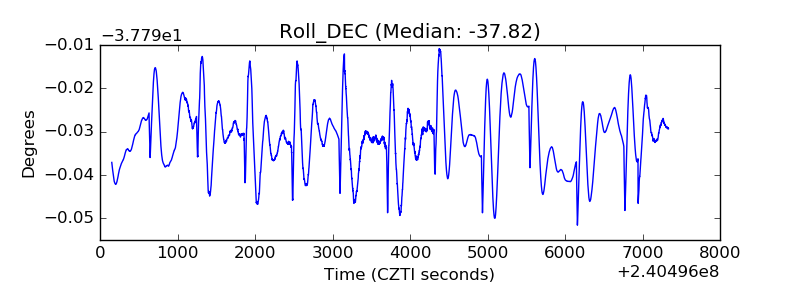 |
| _Roll_RA | 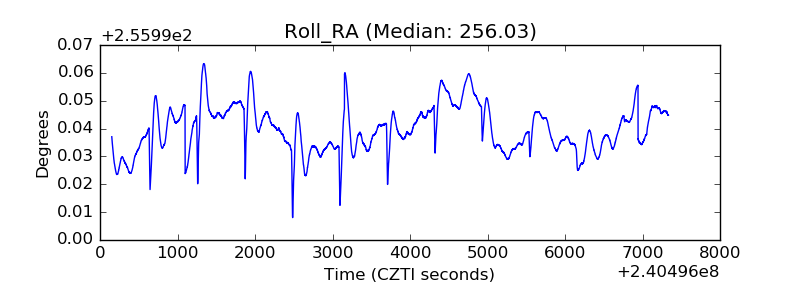 |
| Veto Counter | 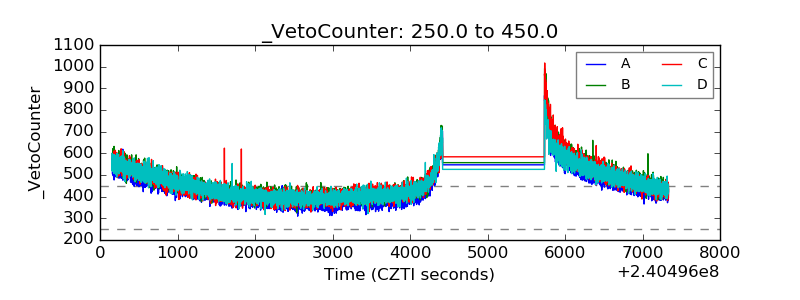 |