| Param | Original file | Final file |
|---|---|---|
| Filename | modeM0/AS1A03_133T01_9000001464_10176cztM0_level2.evt | modeM0/AS1A03_133T01_9000001464_10176cztM0_level2_quad_clean.evt |
| Size (bytes) | 399,775,680 | 88,056,000 |
| Size | 381.3 MB | 84.0 MB |
| Events in quadrant A | 2,820,990 | 581,487 |
| Events in quadrant B | 2,945,146 | 579,626 |
| Events in quadrant C | 2,578,958 | 568,582 |
| Events in quadrant D | 3,379,009 | 542,933 |
| Mode SS | |||
|---|---|---|---|
| Quadrant | BADHDUFLAG | Total packets | Discarded packets |
| A | 0 | 114 | 0 |
| B | 0 | 114 | 0 |
| C | 0 | 114 | 0 |
| D | 0 | 114 | 0 |
| Mode M0 | |||
|---|---|---|---|
| Quadrant | BADHDUFLAG | Total packets | Discarded packets |
| A | 0 | 11843 | 2 |
| B | 0 | 12498 | 1 |
| C | 0 | 11573 | 1 |
| D | 0 | 13758 | 1 |
| Mode M9 | |||
|---|---|---|---|
| Quadrant | BADHDUFLAG | Total packets | Discarded packets |
| A | 0 | 13 | 0 |
| B | 0 | 13 | 0 |
| C | 0 | 13 | 0 |
| D | 0 | 13 | 0 |
| Quadrant | Total seconds | Saturated seconds | Saturation percentage |
|---|---|---|---|
| A | 5635 | 72 | 1.277728% |
| B | 5635 | 77 | 1.366460% |
| C | 5635 | 34 | 0.603372% |
| D | 5635 | 74 | 1.313221% |
Noise dominated data is calculated using 1-second bins in cleaned event files. If a bin has >2000 counts, and if more than 50% of those come from <1% of pixels, then it is considered to be noise-dominated and hence unusable.
| Quadrant | # 1 sec bins | Bins with >0 counts | Bins with >2000 counts | High rate bins dominated by noise | Noise dominated (total time) | Noise dominated (detector-on time) | Marked lightcurve |
|---|---|---|---|---|---|---|---|
| A | 6890 | 5635 | 0 | 0 | 0.00% | 0.00% | 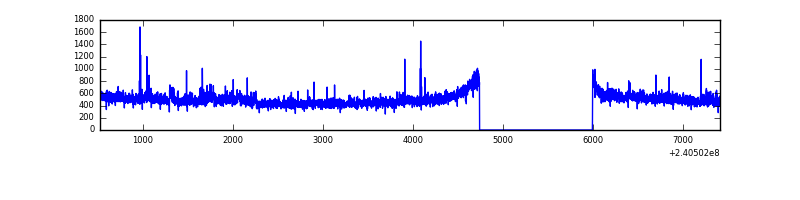 |
| B | 6890 | 5636 | 4 | 4 | 0.06% | 0.07% | 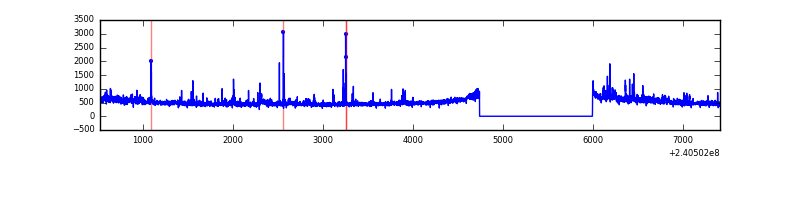 |
| C | 6890 | 5636 | 0 | 0 | 0.00% | 0.00% | 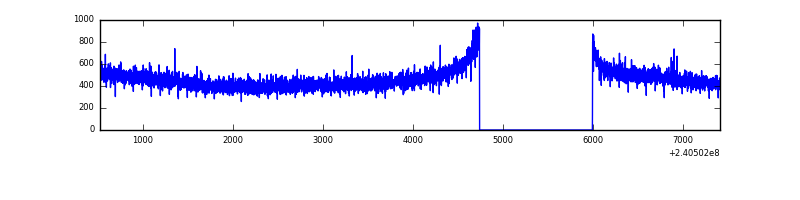 |
| D | 6890 | 5636 | 22 | 22 | 0.32% | 0.39% | 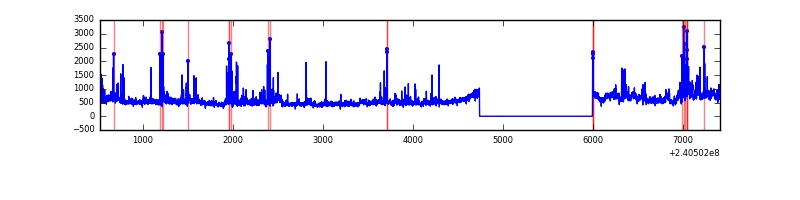 |
Top three noisy pixels from each quadrant. If the there are fewer than three noisy pixels in the level2.evt file, extra rows are filled as -1
| Pixel properties | Quadrant properties | ||||||
|---|---|---|---|---|---|---|---|
| Quadrant | DetID | PixID | Counts | Sigma | Mean | Median | Sigma |
| A | 8 | 15 | 64713 | 453.51 | 696 | 683 | 141.2 |
| A | 15 | 174 | 53734 | 375.75 | 696 | 683 | 141.2 |
| A | 3 | 1 | 20172 | 138.04 | 696 | 683 | 141.2 |
| B | 0 | 214 | 85463 | 649.6 | 690 | 675 | 130.5 |
| B | 0 | 219 | 43310 | 326.64 | 690 | 675 | 130.5 |
| B | 4 | 81 | 42502 | 320.45 | 690 | 675 | 130.5 |
| C | 13 | 61 | 5105 | 29.18 | 660 | 667 | 152.1 |
| C | 14 | 67 | 2657 | 13.09 | 660 | 667 | 152.1 |
| C | 0 | 207 | 2564 | 12.47 | 660 | 667 | 152.1 |
| D | 1 | 52 | 238299 | 1489.06 | 663 | 644 | 159.6 |
| D | 2 | 16 | 191653 | 1196.79 | 663 | 644 | 159.6 |
| D | 7 | 71 | 172560 | 1077.16 | 663 | 644 | 159.6 |
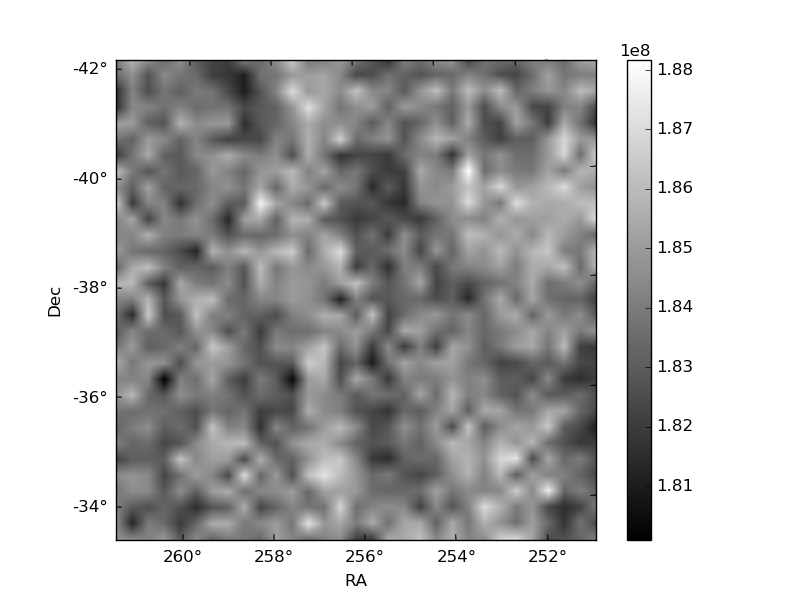
Histogram calculated using DETX and DETY for each event in the final _common_clean file
| Quadrant A | 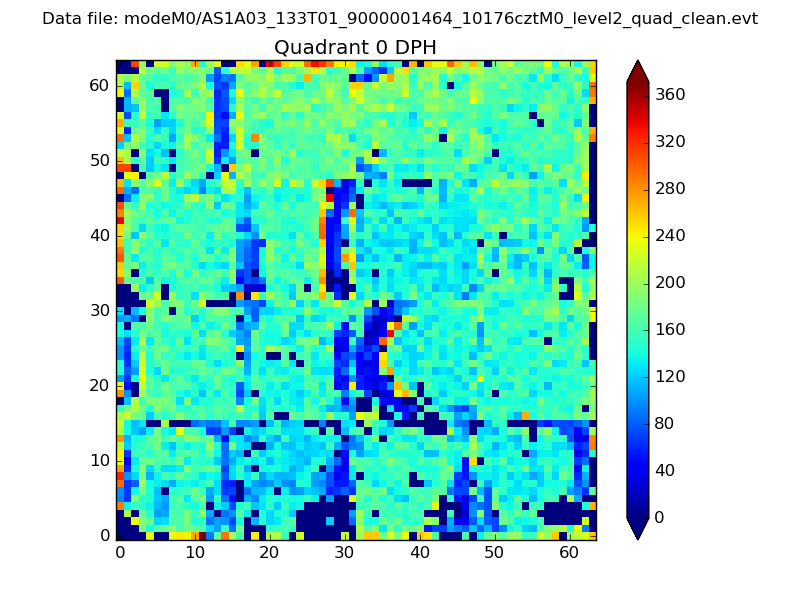 |
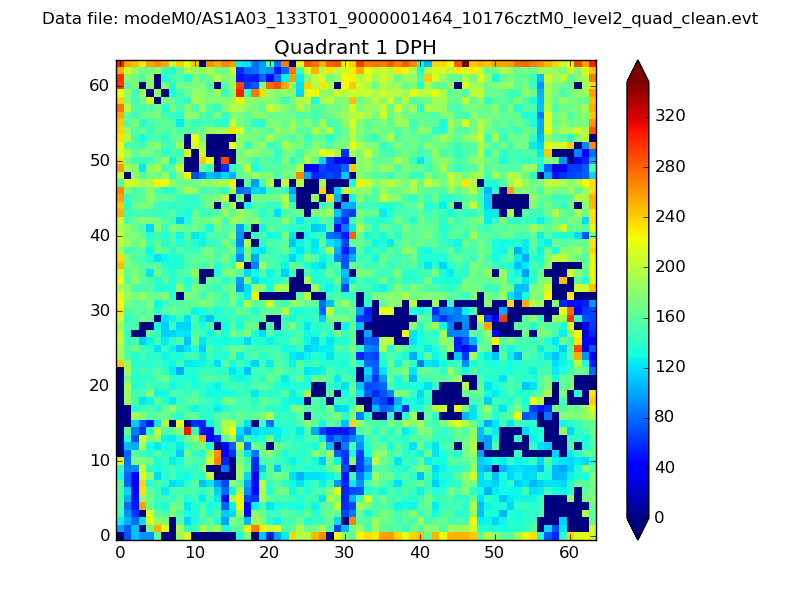 |
Quadrant B |
|---|---|---|---|
| Quadrant D | 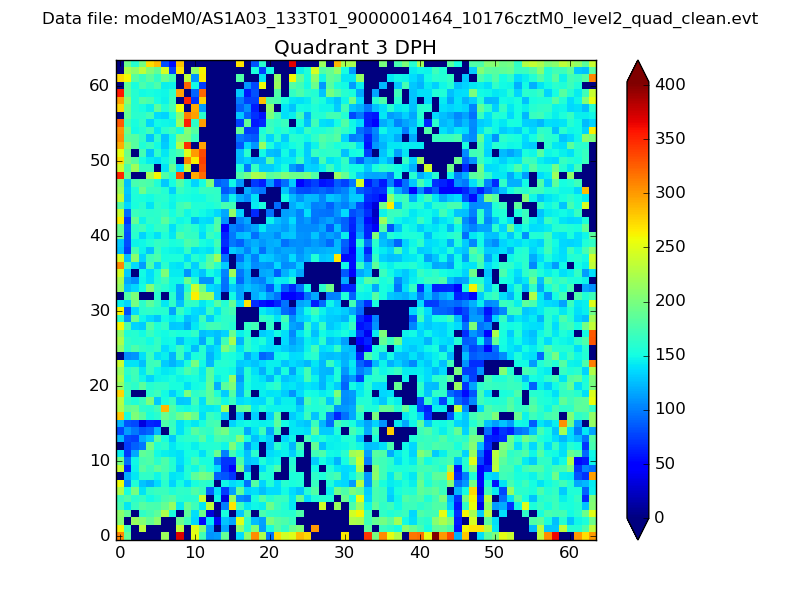 |
 |
Quadrant C |
| Plot type | Count rate plots | Images |
|---|---|---|
| Comparison with Poisson distribution Blue bars denote a histogram of data divided into 1 sec bins. Red curve is a Poisson curve with rate = median count rate of data. |
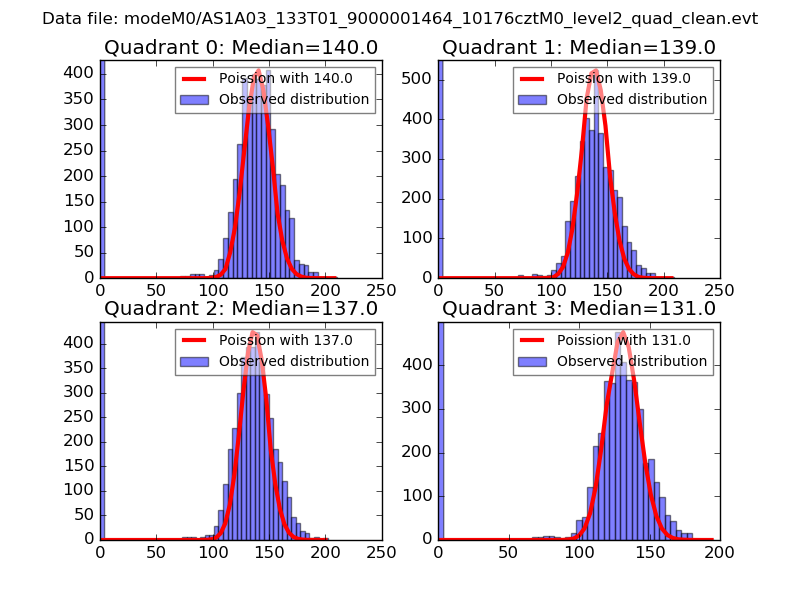 |
 |
| Quadrant-wise count rates Data is divided into 100 sec bins |
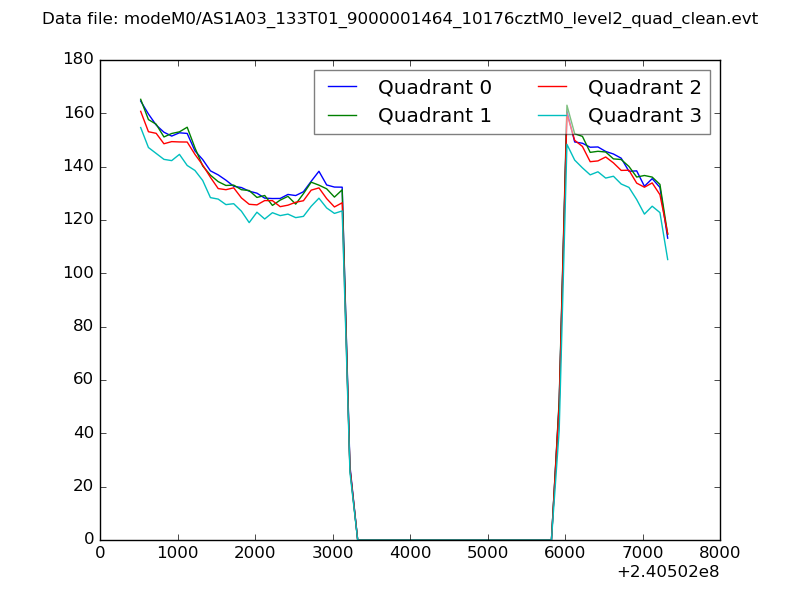 |
|
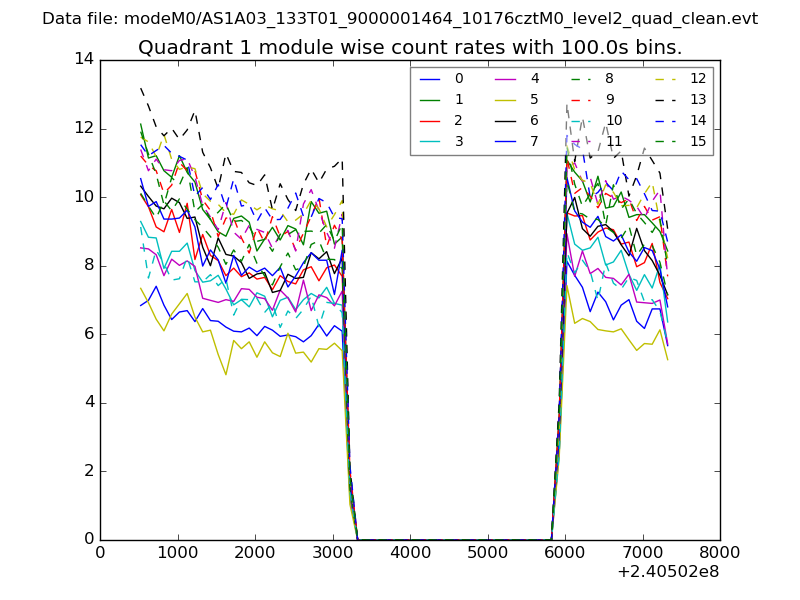
| Module-wise count rates for Quadrant A Data is divided into 100 sec bins |
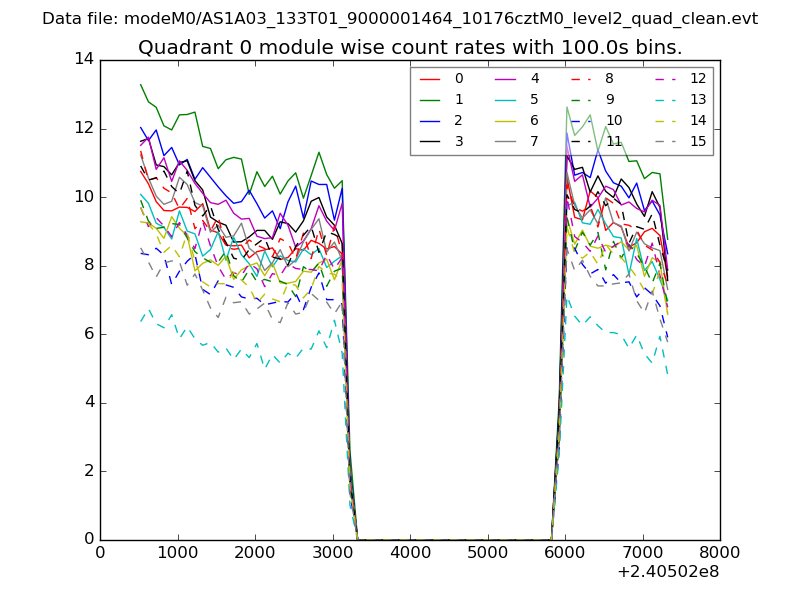 |
 |
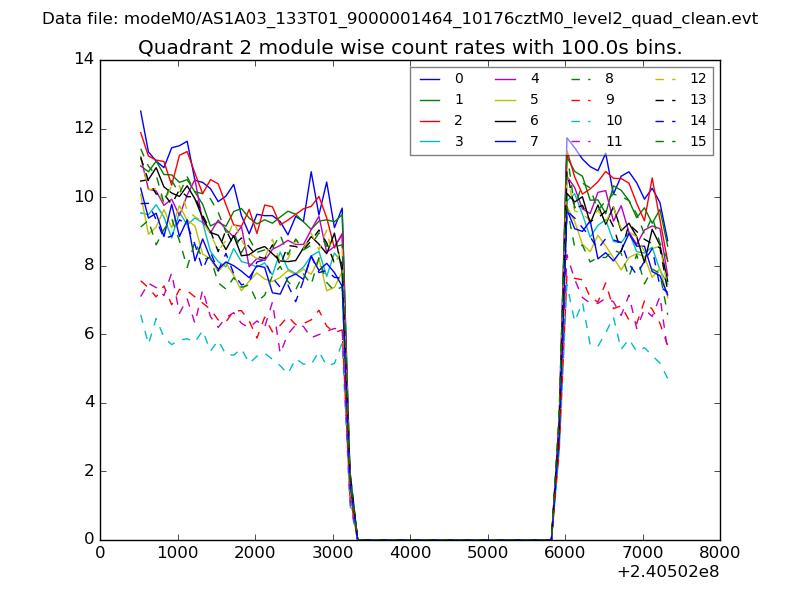
| Module-wise count rates for Quadrant B Data is divided into 100 sec bins |
 |
 |
| Module-wise count rates for Quadrant C Data is divided into 100 sec bins |
 |
 |
| Module-wise count rates for Quadrant D Data is divided into 100 sec bins |
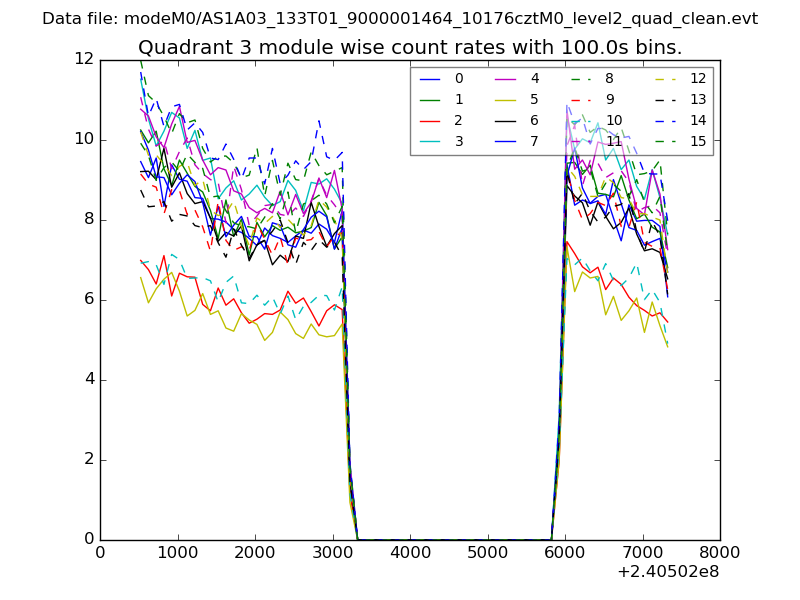 |
 |
| Parameter | Plot |
|---|---|
| CZT HV Monitor | 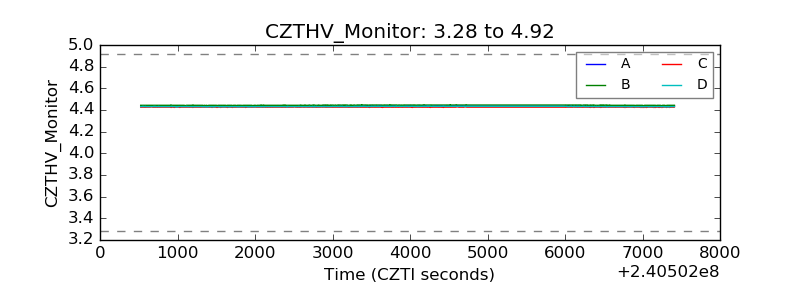 |
| D_VDD | 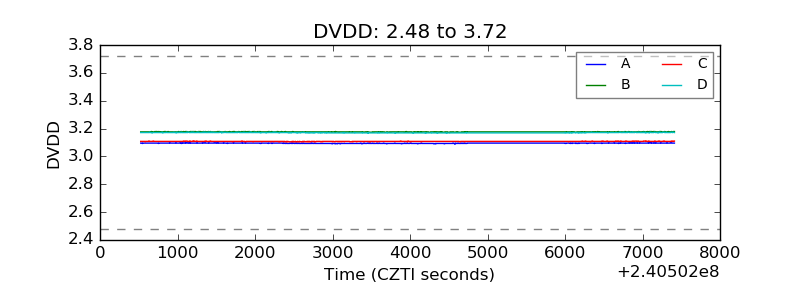 |
| Temperature 1 | 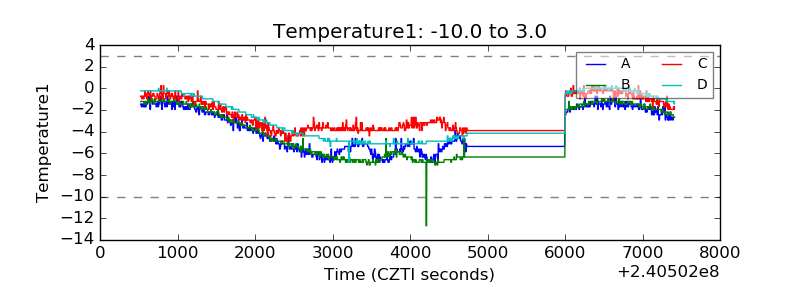 |
| Veto HV Monitor | 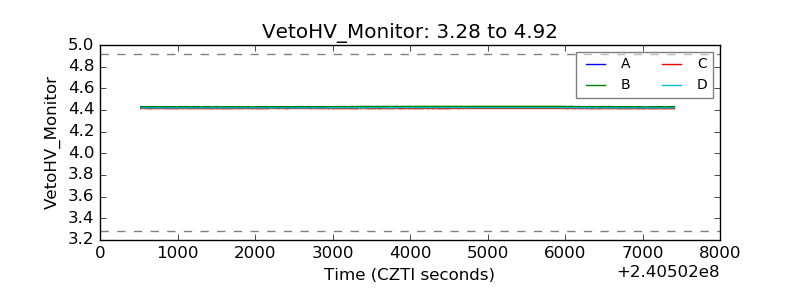 |
| Veto LLD | 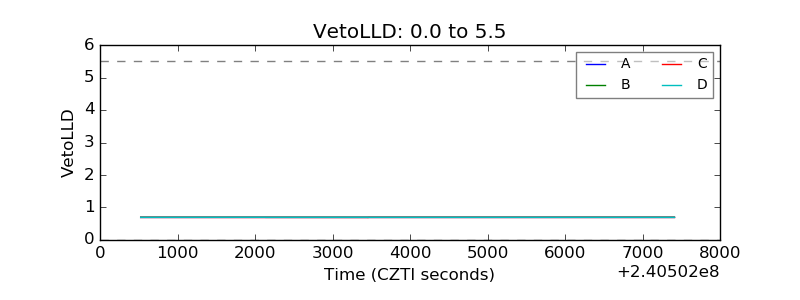 |
| Alpha Counter | 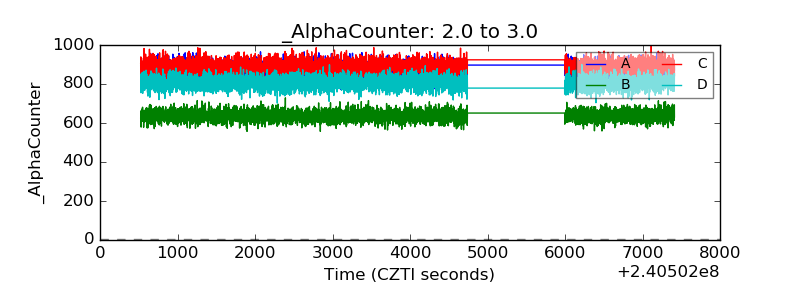 |
| _CPM_Rate | 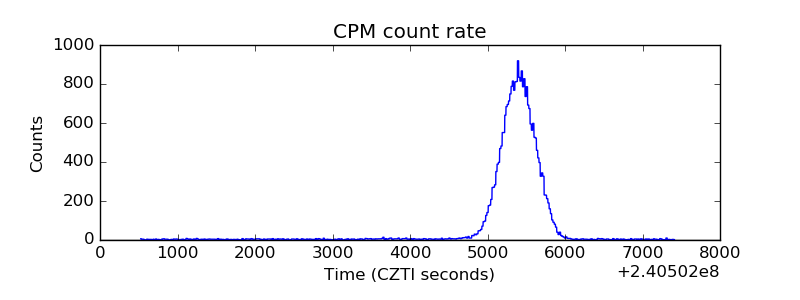 |
| CZT Counter |  |
| +2.5 Volts monitor |  |
| +5 Volts monitor |  |
| _ROLL_ROT | 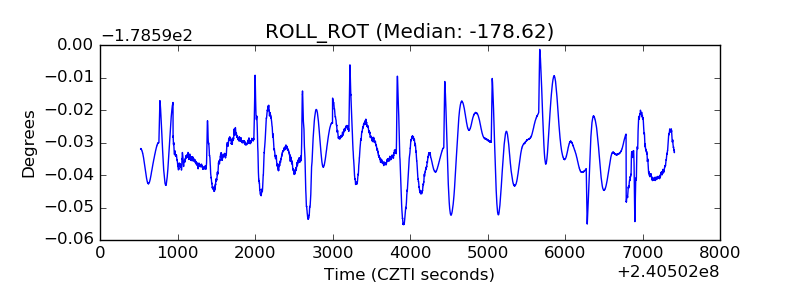 |
| _Roll_DEC | 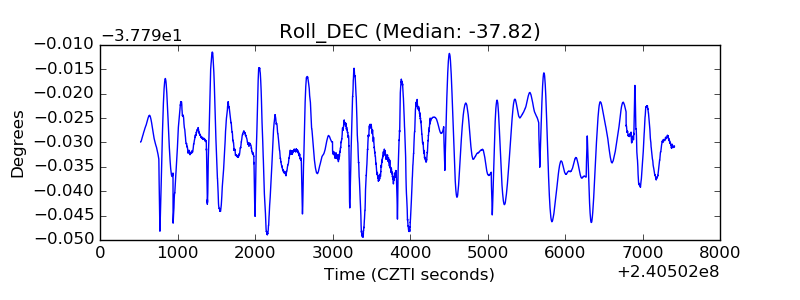 |
| _Roll_RA | 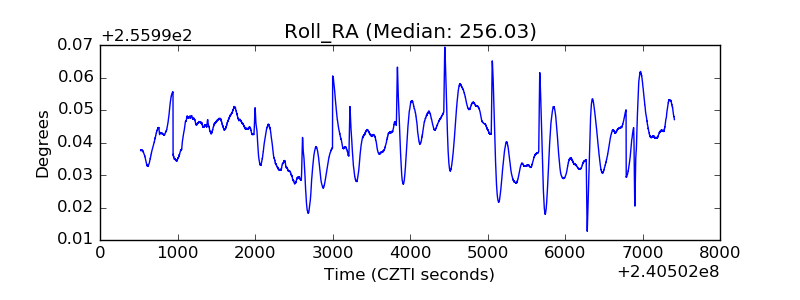 |
| Veto Counter | 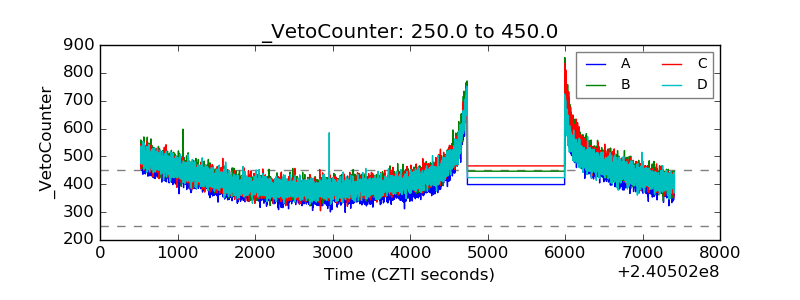 |