| Param | Original file | Final file |
|---|---|---|
| Filename | modeM0/AS1A03_133T01_9000001464_10180cztM0_level2.evt | modeM0/AS1A03_133T01_9000001464_10180cztM0_level2_quad_clean.evt |
| Size (bytes) | 560,854,080 | 113,872,320 |
| Size | 534.9 MB | 108.6 MB |
| Events in quadrant A | 3,770,822 | 733,392 |
| Events in quadrant B | 4,244,384 | 737,020 |
| Events in quadrant C | 3,505,486 | 732,633 |
| Events in quadrant D | 4,926,815 | 694,347 |
| Mode SS | |||
|---|---|---|---|
| Quadrant | BADHDUFLAG | Total packets | Discarded packets |
| A | 0 | 160 | 0 |
| B | 0 | 160 | 0 |
| C | 0 | 160 | 0 |
| D | 0 | 160 | 0 |
| Mode M0 | |||
|---|---|---|---|
| Quadrant | BADHDUFLAG | Total packets | Discarded packets |
| A | 0 | 16775 | 3 |
| B | 0 | 17930 | 2 |
| C | 0 | 16246 | 2 |
| D | 0 | 19774 | 2 |
| Mode M9 | |||
|---|---|---|---|
| Quadrant | BADHDUFLAG | Total packets | Discarded packets |
| A | 0 | 7 | 0 |
| B | 0 | 7 | 0 |
| C | 0 | 7 | 0 |
| D | 0 | 7 | 0 |
| Quadrant | Total seconds | Saturated seconds | Saturation percentage |
|---|---|---|---|
| A | 7939 | 63 | 0.793551% |
| B | 7939 | 135 | 1.700466% |
| C | 7939 | 24 | 0.302305% |
| D | 7939 | 102 | 1.284797% |
Noise dominated data is calculated using 1-second bins in cleaned event files. If a bin has >2000 counts, and if more than 50% of those come from <1% of pixels, then it is considered to be noise-dominated and hence unusable.
| Quadrant | # 1 sec bins | Bins with >0 counts | Bins with >2000 counts | High rate bins dominated by noise | Noise dominated (total time) | Noise dominated (detector-on time) | Marked lightcurve |
|---|---|---|---|---|---|---|---|
| A | 8524 | 7941 | 10 | 10 | 0.12% | 0.13% | 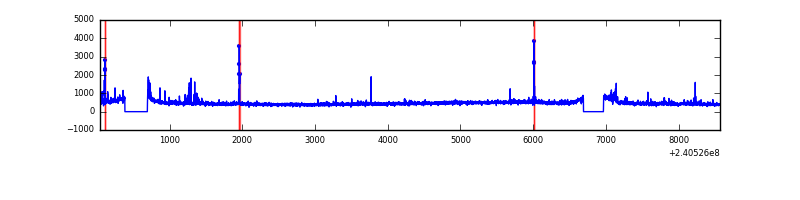 |
| B | 8524 | 7941 | 22 | 22 | 0.26% | 0.28% | 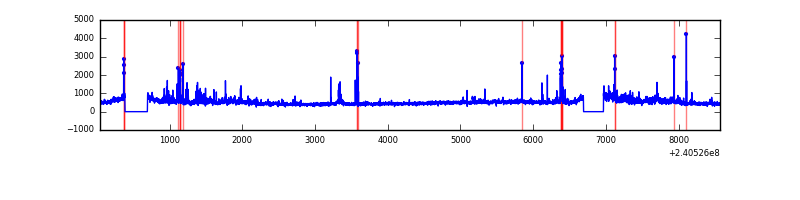 |
| C | 8524 | 7941 | 0 | 0 | 0.00% | 0.00% | 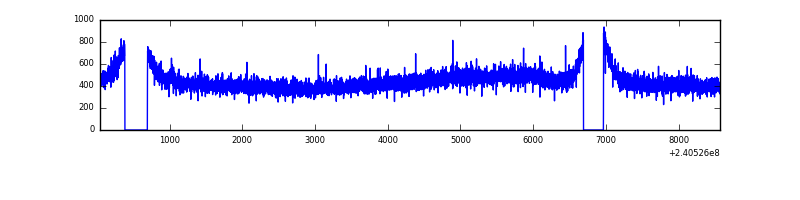 |
| D | 8524 | 7941 | 64 | 64 | 0.75% | 0.81% | 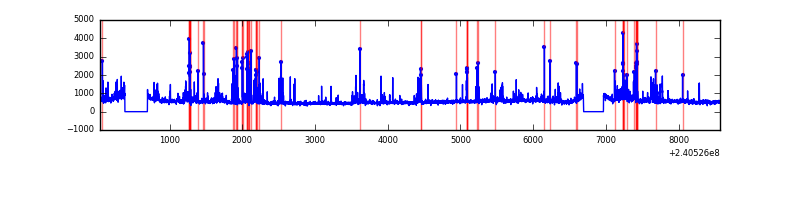 |
Top three noisy pixels from each quadrant. If the there are fewer than three noisy pixels in the level2.evt file, extra rows are filled as -1
| Pixel properties | Quadrant properties | ||||||
|---|---|---|---|---|---|---|---|
| Quadrant | DetID | PixID | Counts | Sigma | Mean | Median | Sigma |
| A | 15 | 174 | 74027 | 386.51 | 928 | 909 | 189.2 |
| A | 13 | 251 | 42991 | 222.45 | 928 | 909 | 189.2 |
| A | 3 | 1 | 33393 | 171.71 | 928 | 909 | 189.2 |
| B | 11 | 51 | 216923 | 1210.65 | 931 | 908 | 178.4 |
| B | 4 | 239 | 110596 | 614.74 | 931 | 908 | 178.4 |
| B | 5 | 255 | 78991 | 437.61 | 931 | 908 | 178.4 |
| C | 14 | 67 | 12312 | 54.86 | 895 | 899 | 208.0 |
| C | 13 | 61 | 6726 | 28.01 | 895 | 899 | 208.0 |
| C | 15 | 127 | 2568 | 8.02 | 895 | 899 | 208.0 |
| D | 8 | 195 | 671510 | 3135.06 | 887 | 862 | 213.9 |
| D | 1 | 52 | 222636 | 1036.72 | 887 | 862 | 213.9 |
| D | 7 | 71 | 175771 | 817.64 | 887 | 862 | 213.9 |
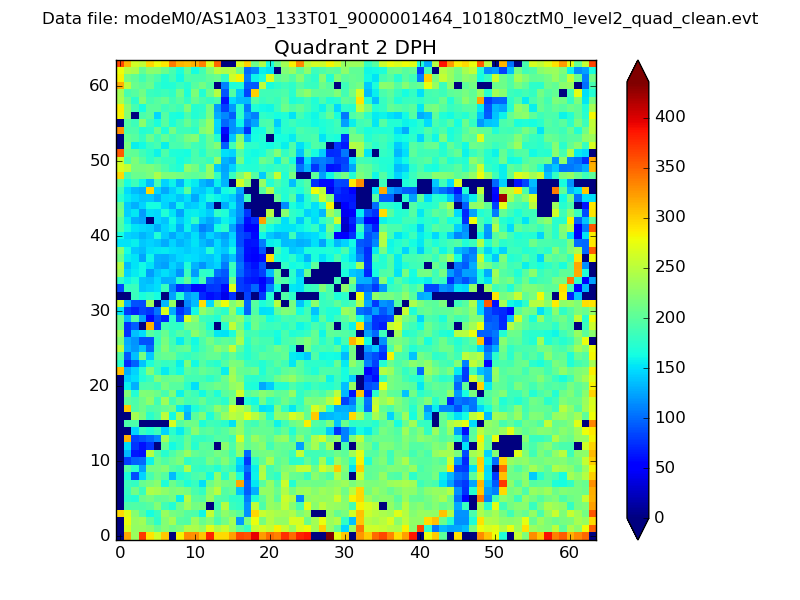
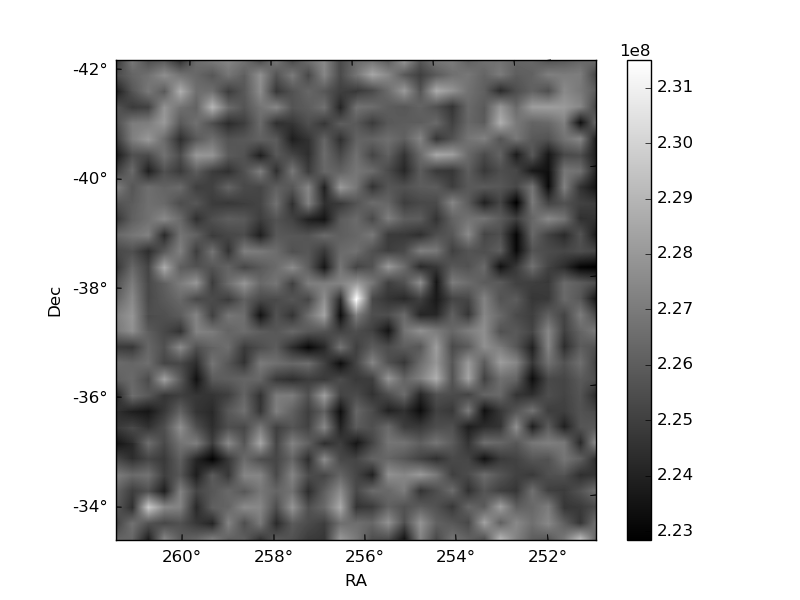
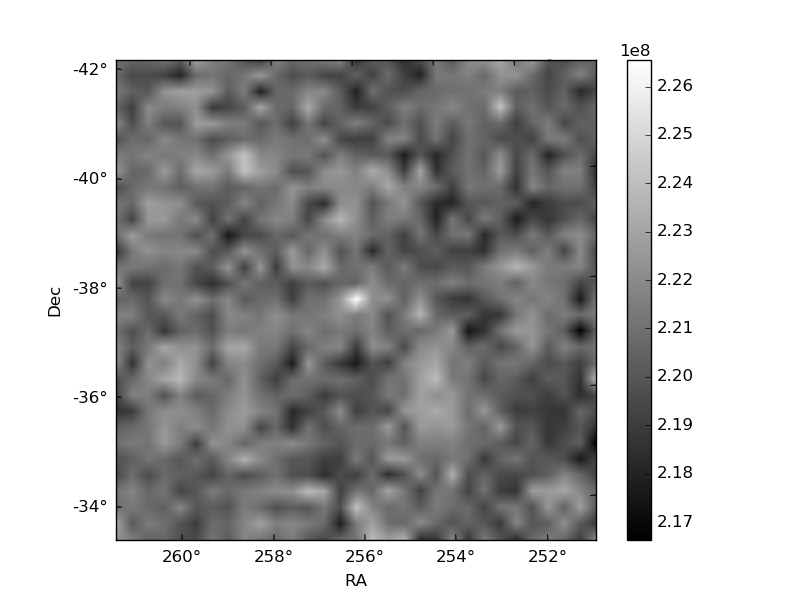
Histogram calculated using DETX and DETY for each event in the final _common_clean file
| Quadrant A | 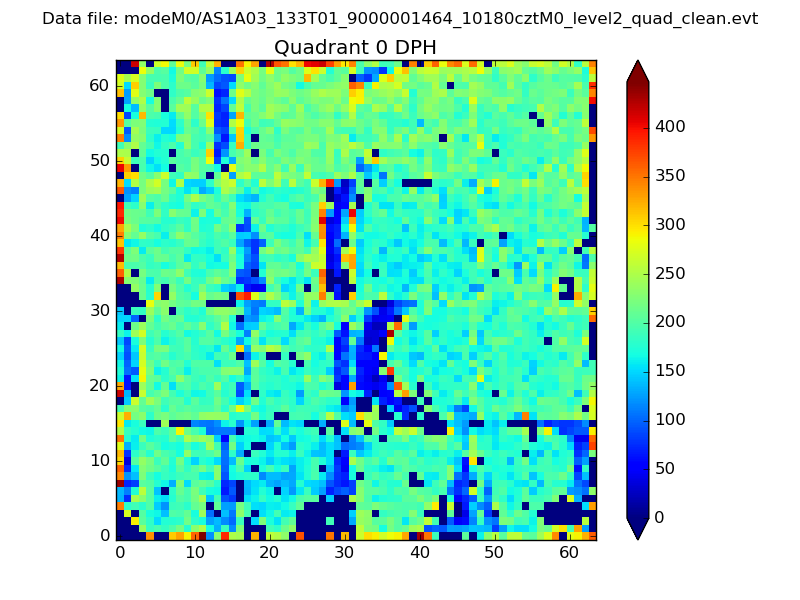 |
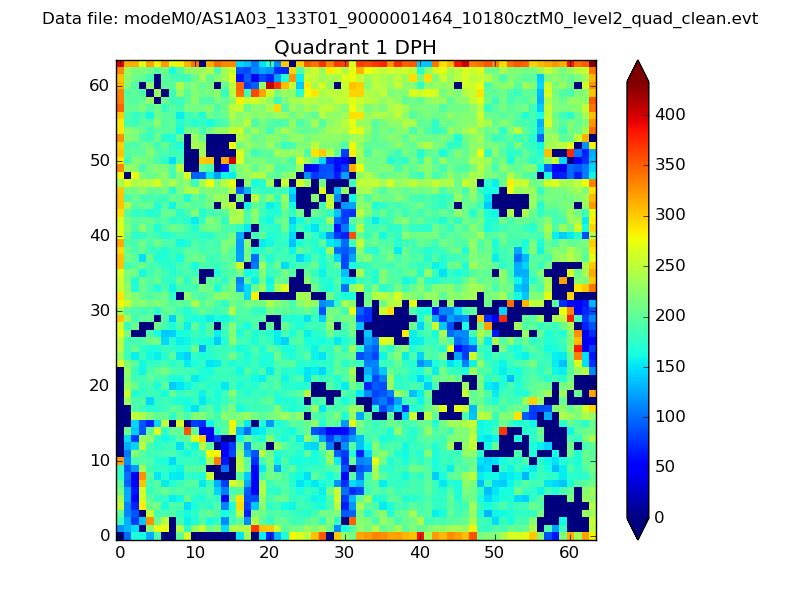 |
Quadrant B |
|---|---|---|---|
| Quadrant D | 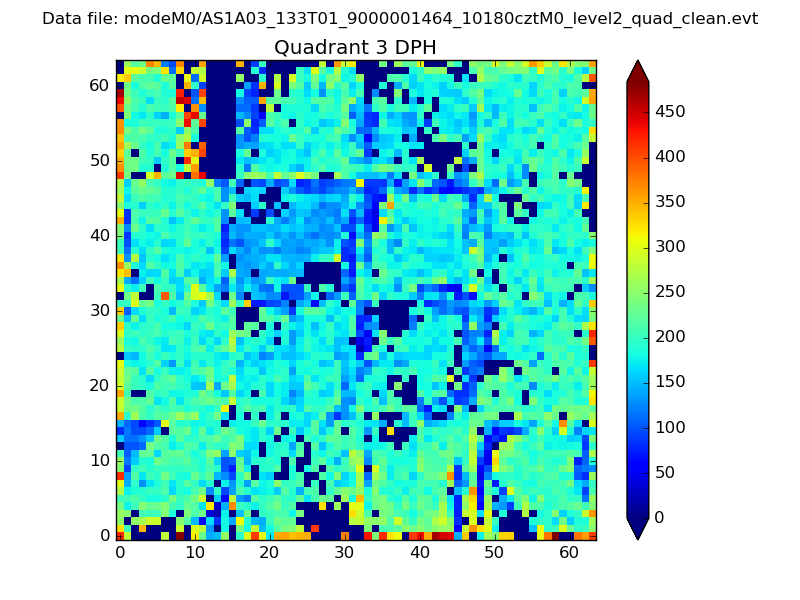 |
 |
Quadrant C |
| Plot type | Count rate plots | Images |
|---|---|---|
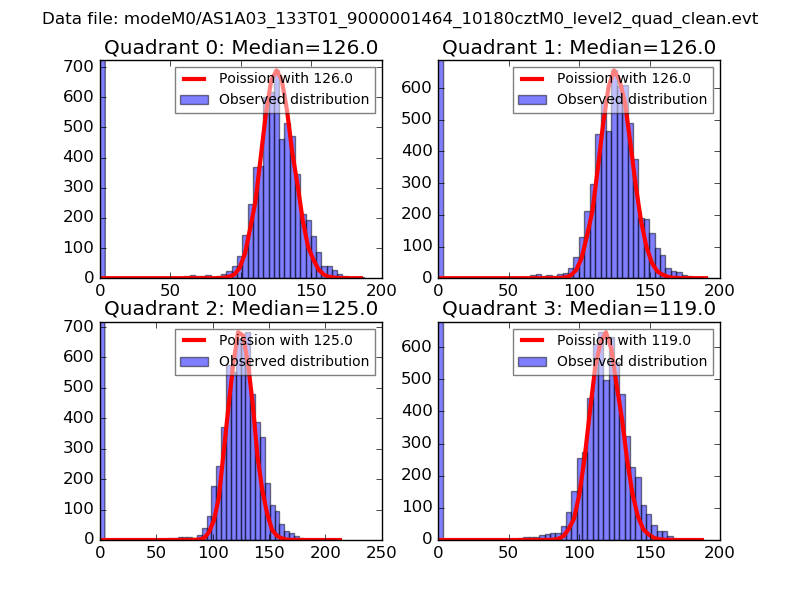
| Comparison with Poisson distribution Blue bars denote a histogram of data divided into 1 sec bins. Red curve is a Poisson curve with rate = median count rate of data. |
 |
 |
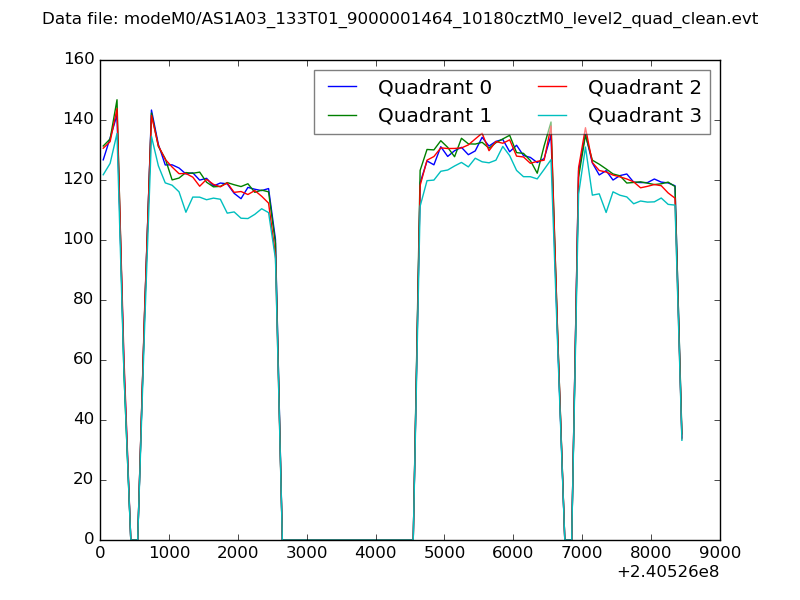
| Quadrant-wise count rates Data is divided into 100 sec bins |
 |
|
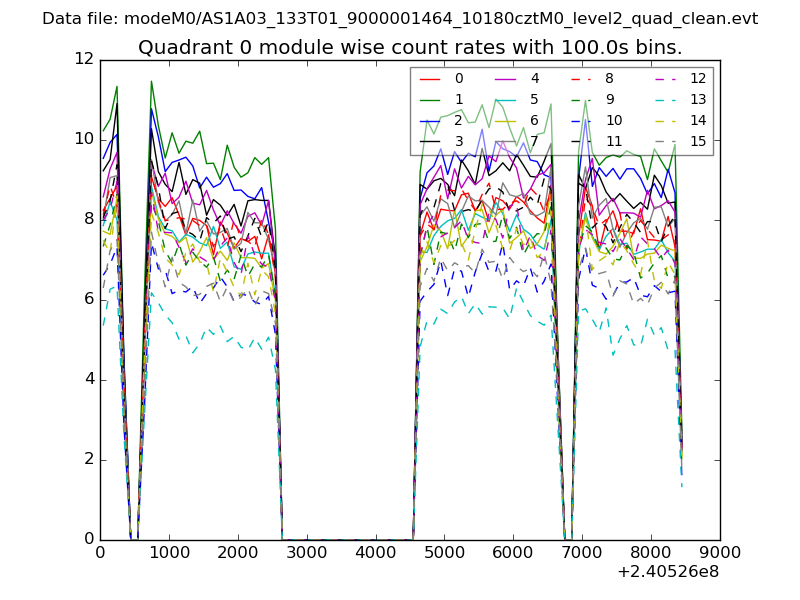
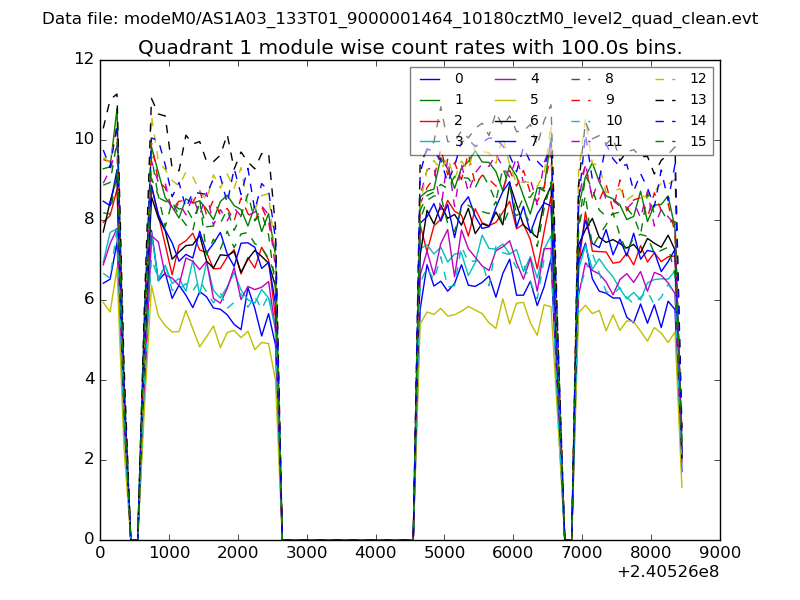
| Module-wise count rates for Quadrant A Data is divided into 100 sec bins |
 |
 |
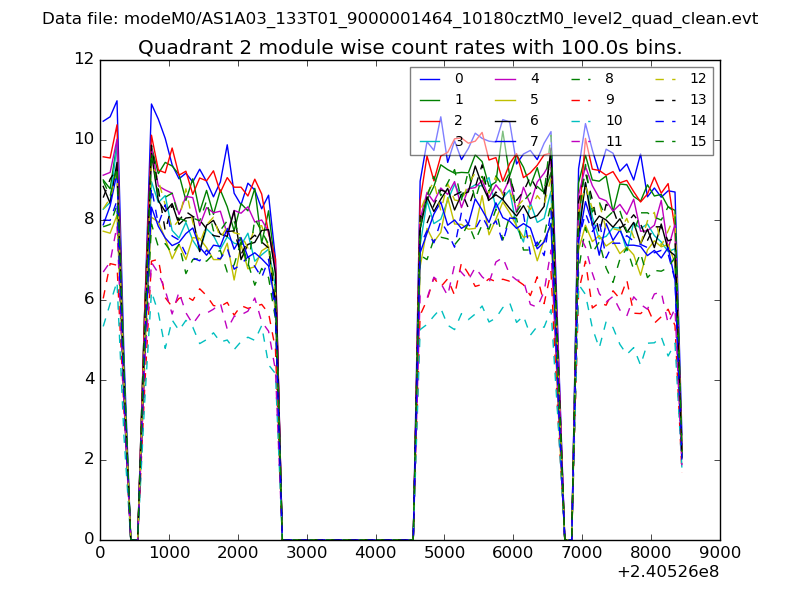
| Module-wise count rates for Quadrant B Data is divided into 100 sec bins |
 |
 |
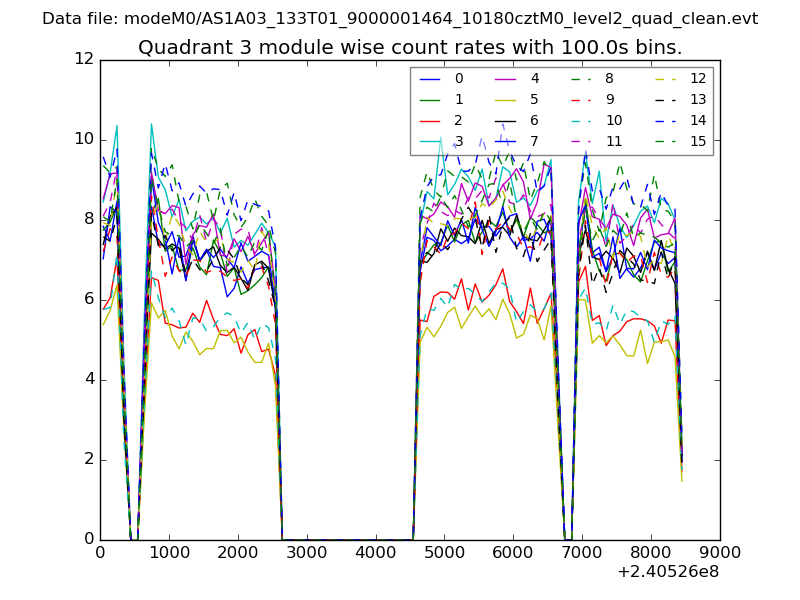
| Module-wise count rates for Quadrant C Data is divided into 100 sec bins |
 |
 |
| Module-wise count rates for Quadrant D Data is divided into 100 sec bins |
 |
 |
| Parameter | Plot |
|---|---|
| CZT HV Monitor | 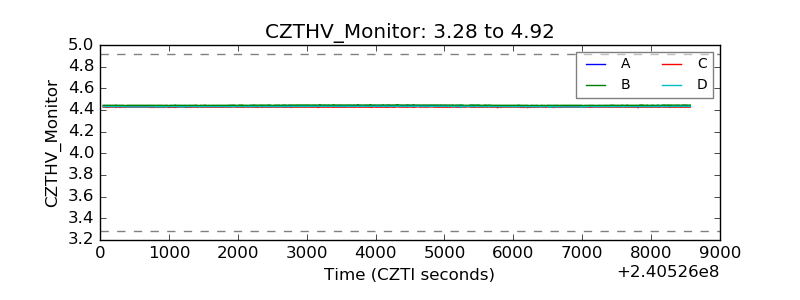 |
| D_VDD | 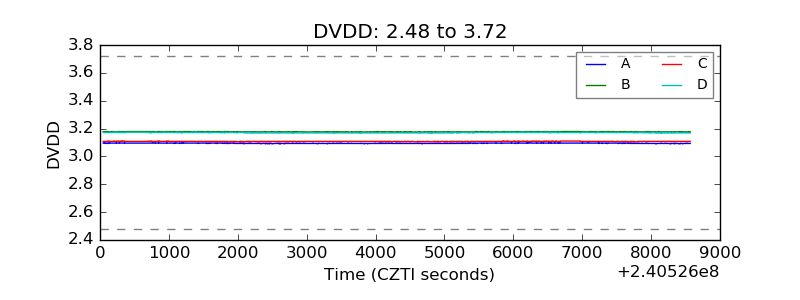 |
| Temperature 1 | 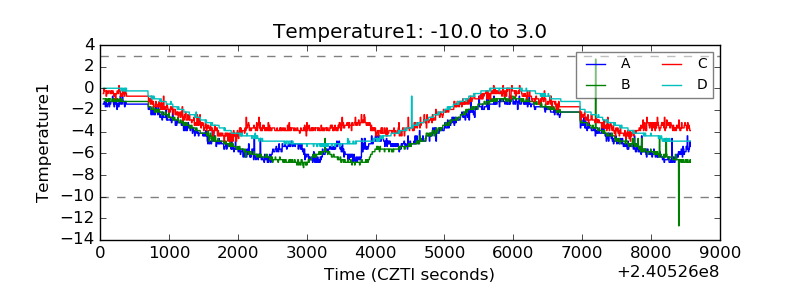 |
| Veto HV Monitor | 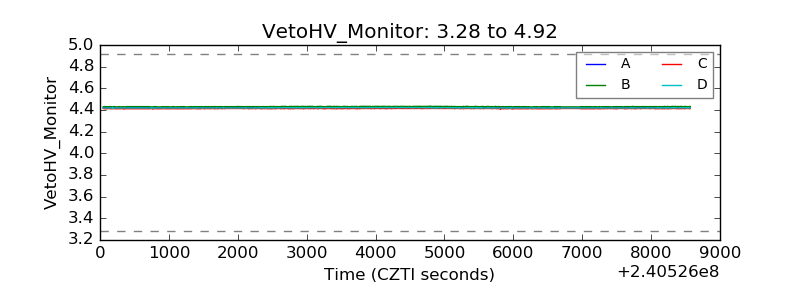 |
| Veto LLD | 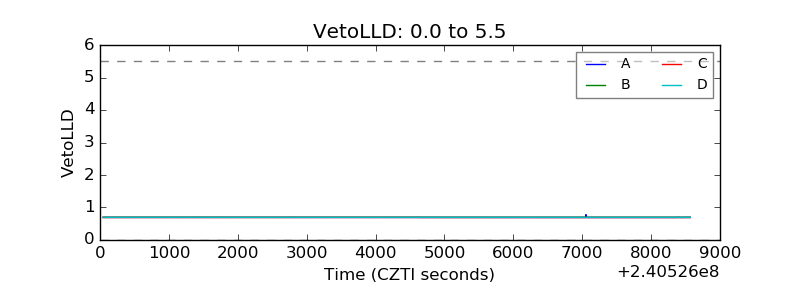 |
| Alpha Counter | 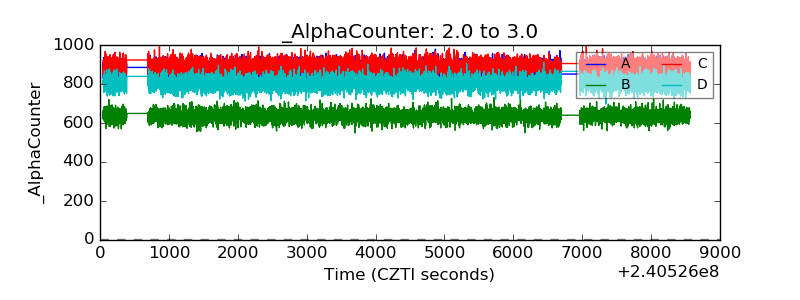 |
| _CPM_Rate | 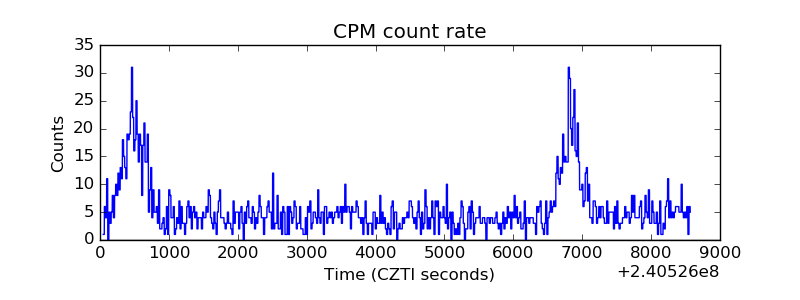 |
| CZT Counter | 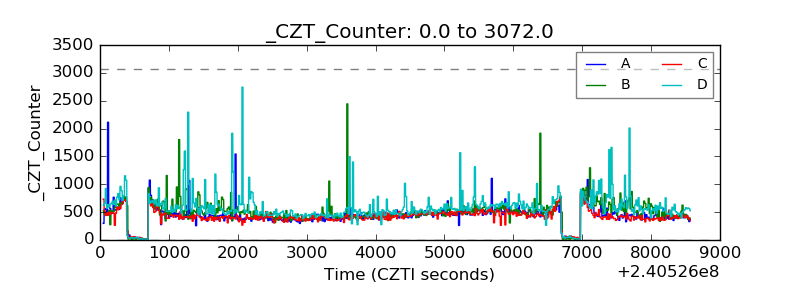 |
| +2.5 Volts monitor |  |
| +5 Volts monitor |  |
| _ROLL_ROT | 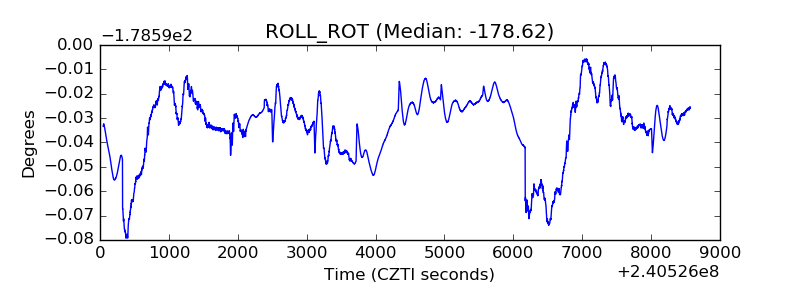 |
| _Roll_DEC | 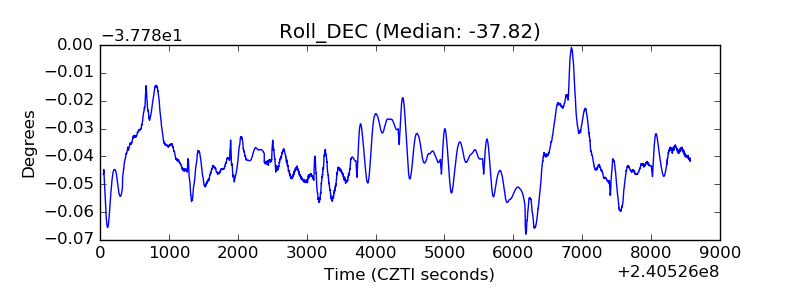 |
| _Roll_RA | 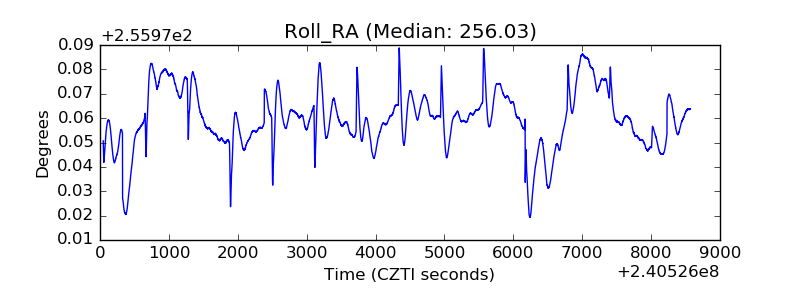 |
| Veto Counter | 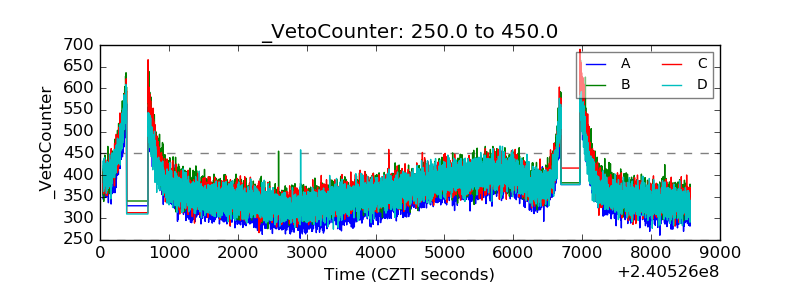 |