| Param | Original file | Final file |
|---|---|---|
| Filename | modeM0/AS1A03_133T01_9000001464_10181cztM0_level2.evt | modeM0/AS1A03_133T01_9000001464_10181cztM0_level2_quad_clean.evt |
| Size (bytes) | 568,704,960 | 111,211,200 |
| Size | 542.4 MB | 106.1 MB |
| Events in quadrant A | 3,810,844 | 704,918 |
| Events in quadrant B | 4,181,158 | 711,362 |
| Events in quadrant C | 3,624,013 | 705,838 |
| Events in quadrant D | 5,046,843 | 672,062 |
| Mode SS | |||
|---|---|---|---|
| Quadrant | BADHDUFLAG | Total packets | Discarded packets |
| A | 0 | 168 | 0 |
| B | 0 | 168 | 0 |
| C | 0 | 168 | 0 |
| D | 0 | 168 | 0 |
| Mode M0 | |||
|---|---|---|---|
| Quadrant | BADHDUFLAG | Total packets | Discarded packets |
| A | 0 | 17110 | 3 |
| B | 0 | 17971 | 2 |
| C | 0 | 16835 | 2 |
| D | 0 | 20268 | 2 |
| Mode M9 | |||
|---|---|---|---|
| Quadrant | BADHDUFLAG | Total packets | Discarded packets |
| A | 0 | 8 | 0 |
| B | 0 | 8 | 0 |
| C | 0 | 8 | 0 |
| D | 0 | 8 | 0 |
| Quadrant | Total seconds | Saturated seconds | Saturation percentage |
|---|---|---|---|
| A | 8264 | 49 | 0.592933% |
| B | 8264 | 101 | 1.222168% |
| C | 8264 | 25 | 0.302517% |
| D | 8264 | 69 | 0.834947% |
Noise dominated data is calculated using 1-second bins in cleaned event files. If a bin has >2000 counts, and if more than 50% of those come from <1% of pixels, then it is considered to be noise-dominated and hence unusable.
| Quadrant | # 1 sec bins | Bins with >0 counts | Bins with >2000 counts | High rate bins dominated by noise | Noise dominated (total time) | Noise dominated (detector-on time) | Marked lightcurve |
|---|---|---|---|---|---|---|---|
| A | 9019 | 8266 | 3 | 3 | 0.03% | 0.04% | 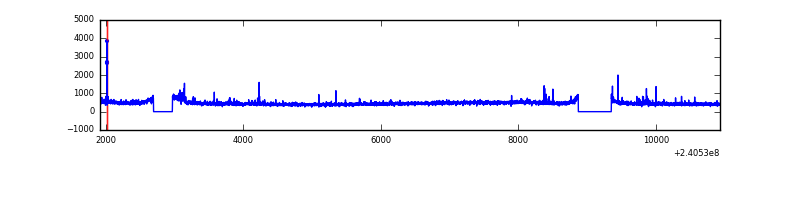 |
| B | 9019 | 8266 | 11 | 11 | 0.12% | 0.13% | 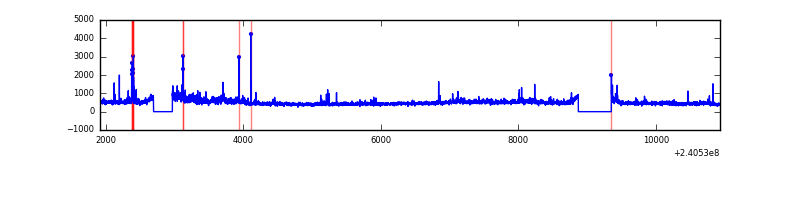 |
| C | 9019 | 8266 | 0 | 0 | 0.00% | 0.00% | 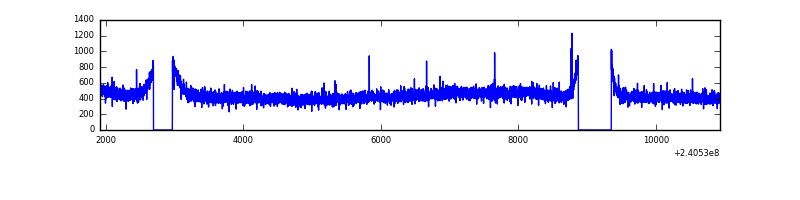 |
| D | 9019 | 8266 | 50 | 50 | 0.55% | 0.60% | 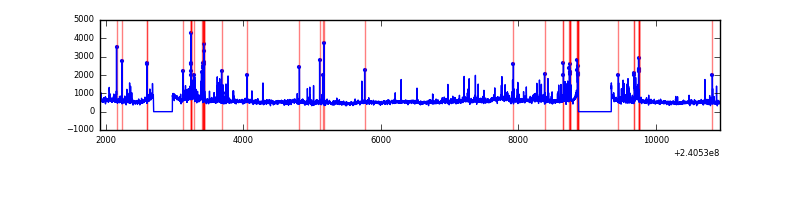 |
Top three noisy pixels from each quadrant. If the there are fewer than three noisy pixels in the level2.evt file, extra rows are filled as -1
| Pixel properties | Quadrant properties | ||||||
|---|---|---|---|---|---|---|---|
| Quadrant | DetID | PixID | Counts | Sigma | Mean | Median | Sigma |
| A | 13 | 251 | 32867 | 163.24 | 958 | 939 | 195.6 |
| A | 3 | 1 | 28621 | 141.54 | 958 | 939 | 195.6 |
| A | 8 | 15 | 19763 | 96.25 | 958 | 939 | 195.6 |
| B | 11 | 51 | 157140 | 846.05 | 963 | 941 | 184.6 |
| B | 5 | 255 | 81635 | 437.08 | 963 | 941 | 184.6 |
| B | 0 | 219 | 61714 | 329.17 | 963 | 941 | 184.6 |
| C | 14 | 67 | 7252 | 29.52 | 926 | 931 | 214.1 |
| C | 13 | 61 | 6975 | 28.23 | 926 | 931 | 214.1 |
| C | 8 | 222 | 3215 | 10.67 | 926 | 931 | 214.1 |
| D | 8 | 195 | 630535 | 2818.55 | 919 | 892 | 223.4 |
| D | 1 | 52 | 333326 | 1488.12 | 919 | 892 | 223.4 |
| D | 7 | 71 | 194628 | 867.25 | 919 | 892 | 223.4 |
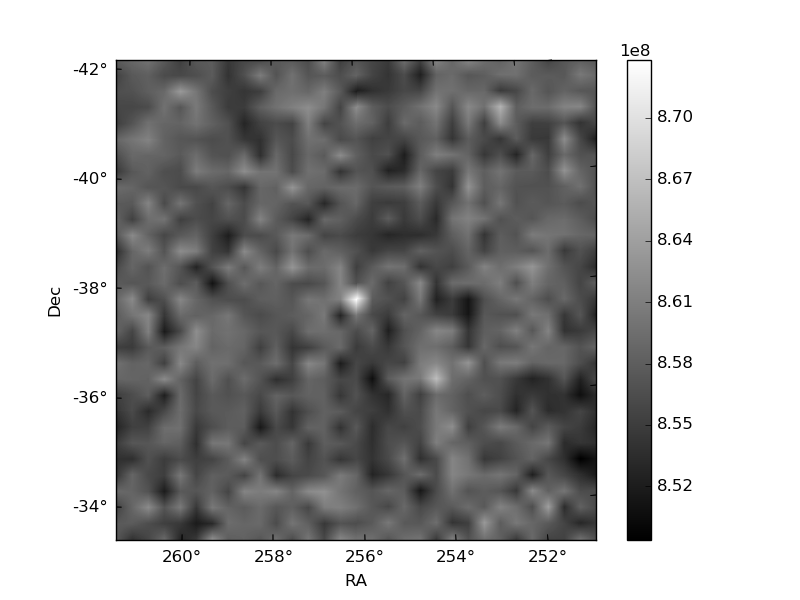
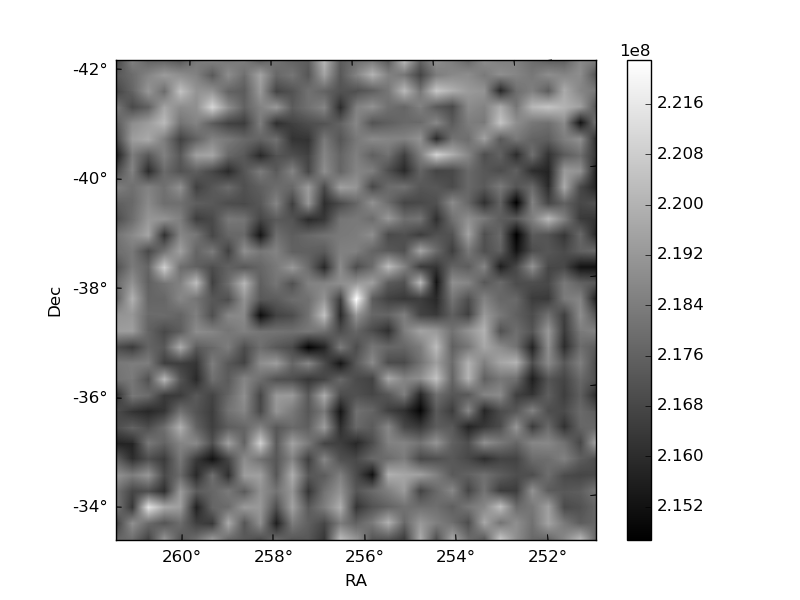
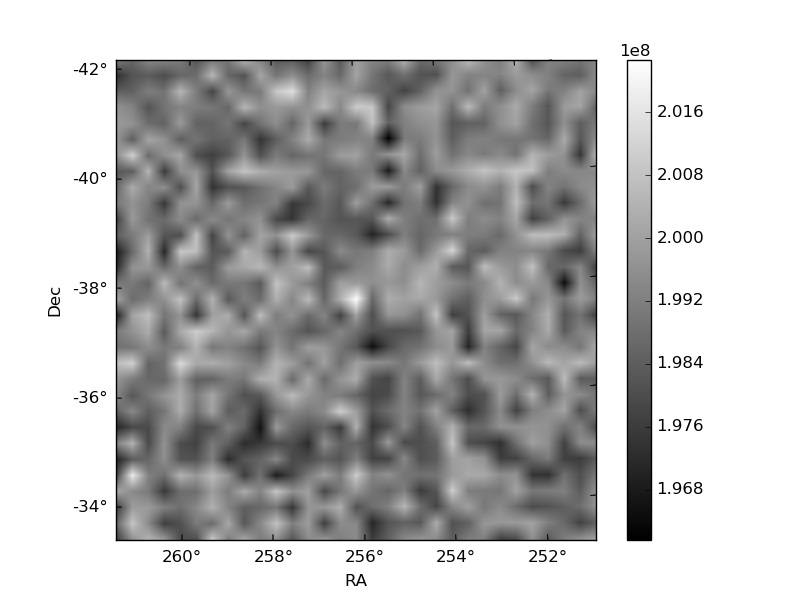
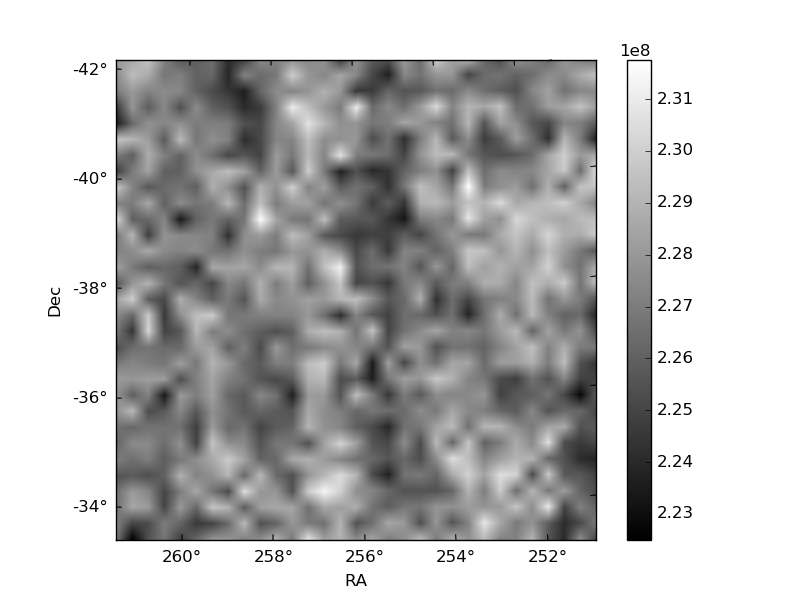
Histogram calculated using DETX and DETY for each event in the final _common_clean file
| Quadrant A | 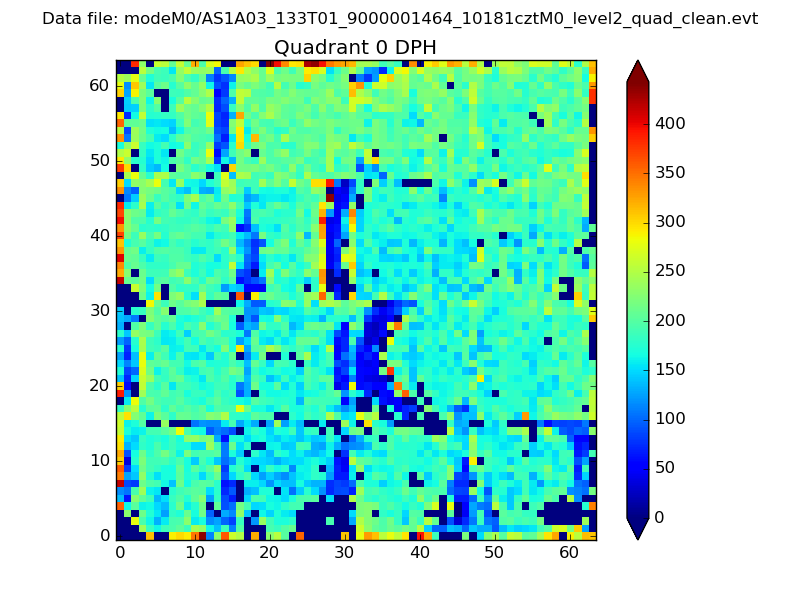 |
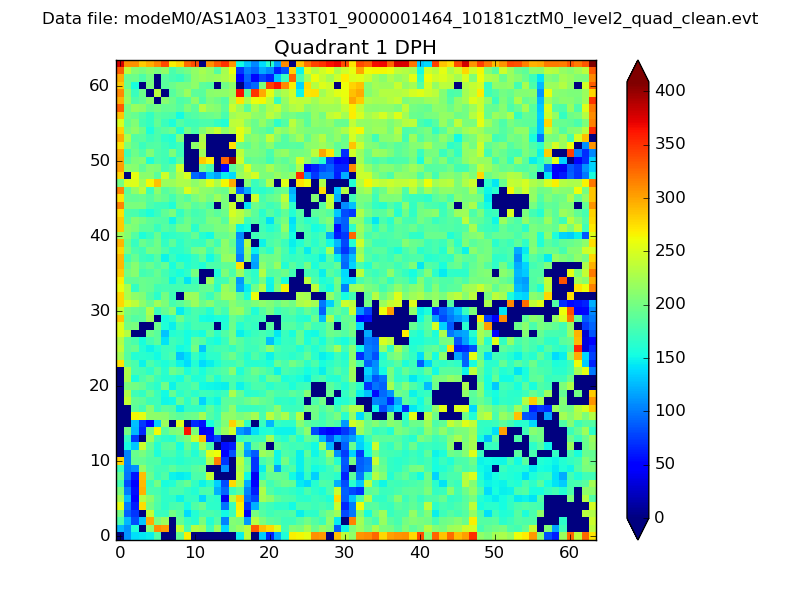 |
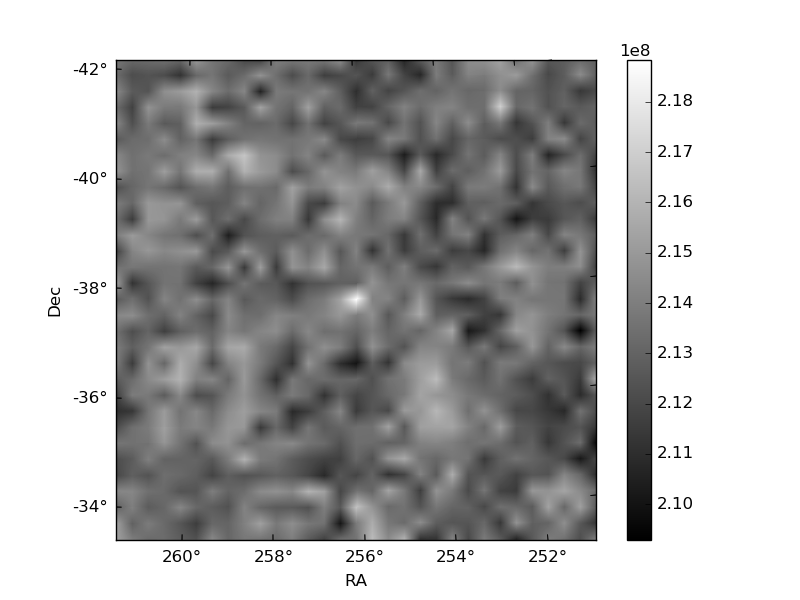
Quadrant B |
|---|---|---|---|
| Quadrant D | 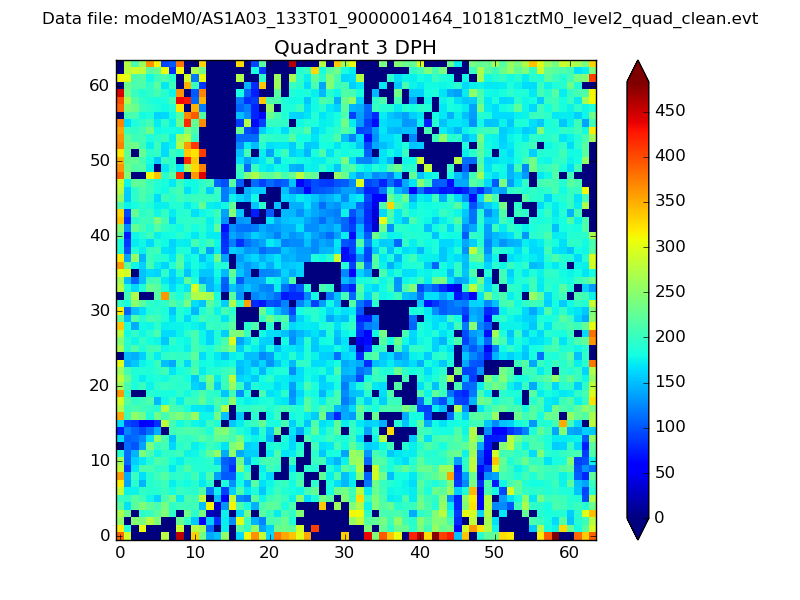 |
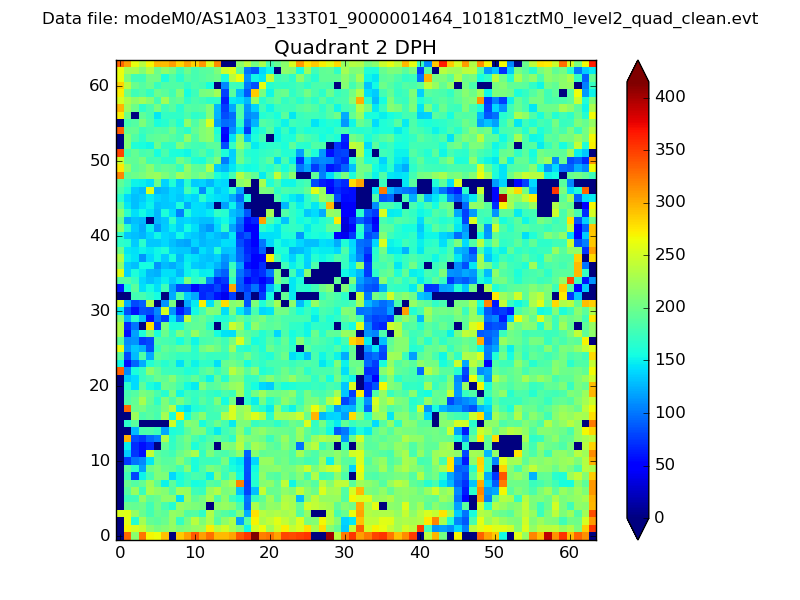 |
Quadrant C |
| Plot type | Count rate plots | Images |
|---|---|---|
| Comparison with Poisson distribution Blue bars denote a histogram of data divided into 1 sec bins. Red curve is a Poisson curve with rate = median count rate of data. |
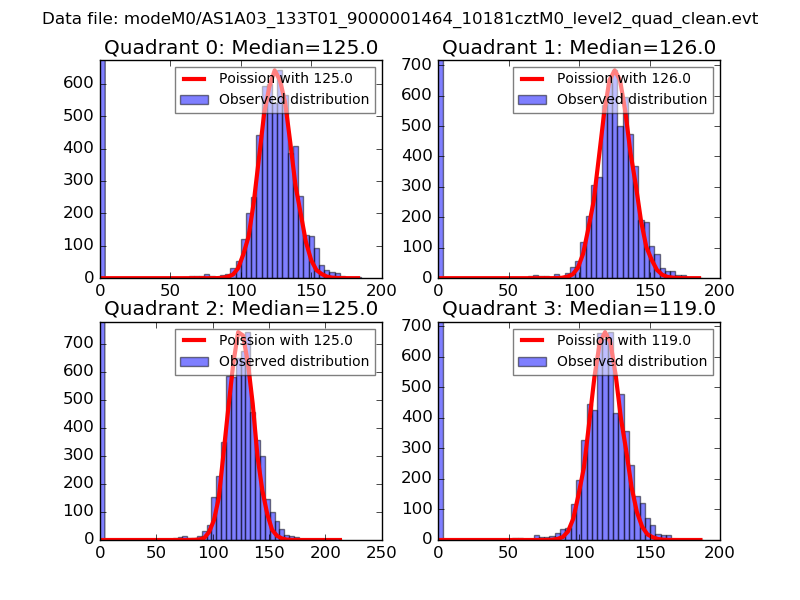 |
 |
| Quadrant-wise count rates Data is divided into 100 sec bins |
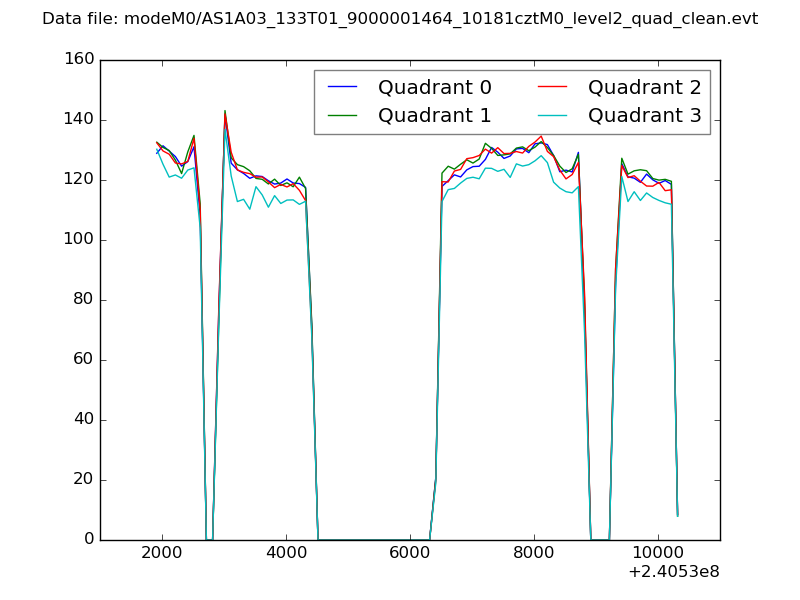 |
|
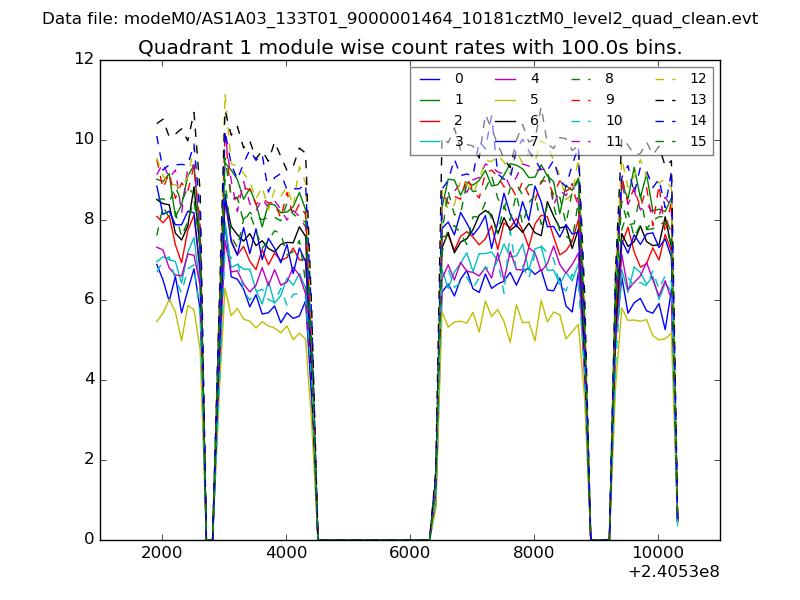
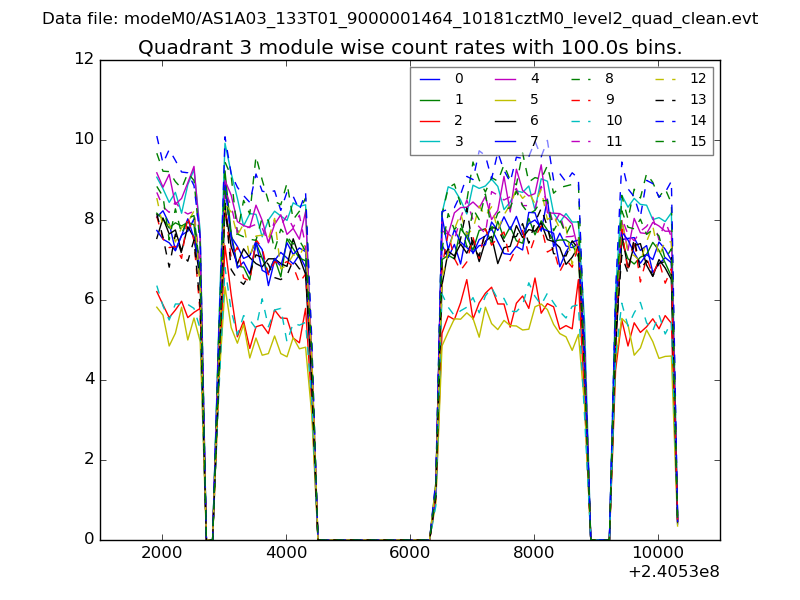
| Module-wise count rates for Quadrant A Data is divided into 100 sec bins |
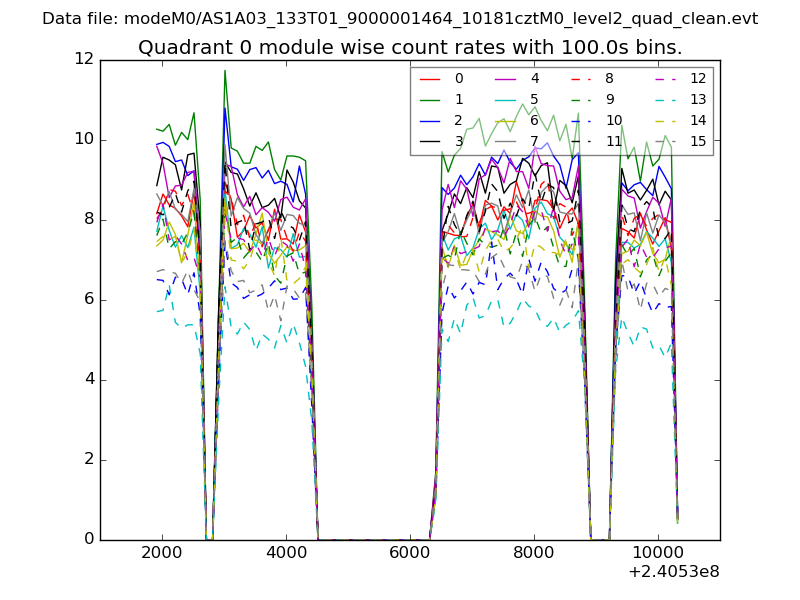 |
 |
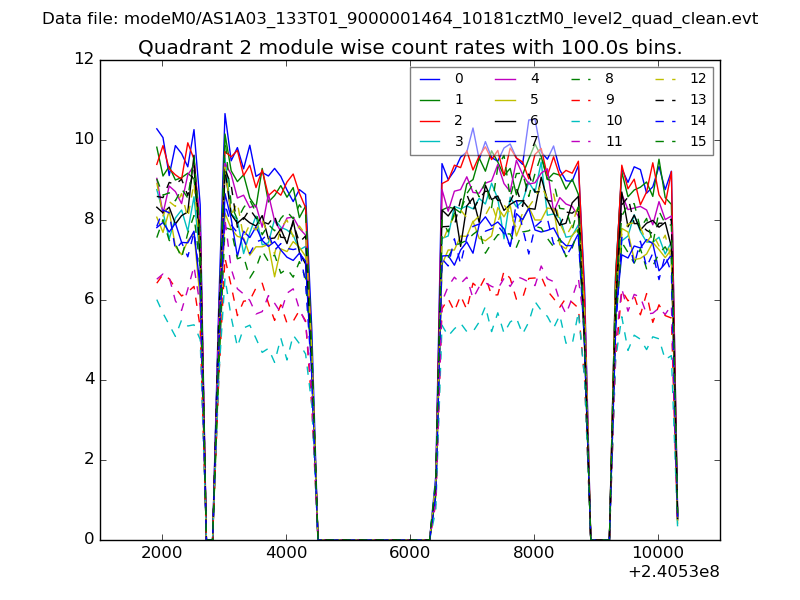
| Module-wise count rates for Quadrant B Data is divided into 100 sec bins |
 |
 |
| Module-wise count rates for Quadrant C Data is divided into 100 sec bins |
 |
 |
| Module-wise count rates for Quadrant D Data is divided into 100 sec bins |
 |
 |
| Parameter | Plot |
|---|---|
| CZT HV Monitor | 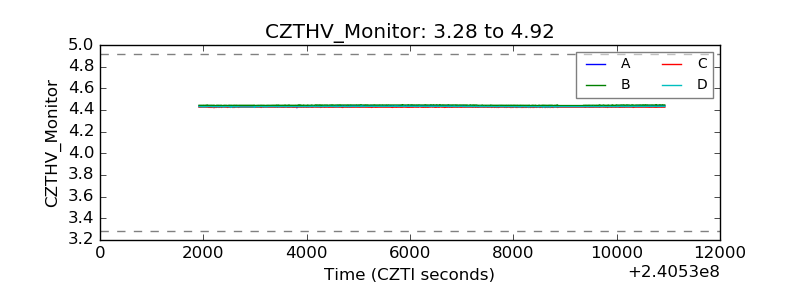 |
| D_VDD | 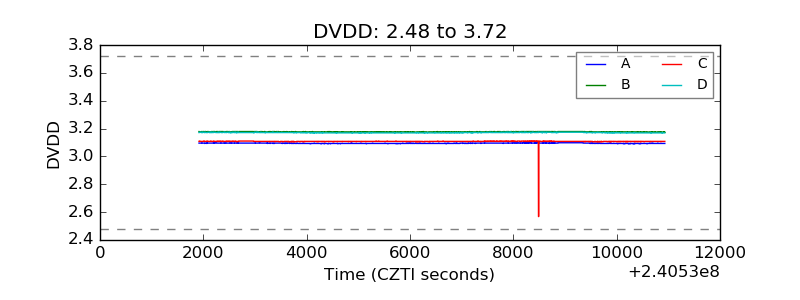 |
| Temperature 1 | 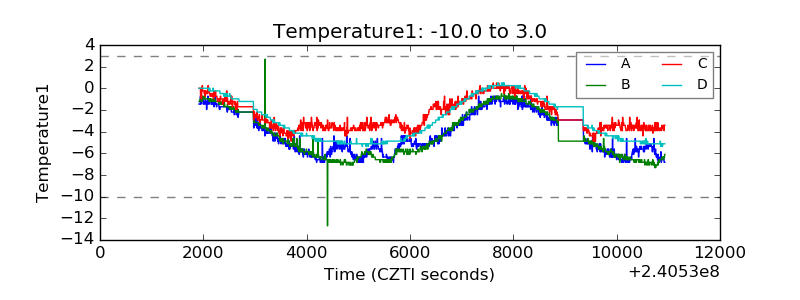 |
| Veto HV Monitor | 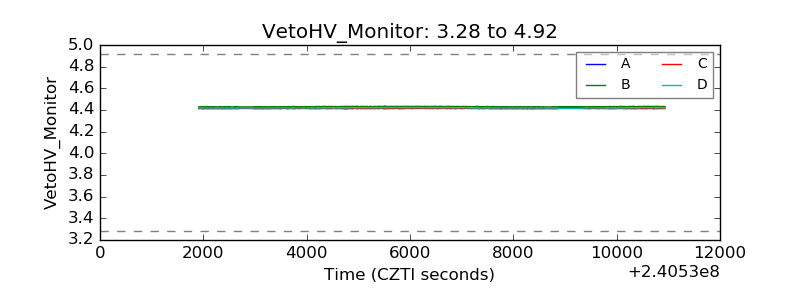 |
| Veto LLD | 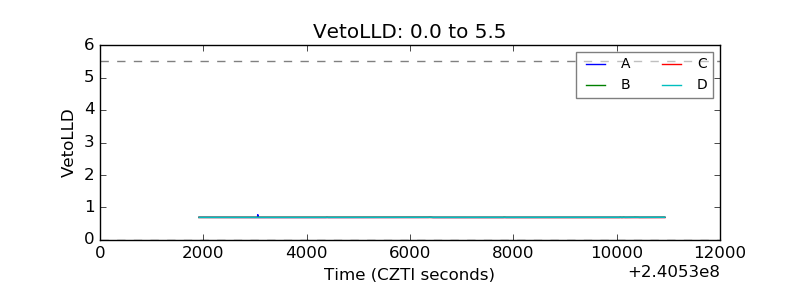 |
| Alpha Counter | 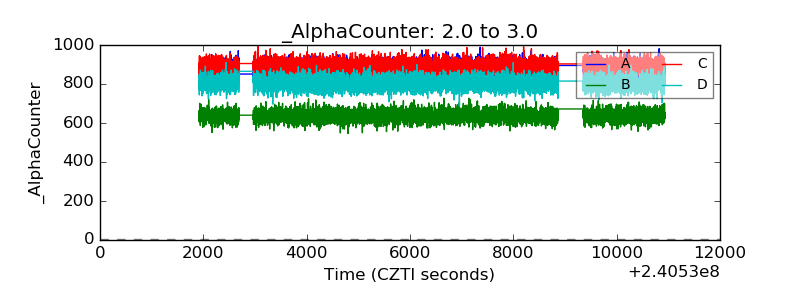 |
| _CPM_Rate | 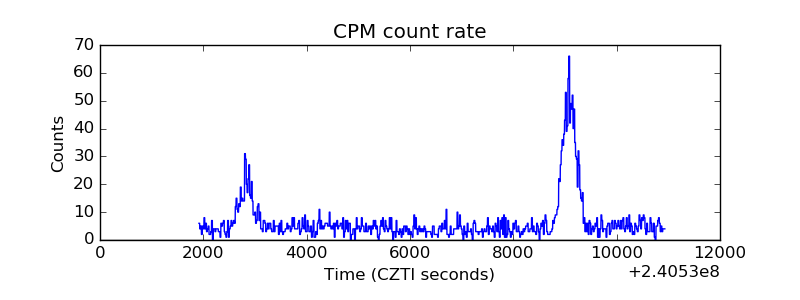 |
| CZT Counter | 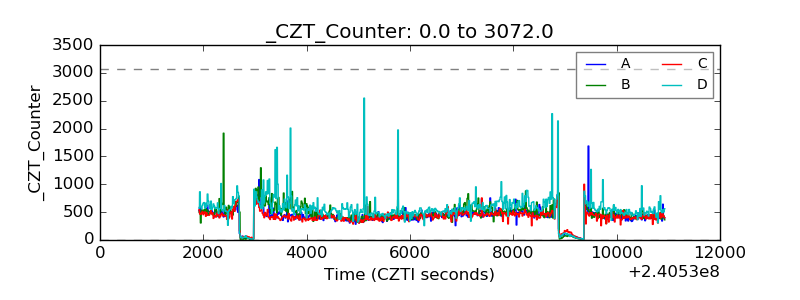 |
| +2.5 Volts monitor |  |
| +5 Volts monitor |  |
| _ROLL_ROT | 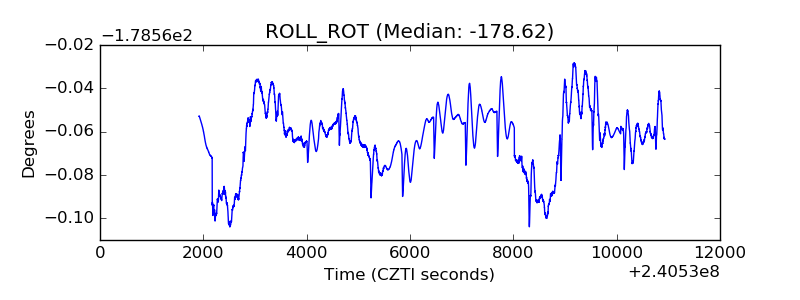 |
| _Roll_DEC | 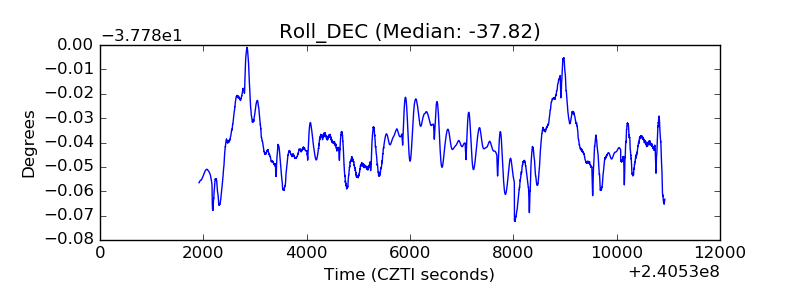 |
| _Roll_RA | 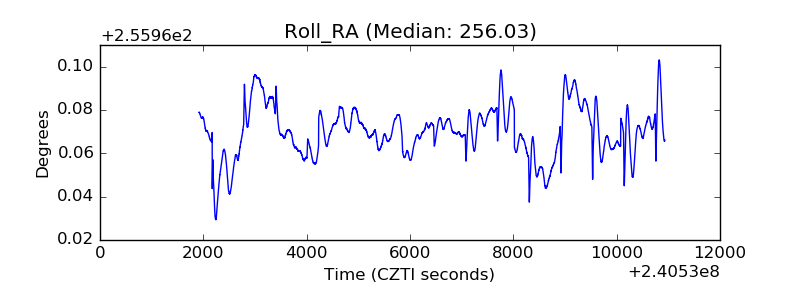 |
| Veto Counter | 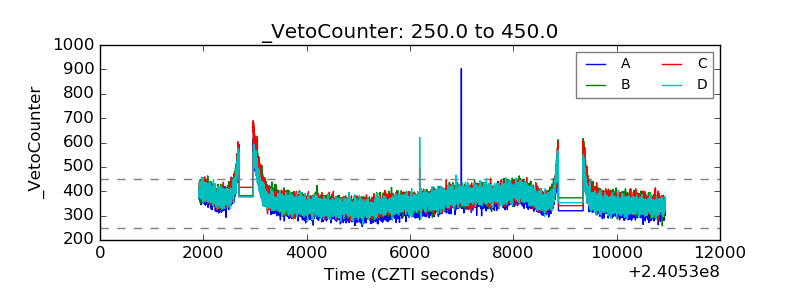 |