| Param | Original file | Final file |
|---|---|---|
| Filename | modeM0/AS1A03_133T01_9000001464_10183cztM0_level2.evt | modeM0/AS1A03_133T01_9000001464_10183cztM0_level2_quad_clean.evt |
| Size (bytes) | 880,634,880 | 144,069,120 |
| Size | 839.8 MB | 137.4 MB |
| Events in quadrant A | 5,806,068 | 884,246 |
| Events in quadrant B | 6,251,023 | 887,661 |
| Events in quadrant C | 5,571,307 | 883,720 |
| Events in quadrant D | 8,187,677 | 835,255 |
| Mode SS | |||
|---|---|---|---|
| Quadrant | BADHDUFLAG | Total packets | Discarded packets |
| A | 0 | 256 | 0 |
| B | 0 | 256 | 0 |
| C | 0 | 256 | 0 |
| D | 0 | 256 | 0 |
| Mode M0 | |||
|---|---|---|---|
| Quadrant | BADHDUFLAG | Total packets | Discarded packets |
| A | 0 | 26148 | 4 |
| B | 0 | 27022 | 3 |
| C | 0 | 25691 | 3 |
| D | 0 | 32695 | 3 |
| Mode M9 | |||
|---|---|---|---|
| Quadrant | BADHDUFLAG | Total packets | Discarded packets |
| A | 0 | 15 | 0 |
| B | 0 | 15 | 0 |
| C | 0 | 15 | 0 |
| D | 0 | 16 | 0 |
| Quadrant | Total seconds | Saturated seconds | Saturation percentage |
|---|---|---|---|
| A | 12619 | 86 | 0.681512% |
| B | 12619 | 131 | 1.038117% |
| C | 12619 | 70 | 0.554719% |
| D | 12619 | 203 | 1.608685% |
Noise dominated data is calculated using 1-second bins in cleaned event files. If a bin has >2000 counts, and if more than 50% of those come from <1% of pixels, then it is considered to be noise-dominated and hence unusable.
| Quadrant | # 1 sec bins | Bins with >0 counts | Bins with >2000 counts | High rate bins dominated by noise | Noise dominated (total time) | Noise dominated (detector-on time) | Marked lightcurve |
|---|---|---|---|---|---|---|---|
| A | 14014 | 12619 | 14 | 14 | 0.10% | 0.11% | 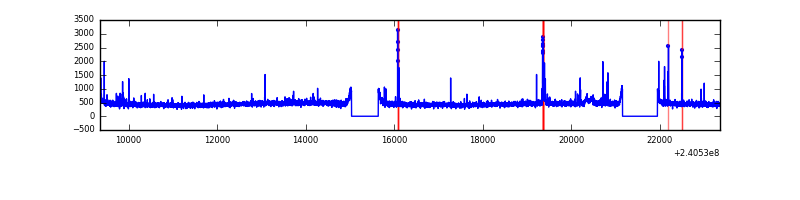 |
| B | 14014 | 12621 | 33 | 33 | 0.24% | 0.26% | 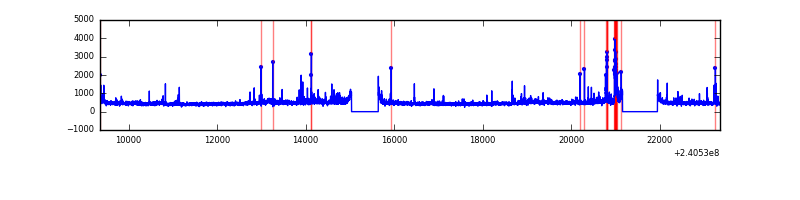 |
| C | 14014 | 12621 | 5 | 5 | 0.04% | 0.04% | 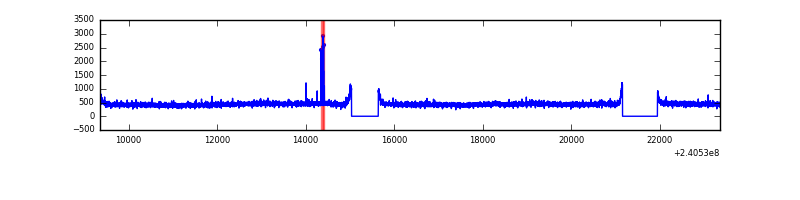 |
| D | 14014 | 12620 | 127 | 127 | 0.91% | 1.01% | 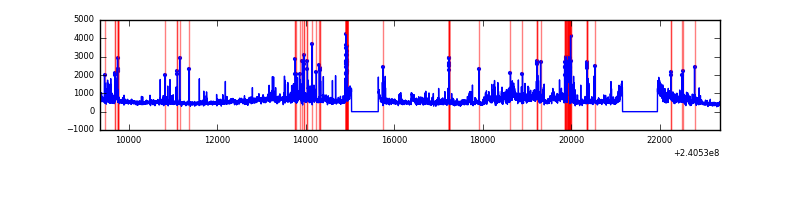 |
Top three noisy pixels from each quadrant. If the there are fewer than three noisy pixels in the level2.evt file, extra rows are filled as -1
| Pixel properties | Quadrant properties | ||||||
|---|---|---|---|---|---|---|---|
| Quadrant | DetID | PixID | Counts | Sigma | Mean | Median | Sigma |
| A | 15 | 223 | 88884 | 301.16 | 1444 | 1413 | 290.4 |
| A | 15 | 174 | 68761 | 231.88 | 1444 | 1413 | 290.4 |
| A | 15 | 239 | 31459 | 103.45 | 1444 | 1413 | 290.4 |
| B | 4 | 239 | 202724 | 723.25 | 1455 | 1420 | 278.3 |
| B | 11 | 51 | 90068 | 318.5 | 1455 | 1420 | 278.3 |
| B | 0 | 219 | 81786 | 288.74 | 1455 | 1420 | 278.3 |
| C | 14 | 67 | 36536 | 107.87 | 1403 | 1409 | 325.6 |
| C | 14 | 234 | 36322 | 107.22 | 1403 | 1409 | 325.6 |
| C | 8 | 128 | 11853 | 32.07 | 1403 | 1409 | 325.6 |
| D | 1 | 52 | 1296946 | 3845.36 | 1387 | 1345 | 336.9 |
| D | 8 | 195 | 828656 | 2455.47 | 1387 | 1345 | 336.9 |
| D | 4 | 95 | 313345 | 926.02 | 1387 | 1345 | 336.9 |
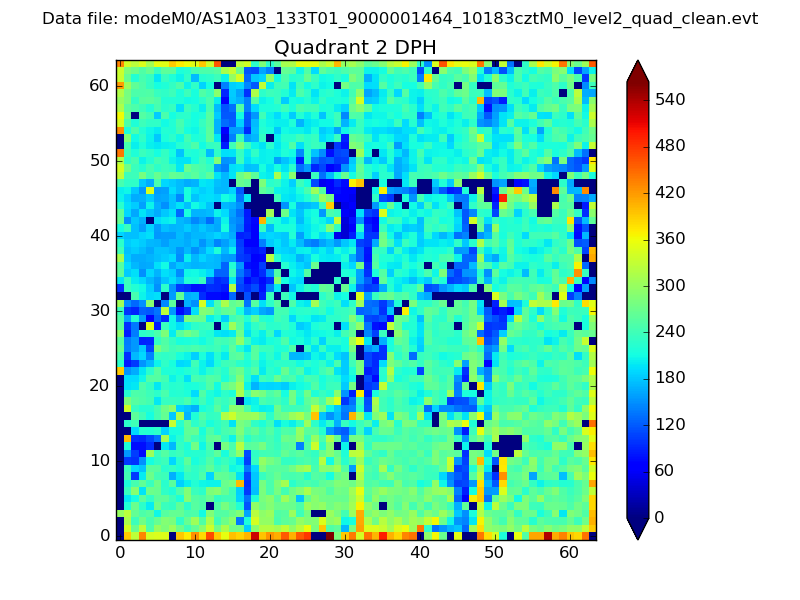
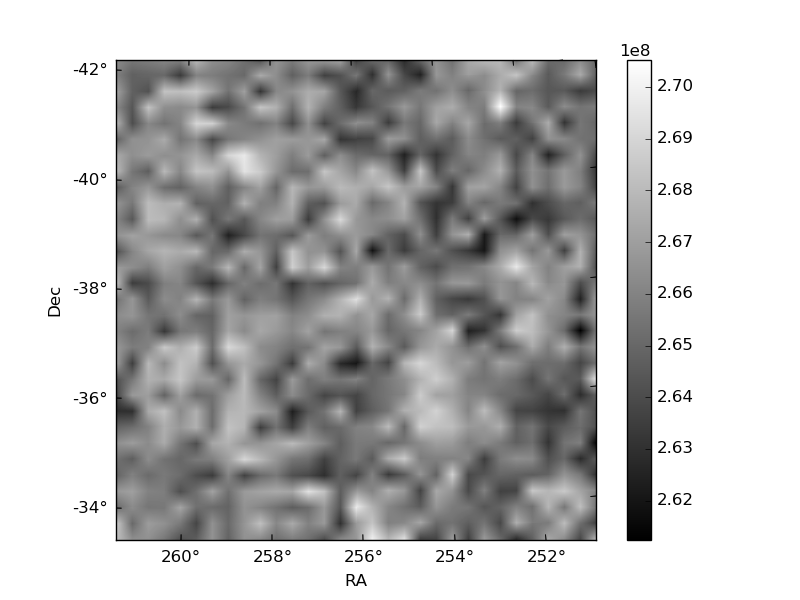
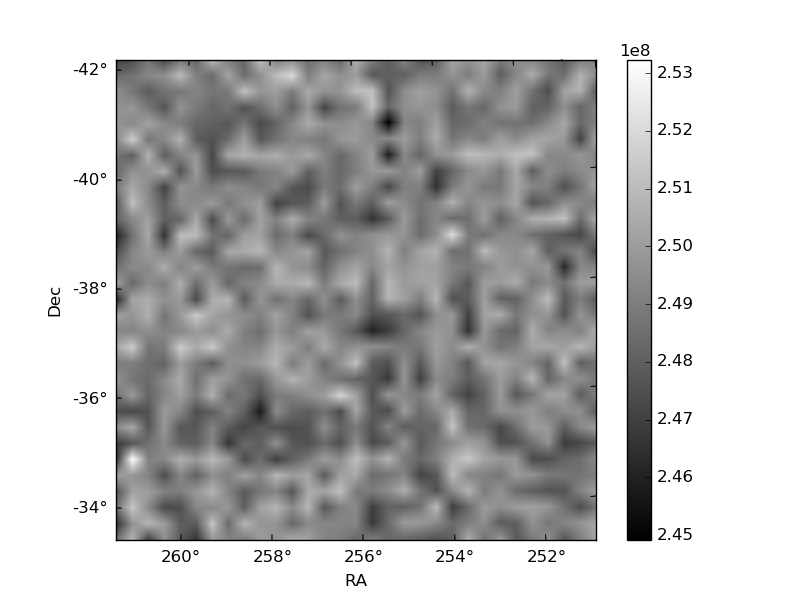
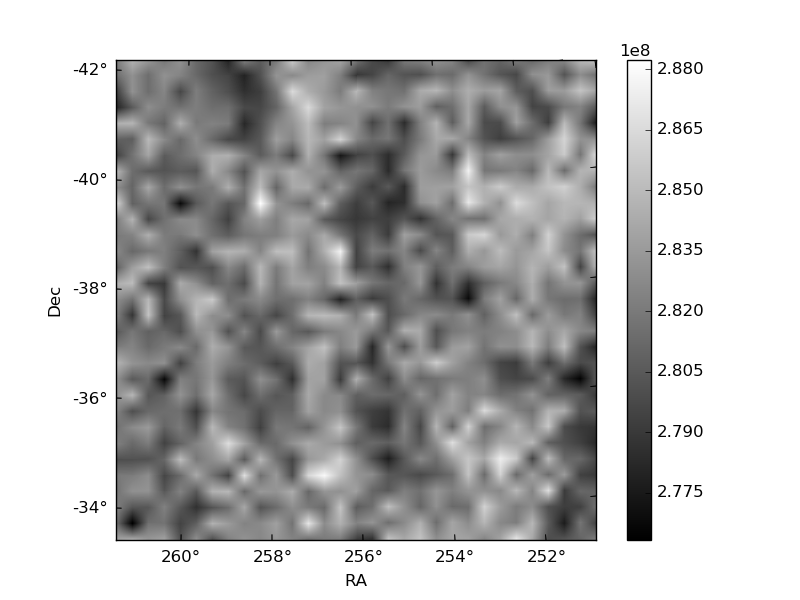
Histogram calculated using DETX and DETY for each event in the final _common_clean file
| Quadrant A | 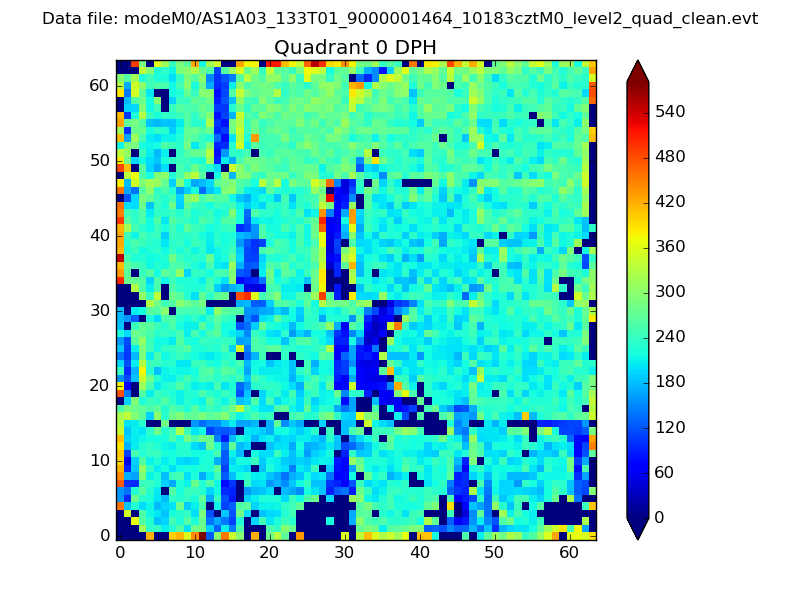 |
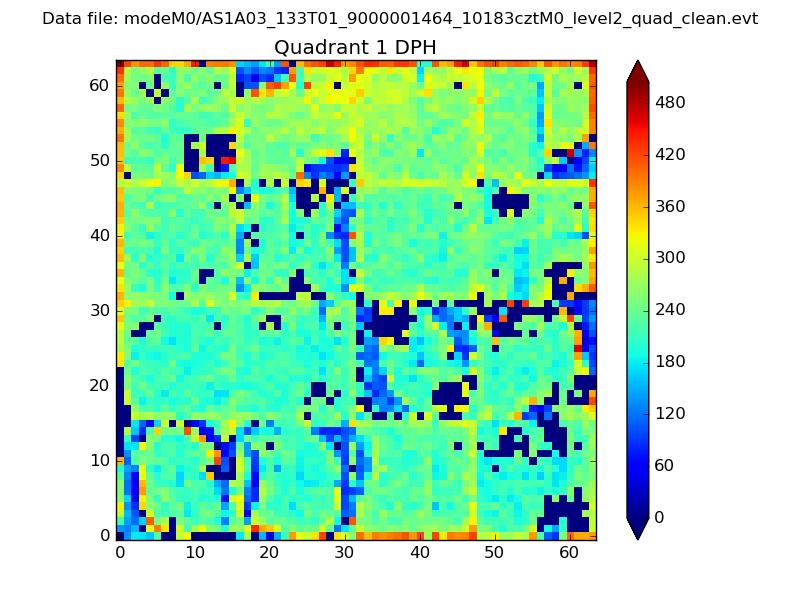 |
Quadrant B |
|---|---|---|---|
| Quadrant D | 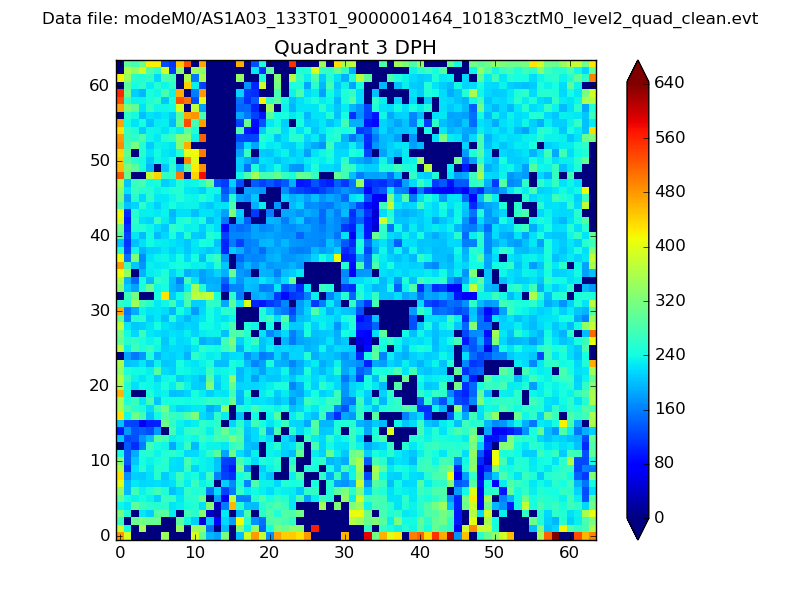 |
 |
Quadrant C |
| Plot type | Count rate plots | Images |
|---|---|---|
| Comparison with Poisson distribution Blue bars denote a histogram of data divided into 1 sec bins. Red curve is a Poisson curve with rate = median count rate of data. |
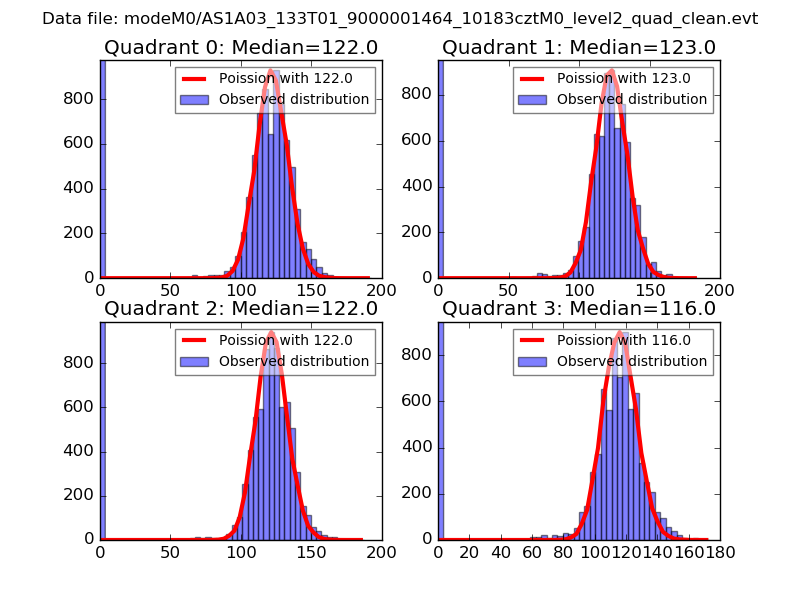 |
 |
| Quadrant-wise count rates Data is divided into 100 sec bins |
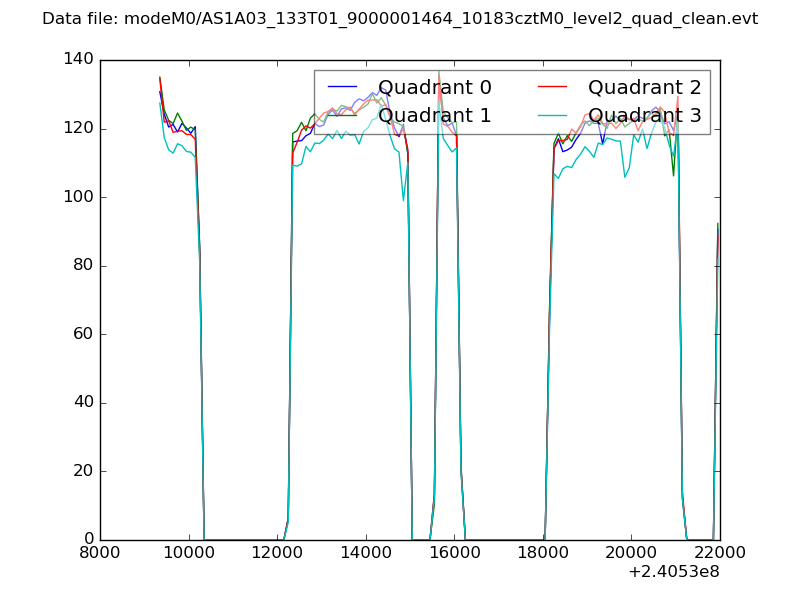 |
|
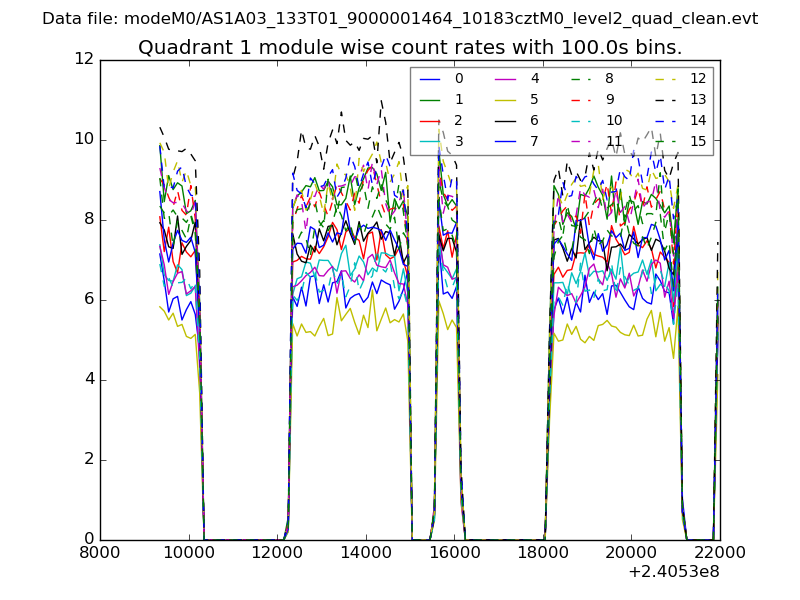
| Module-wise count rates for Quadrant A Data is divided into 100 sec bins |
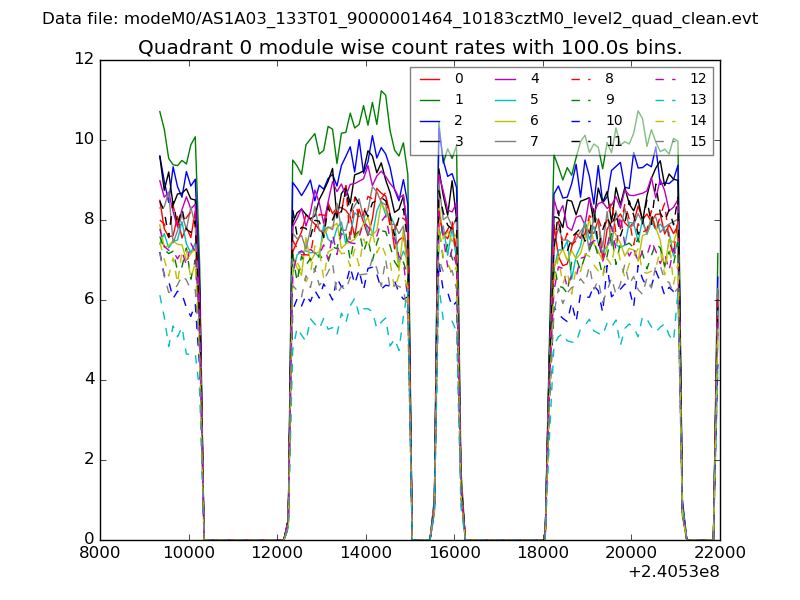 |
 |
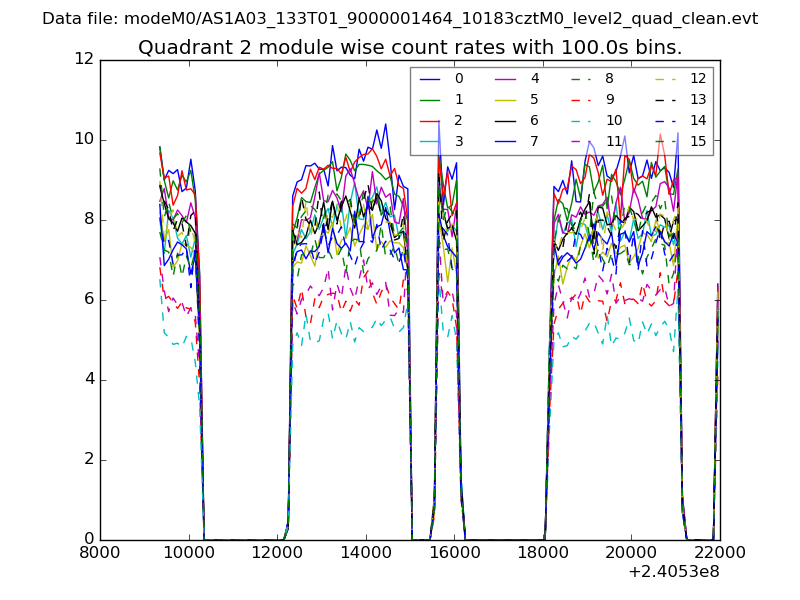
| Module-wise count rates for Quadrant B Data is divided into 100 sec bins |
 |
 |
| Module-wise count rates for Quadrant C Data is divided into 100 sec bins |
 |
 |
| Module-wise count rates for Quadrant D Data is divided into 100 sec bins |
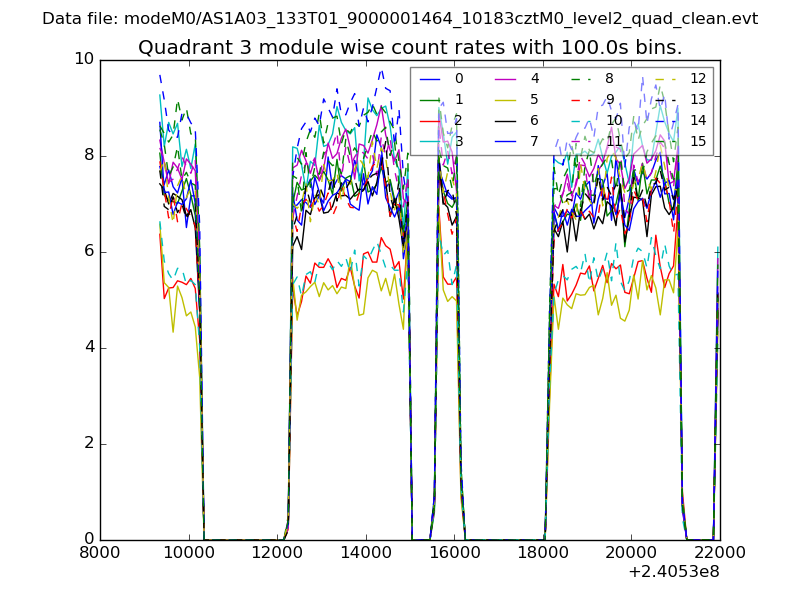 |
 |
| Parameter | Plot |
|---|---|
| CZT HV Monitor | 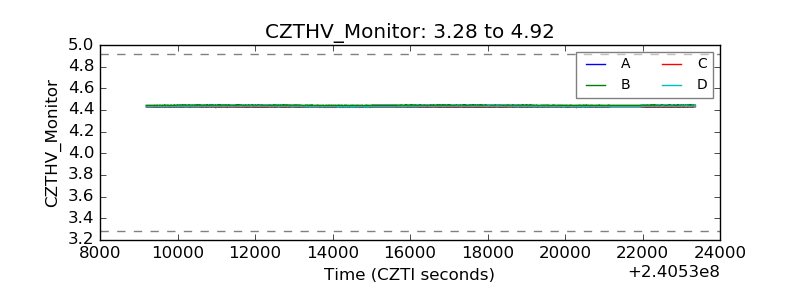 |
| D_VDD |  |
| Temperature 1 | 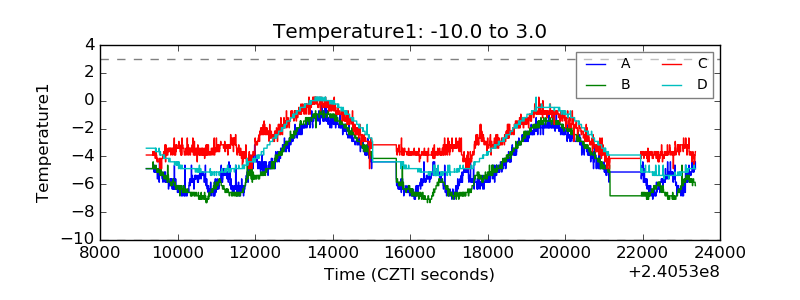 |
| Veto HV Monitor | 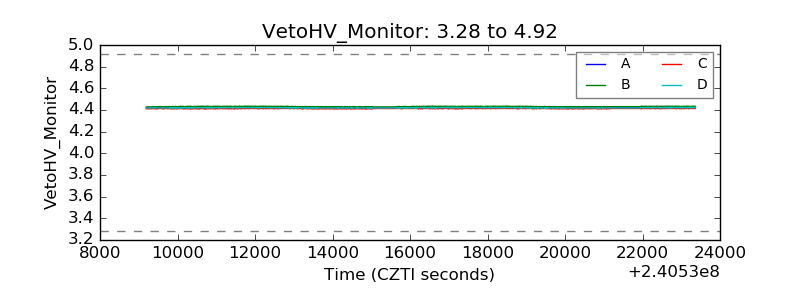 |
| Veto LLD | 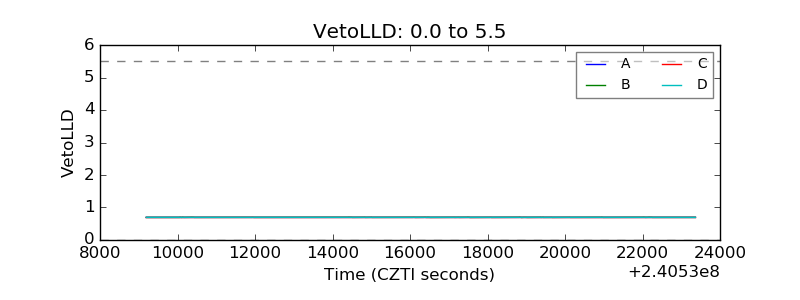 |
| Alpha Counter | 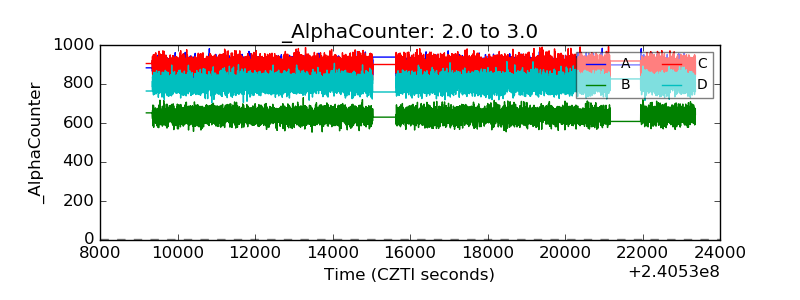 |
| _CPM_Rate | 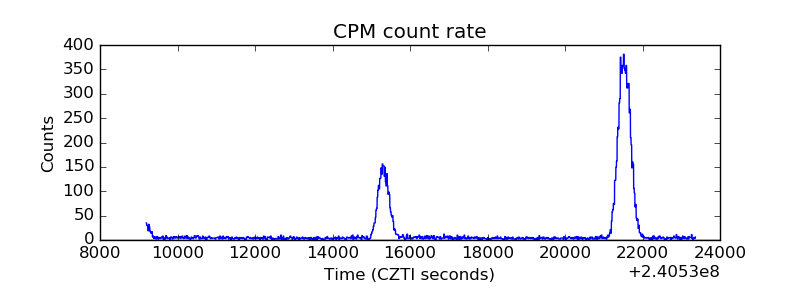 |
| CZT Counter | 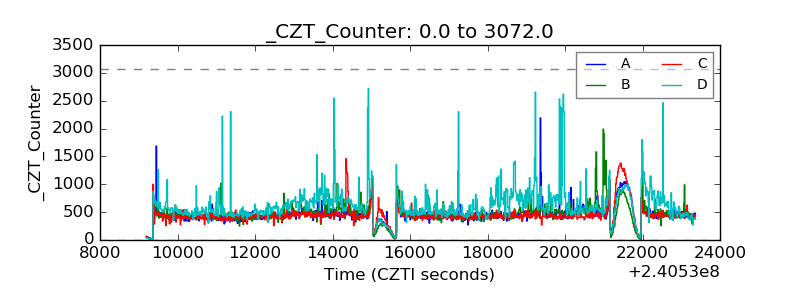 |
| +2.5 Volts monitor |  |
| +5 Volts monitor |  |
| _ROLL_ROT | 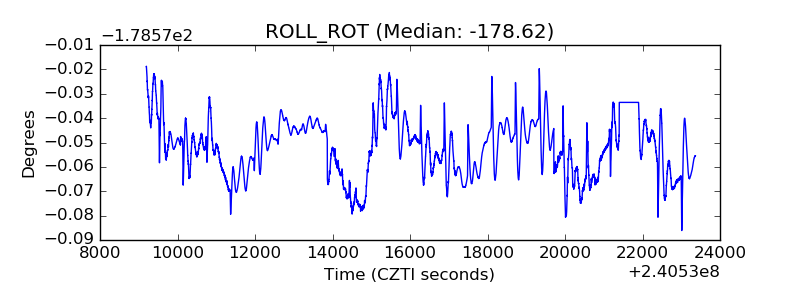 |
| _Roll_DEC | 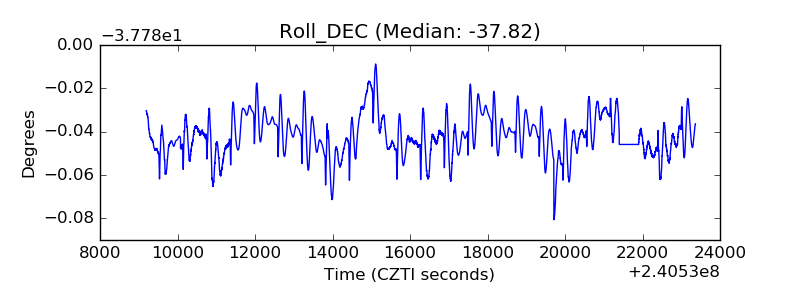 |
| _Roll_RA |  |
| Veto Counter | 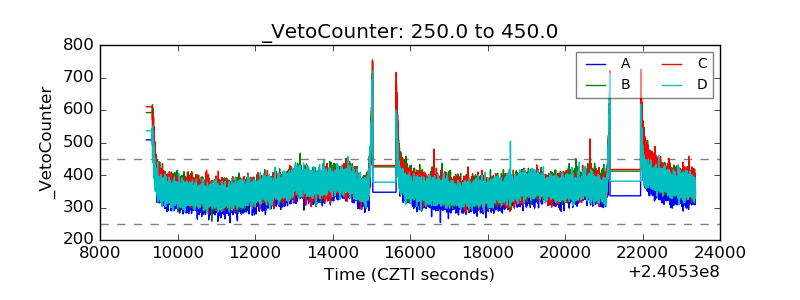 |