| Param | Original file | Final file |
|---|---|---|
| Filename | modeM0/AS1A03_133T01_9000001464_10184cztM0_level2.evt | modeM0/AS1A03_133T01_9000001464_10184cztM0_level2_quad_clean.evt |
| Size (bytes) | 477,685,440 | 71,107,200 |
| Size | 455.6 MB | 67.8 MB |
| Events in quadrant A | 3,134,562 | 428,305 |
| Events in quadrant B | 3,419,404 | 429,149 |
| Events in quadrant C | 3,022,922 | 430,077 |
| Events in quadrant D | 4,434,430 | 397,918 |
| Mode SS | |||
|---|---|---|---|
| Quadrant | BADHDUFLAG | Total packets | Discarded packets |
| A | 0 | 138 | 0 |
| B | 0 | 138 | 0 |
| C | 0 | 138 | 0 |
| D | 0 | 138 | 0 |
| Mode M0 | |||
|---|---|---|---|
| Quadrant | BADHDUFLAG | Total packets | Discarded packets |
| A | 0 | 13813 | 9 |
| B | 0 | 14438 | 2 |
| C | 0 | 13601 | 4 |
| D | 0 | 17595 | 2 |
| Mode M9 | |||
|---|---|---|---|
| Quadrant | BADHDUFLAG | Total packets | Discarded packets |
| A | 0 | 13 | 0 |
| B | 0 | 13 | 0 |
| C | 0 | 13 | 0 |
| D | 0 | 14 | 0 |
| Quadrant | Total seconds | Saturated seconds | Saturation percentage |
|---|---|---|---|
| A | 6698 | 52 | 0.776351% |
| B | 6701 | 67 | 0.999851% |
| C | 6700 | 36 | 0.537313% |
| D | 6701 | 179 | 2.671243% |
Noise dominated data is calculated using 1-second bins in cleaned event files. If a bin has >2000 counts, and if more than 50% of those come from <1% of pixels, then it is considered to be noise-dominated and hence unusable.
| Quadrant | # 1 sec bins | Bins with >0 counts | Bins with >2000 counts | High rate bins dominated by noise | Noise dominated (total time) | Noise dominated (detector-on time) | Marked lightcurve |
|---|---|---|---|---|---|---|---|
| A | 7651 | 6702 | 23 | 23 | 0.30% | 0.34% | 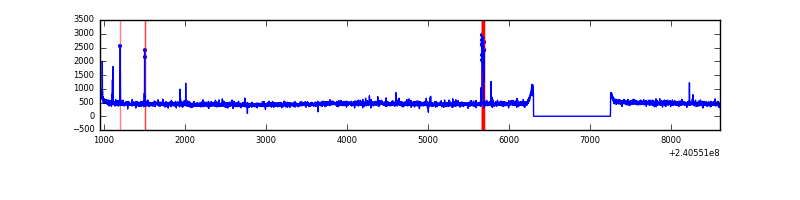 |
| B | 7651 | 6701 | 23 | 23 | 0.30% | 0.34% | 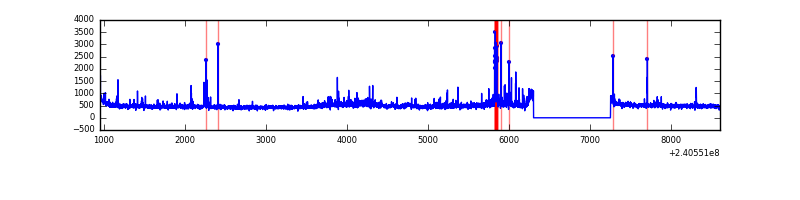 |
| C | 7651 | 6701 | 0 | 0 | 0.00% | 0.00% | 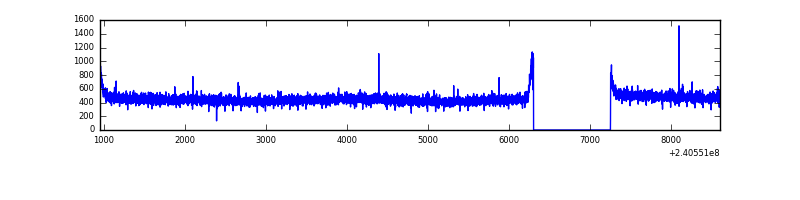 |
| D | 7651 | 6701 | 147 | 147 | 1.92% | 2.19% | 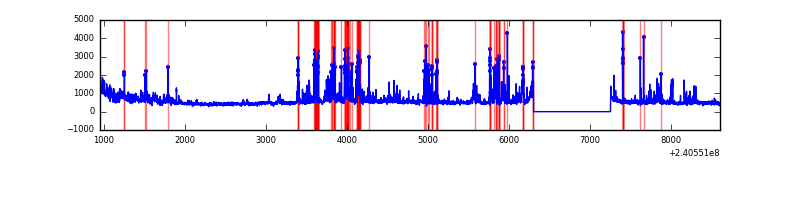 |
Top three noisy pixels from each quadrant. If the there are fewer than three noisy pixels in the level2.evt file, extra rows are filled as -1
| Pixel properties | Quadrant properties | ||||||
|---|---|---|---|---|---|---|---|
| Quadrant | DetID | PixID | Counts | Sigma | Mean | Median | Sigma |
| A | 15 | 223 | 59128 | 362.88 | 788 | 772 | 160.8 |
| A | 15 | 239 | 21459 | 128.64 | 788 | 772 | 160.8 |
| A | 0 | 226 | 7139 | 39.59 | 788 | 772 | 160.8 |
| B | 4 | 239 | 119002 | 774.76 | 795 | 776 | 152.6 |
| B | 0 | 214 | 68475 | 443.64 | 795 | 776 | 152.6 |
| B | 11 | 51 | 54680 | 353.24 | 795 | 776 | 152.6 |
| C | 14 | 67 | 11244 | 58.74 | 771 | 776 | 178.2 |
| C | 13 | 61 | 5728 | 27.79 | 771 | 776 | 178.2 |
| C | 14 | 234 | 5237 | 25.03 | 771 | 776 | 178.2 |
| D | 1 | 52 | 938542 | 4641.5 | 746 | 730 | 202.0 |
| D | 8 | 195 | 350453 | 1730.88 | 746 | 730 | 202.0 |
| D | 7 | 71 | 99584 | 489.26 | 746 | 730 | 202.0 |
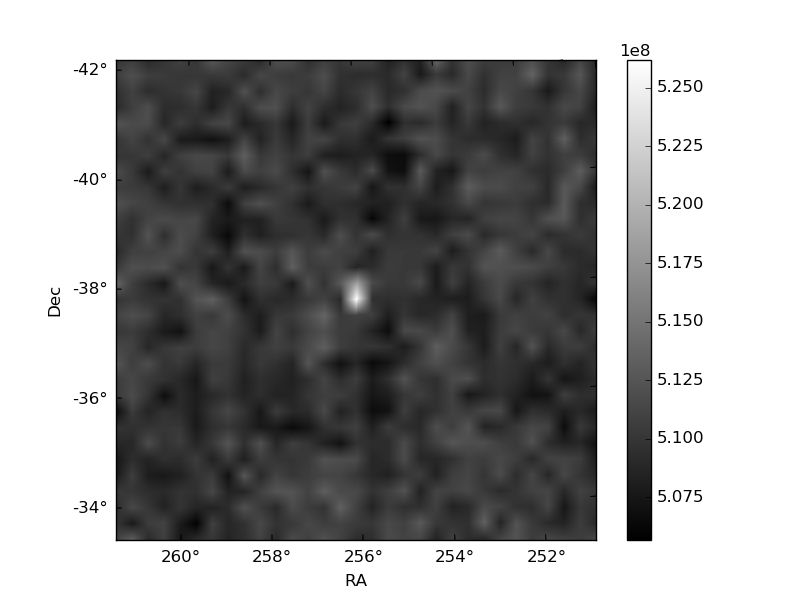
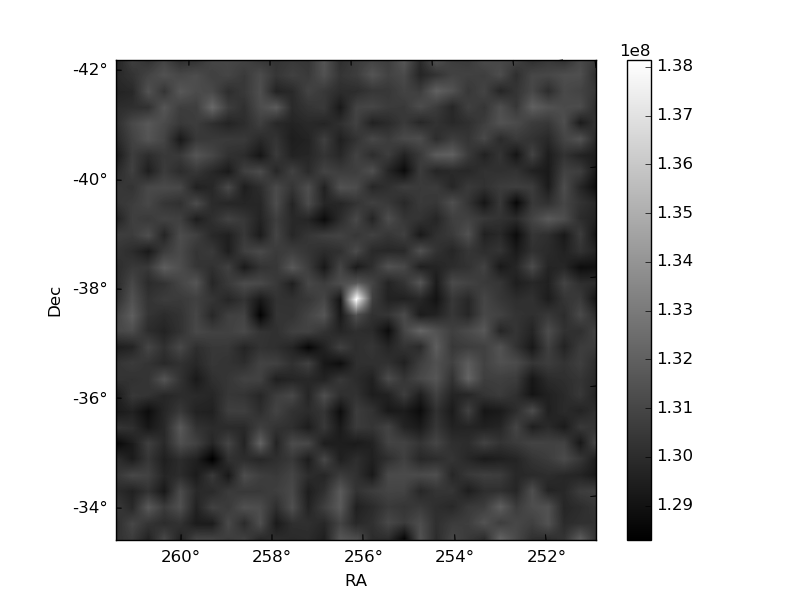
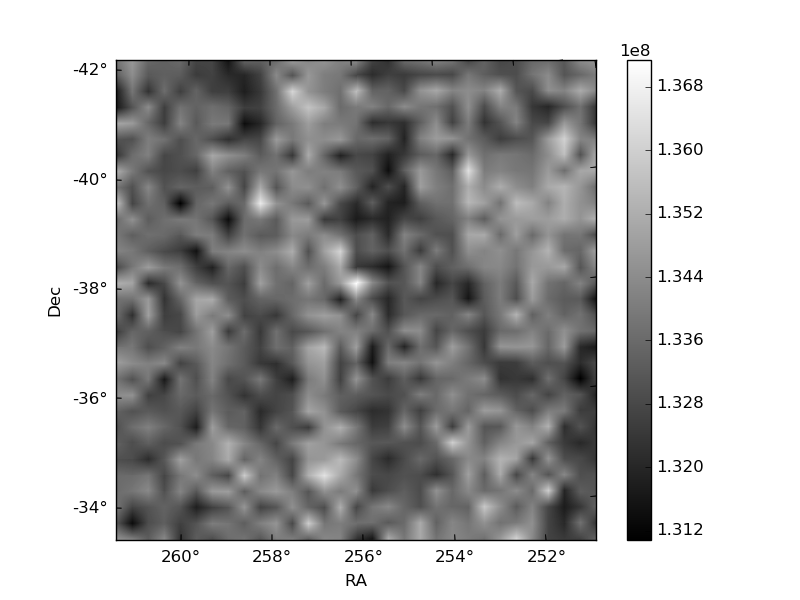
Histogram calculated using DETX and DETY for each event in the final _common_clean file
| Quadrant A | 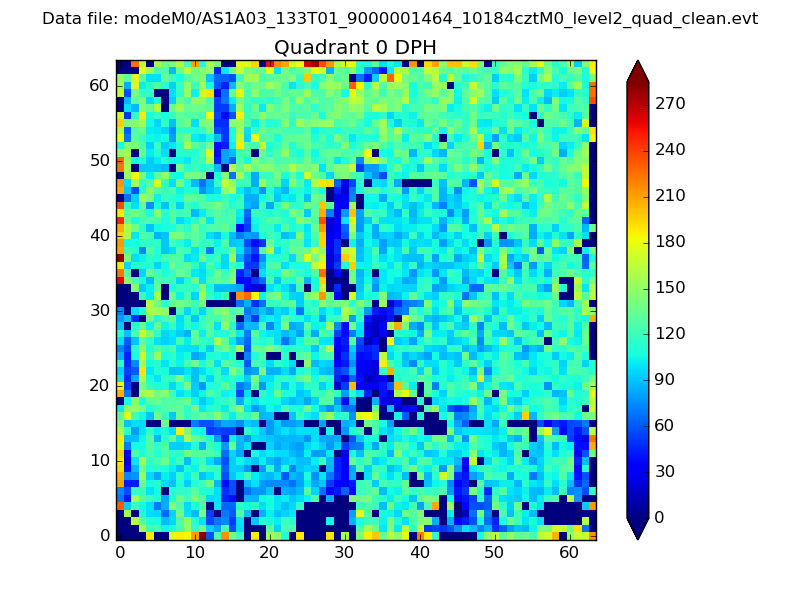 |
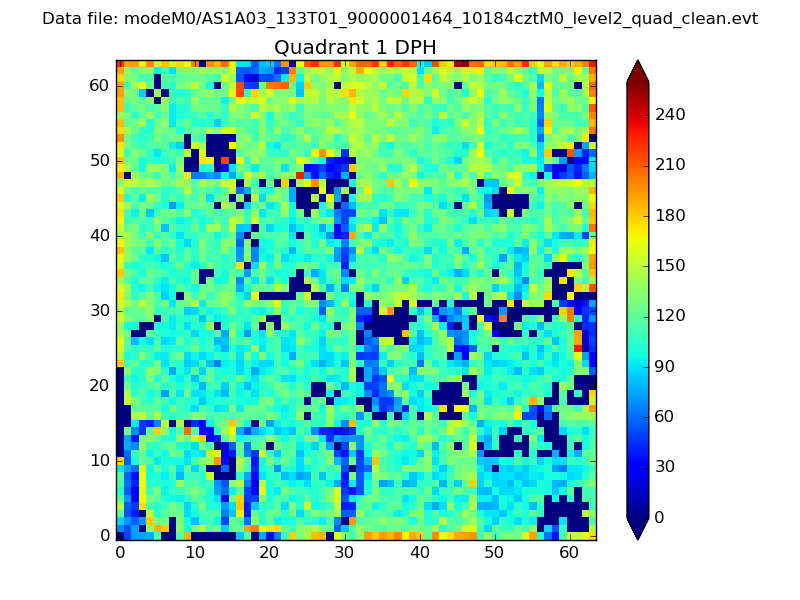 |
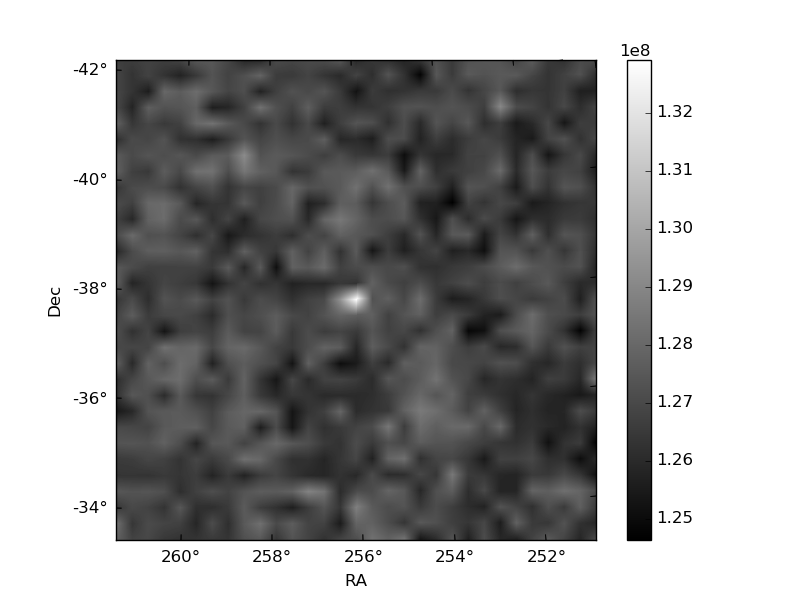
Quadrant B |
|---|---|---|---|
| Quadrant D | 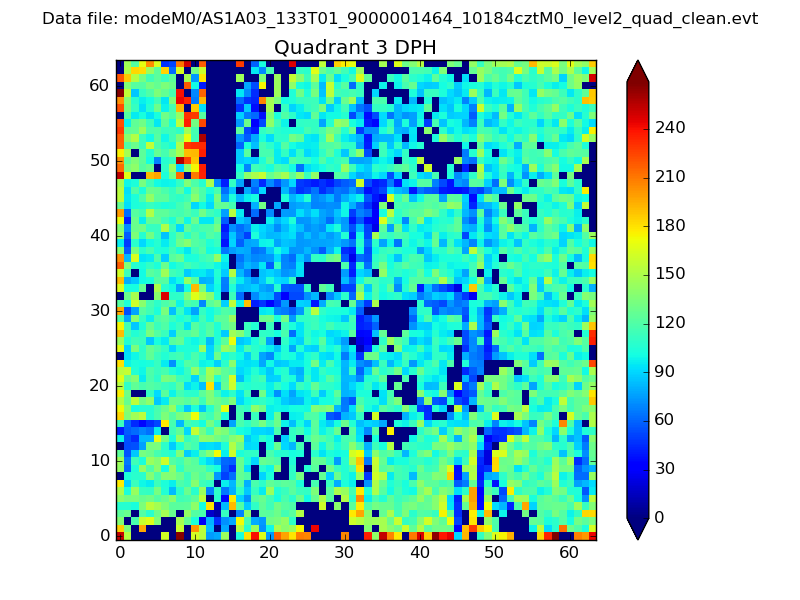 |
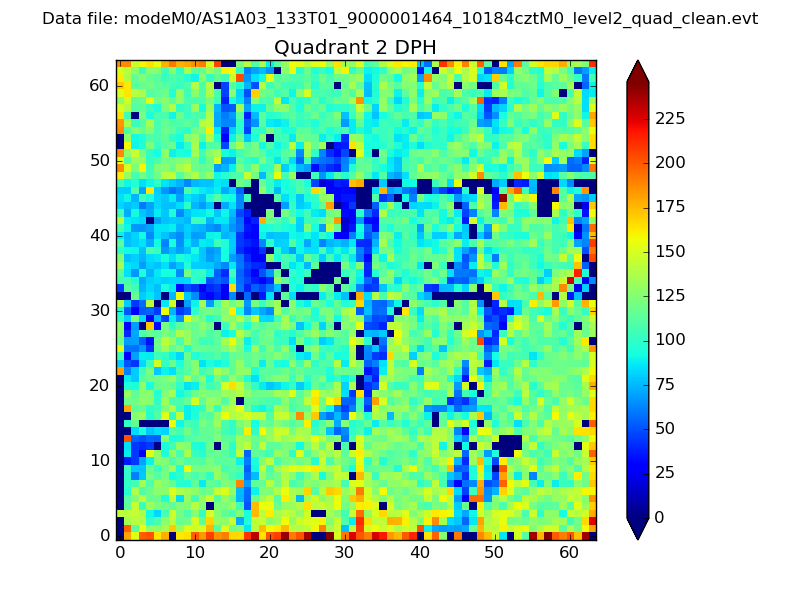 |
Quadrant C |
| Plot type | Count rate plots | Images |
|---|---|---|
| Comparison with Poisson distribution Blue bars denote a histogram of data divided into 1 sec bins. Red curve is a Poisson curve with rate = median count rate of data. |
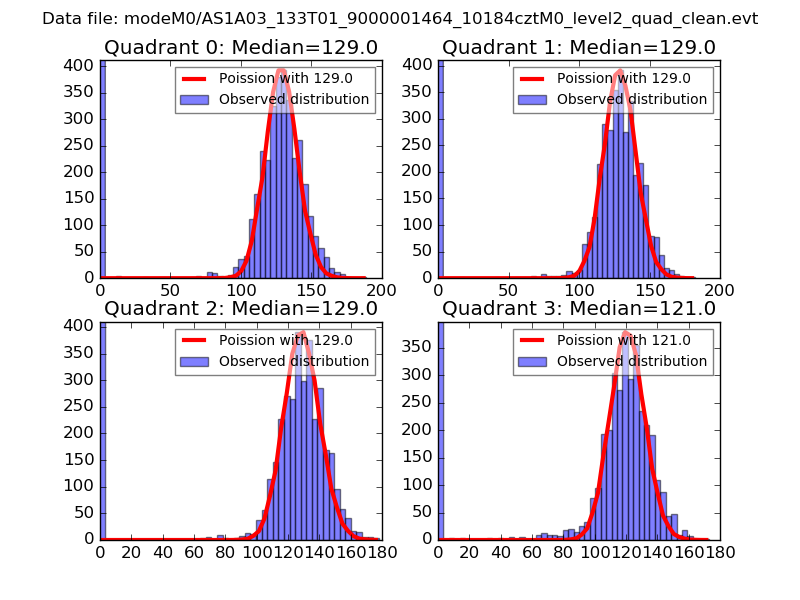 |
 |
| Quadrant-wise count rates Data is divided into 100 sec bins |
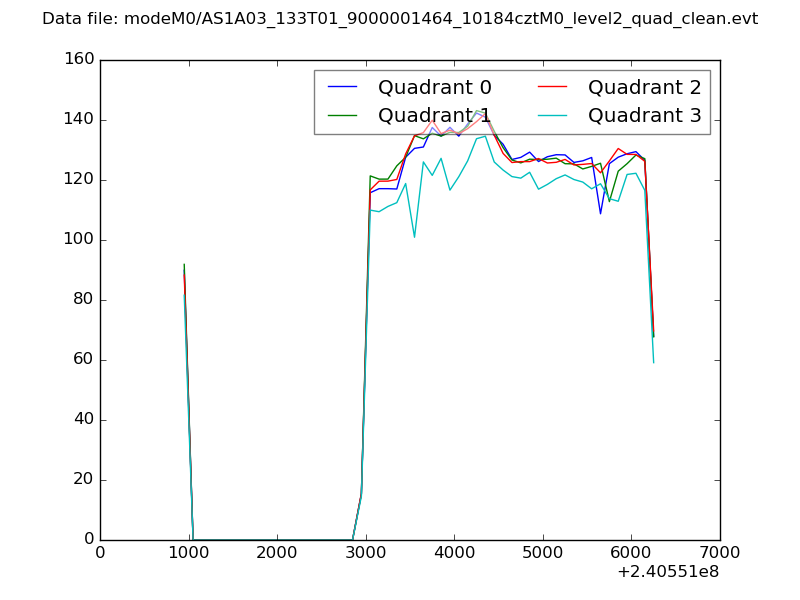 |
|
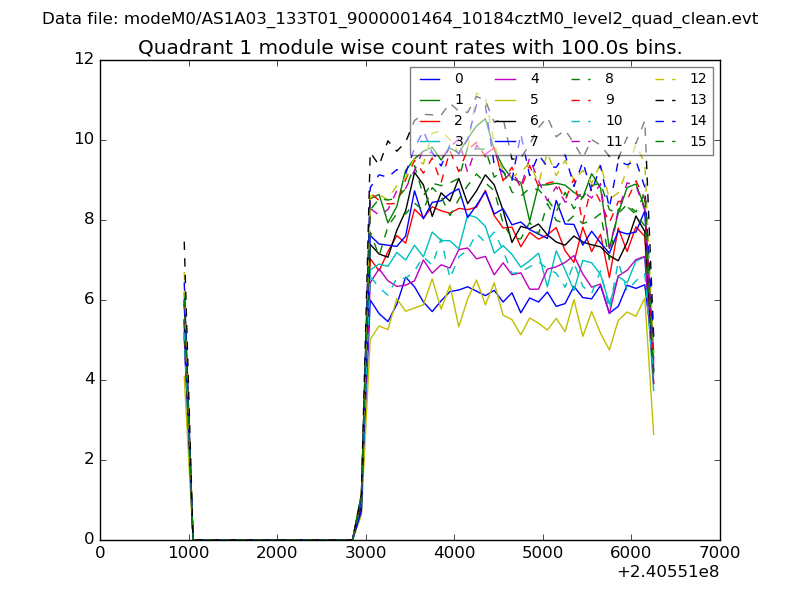
| Module-wise count rates for Quadrant A Data is divided into 100 sec bins |
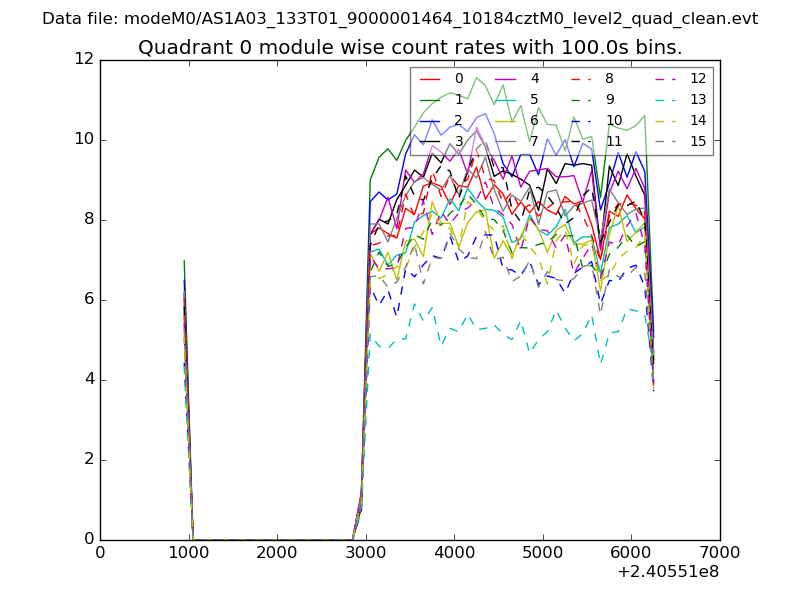 |
 |
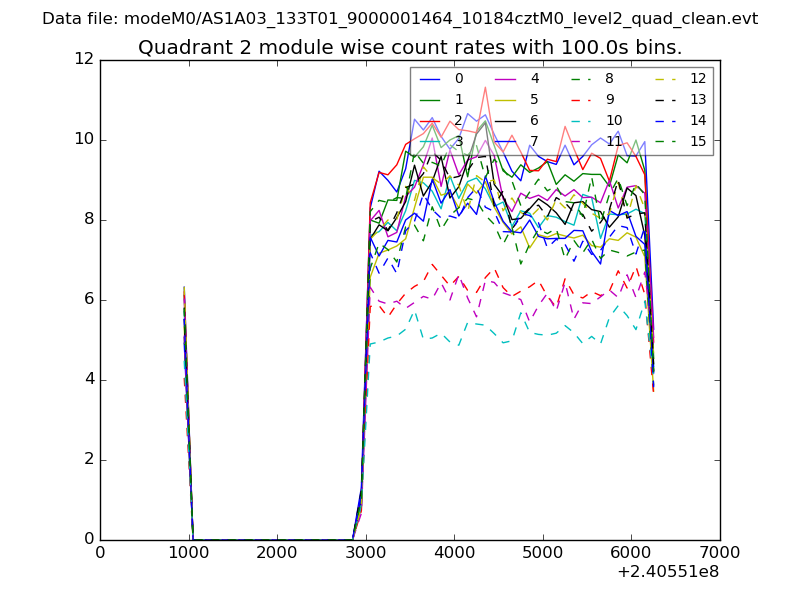
| Module-wise count rates for Quadrant B Data is divided into 100 sec bins |
 |
 |
| Module-wise count rates for Quadrant C Data is divided into 100 sec bins |
 |
 |
| Module-wise count rates for Quadrant D Data is divided into 100 sec bins |
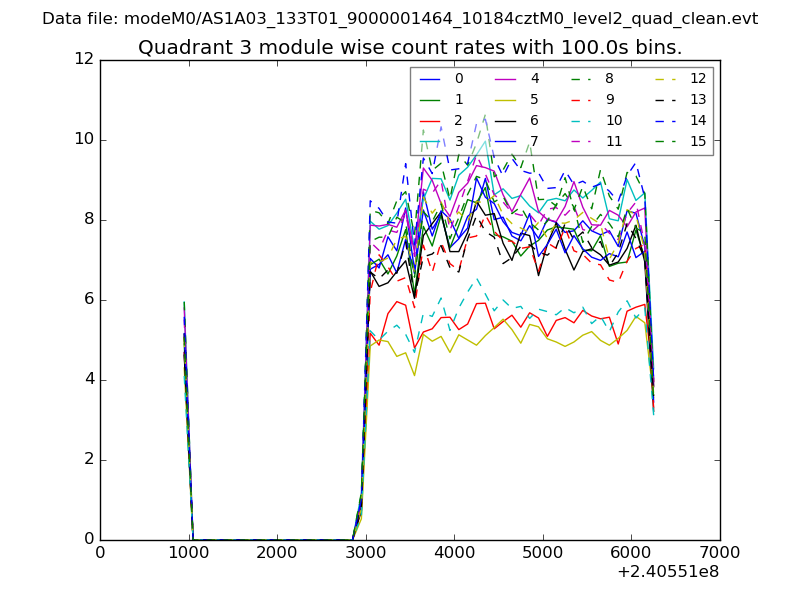 |
 |
| Parameter | Plot |
|---|---|
| CZT HV Monitor | 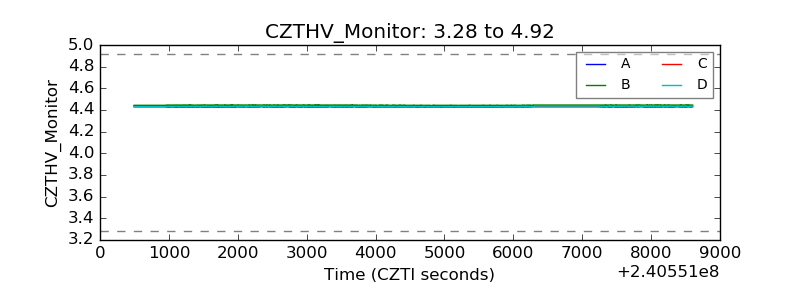 |
| D_VDD | 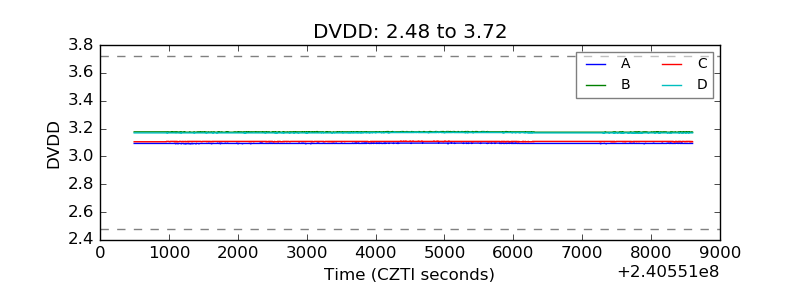 |
| Temperature 1 | 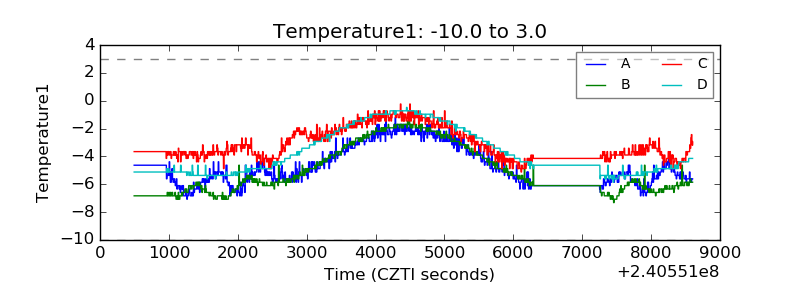 |
| Veto HV Monitor |  |
| Veto LLD | 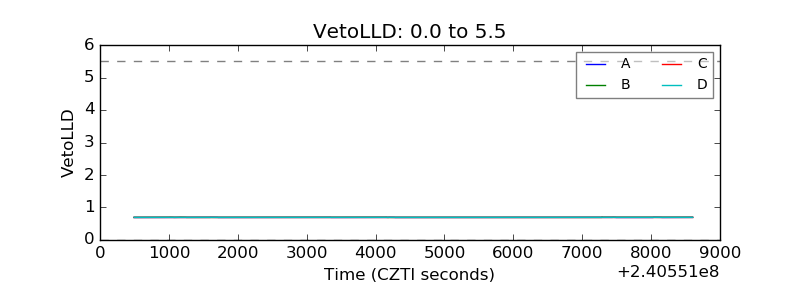 |
| Alpha Counter | 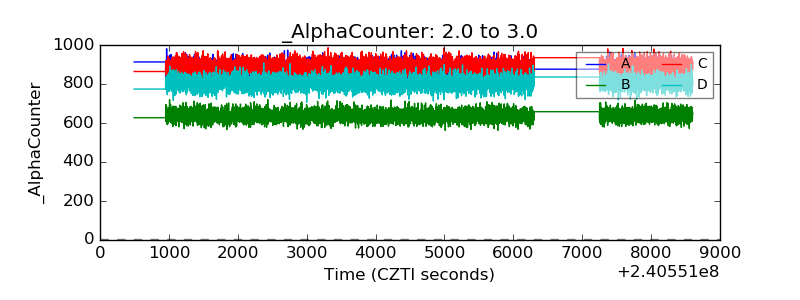 |
| _CPM_Rate | 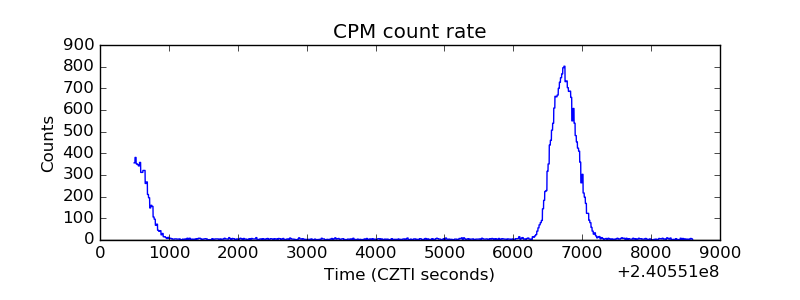 |
| CZT Counter | 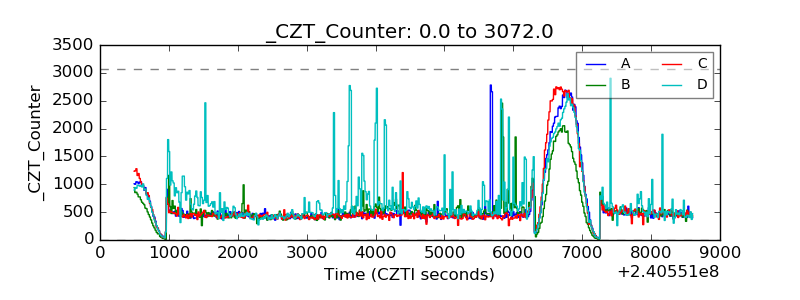 |
| +2.5 Volts monitor |  |
| +5 Volts monitor |  |
| _ROLL_ROT | 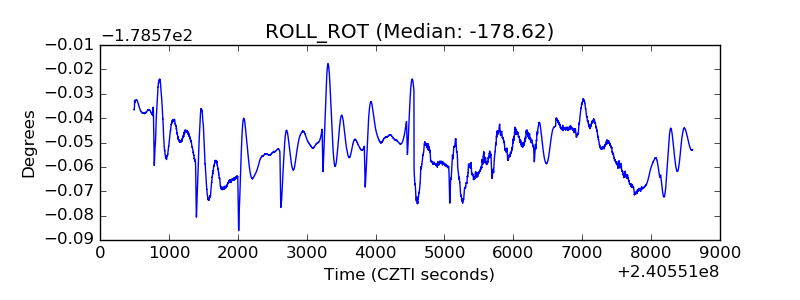 |
| _Roll_DEC | 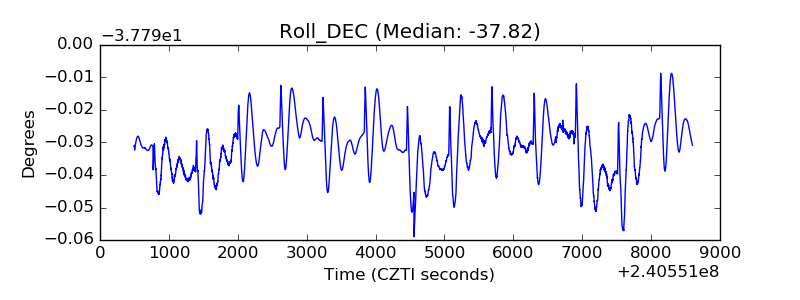 |
| _Roll_RA | 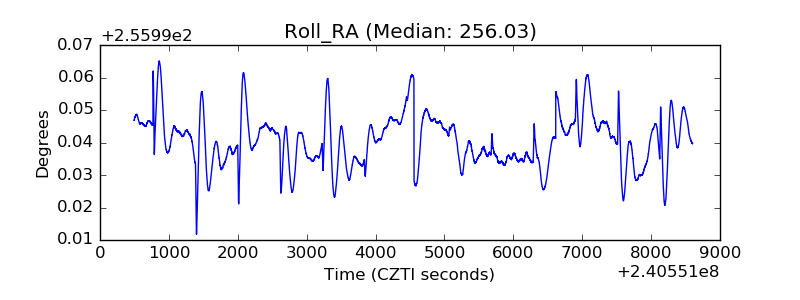 |
| Veto Counter | 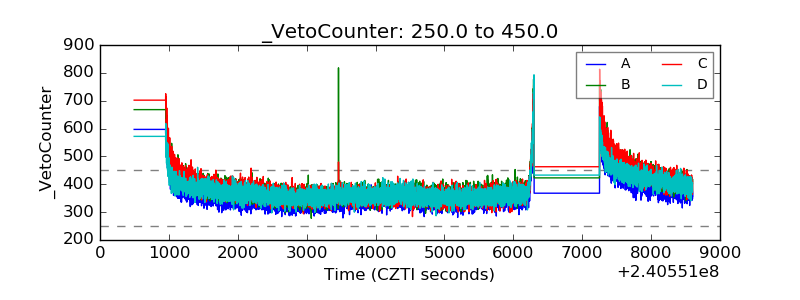 |