| Param | Original file | Final file |
|---|---|---|
| Filename | modeM0/AS1A03_133T01_9000001464_10185cztM0_level2.evt | modeM0/AS1A03_133T01_9000001464_10185cztM0_level2_quad_clean.evt |
| Size (bytes) | 521,879,040 | 88,047,360 |
| Size | 497.7 MB | 84.0 MB |
| Events in quadrant A | 3,476,558 | 546,648 |
| Events in quadrant B | 3,895,585 | 549,291 |
| Events in quadrant C | 3,375,659 | 551,328 |
| Events in quadrant D | 4,568,021 | 516,968 |
| Mode SS | |||
|---|---|---|---|
| Quadrant | BADHDUFLAG | Total packets | Discarded packets |
| A | 0 | 148 | 0 |
| B | 0 | 148 | 0 |
| C | 0 | 148 | 0 |
| D | 0 | 148 | 0 |
| Mode M0 | |||
|---|---|---|---|
| Quadrant | BADHDUFLAG | Total packets | Discarded packets |
| A | 0 | 14990 | 5 |
| B | 0 | 16033 | 6 |
| C | 0 | 14852 | 6 |
| D | 0 | 18050 | 5 |
| Mode M9 | |||
|---|---|---|---|
| Quadrant | BADHDUFLAG | Total packets | Discarded packets |
| A | 0 | 20 | 0 |
| B | 0 | 20 | 0 |
| C | 0 | 20 | 0 |
| D | 0 | 20 | 0 |
| Quadrant | Total seconds | Saturated seconds | Saturation percentage |
|---|---|---|---|
| A | 7211 | 91 | 1.261961% |
| B | 7210 | 125 | 1.733703% |
| C | 7210 | 74 | 1.026352% |
| D | 7211 | 247 | 3.425322% |
Noise dominated data is calculated using 1-second bins in cleaned event files. If a bin has >2000 counts, and if more than 50% of those come from <1% of pixels, then it is considered to be noise-dominated and hence unusable.
| Quadrant | # 1 sec bins | Bins with >0 counts | Bins with >2000 counts | High rate bins dominated by noise | Noise dominated (total time) | Noise dominated (detector-on time) | Marked lightcurve |
|---|---|---|---|---|---|---|---|
| A | 9227 | 7213 | 21 | 21 | 0.23% | 0.29% | 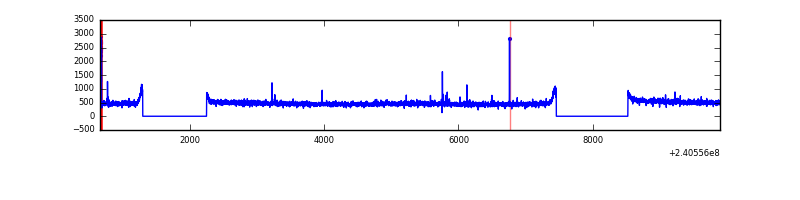 |
| B | 9227 | 7212 | 30 | 30 | 0.33% | 0.42% | 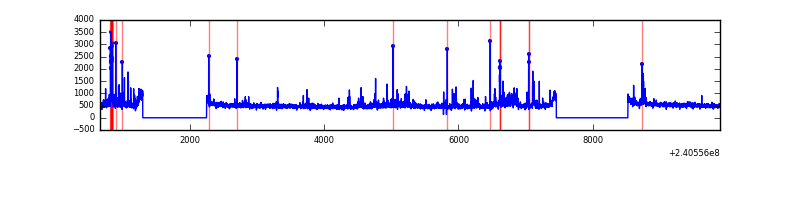 |
| C | 9227 | 7212 | 0 | 0 | 0.00% | 0.00% | 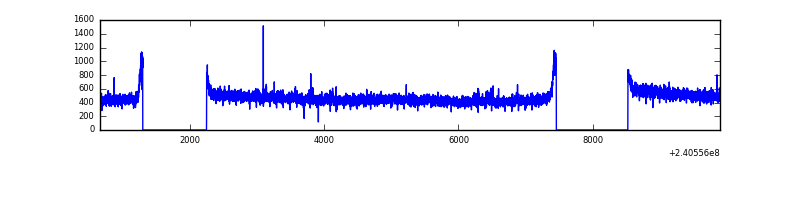 |
| D | 9227 | 7212 | 157 | 157 | 1.70% | 2.18% | 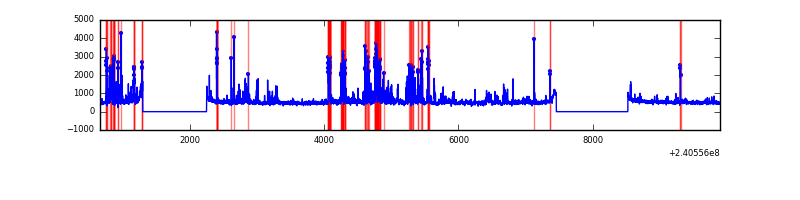 |
Top three noisy pixels from each quadrant. If the there are fewer than three noisy pixels in the level2.evt file, extra rows are filled as -1
| Pixel properties | Quadrant properties | ||||||
|---|---|---|---|---|---|---|---|
| Quadrant | DetID | PixID | Counts | Sigma | Mean | Median | Sigma |
| A | 15 | 223 | 40337 | 221.45 | 880 | 864 | 178.2 |
| A | 15 | 239 | 14649 | 77.34 | 880 | 864 | 178.2 |
| A | 3 | 1 | 13891 | 73.08 | 880 | 864 | 178.2 |
| B | 4 | 239 | 152982 | 902.89 | 880 | 859 | 168.5 |
| B | 11 | 51 | 93536 | 550.06 | 880 | 859 | 168.5 |
| B | 0 | 214 | 75165 | 441.03 | 880 | 859 | 168.5 |
| C | 14 | 67 | 30091 | 148.25 | 857 | 863 | 197.2 |
| C | 13 | 61 | 6365 | 27.91 | 857 | 863 | 197.2 |
| C | 14 | 234 | 3311 | 12.42 | 857 | 863 | 197.2 |
| D | 1 | 52 | 585723 | 2658.77 | 834 | 817 | 220.0 |
| D | 8 | 195 | 294825 | 1336.45 | 834 | 817 | 220.0 |
| D | 4 | 95 | 126273 | 570.28 | 834 | 817 | 220.0 |
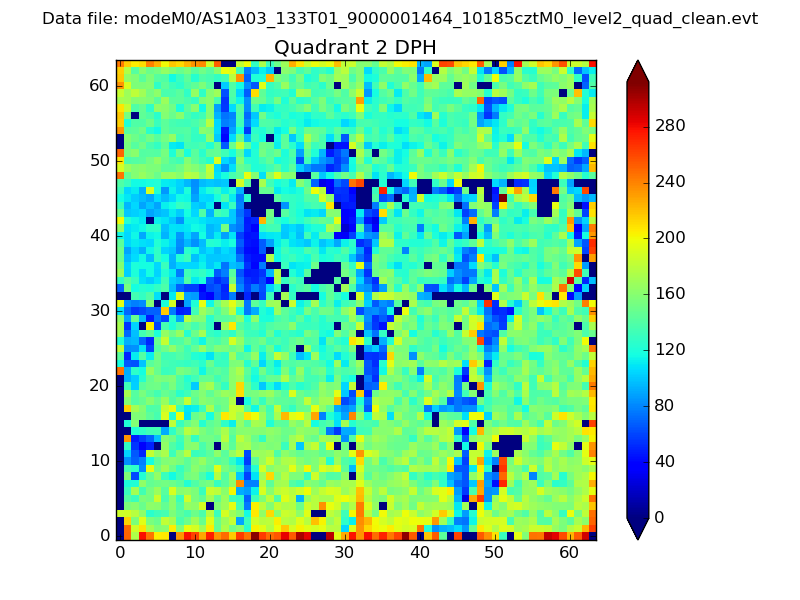
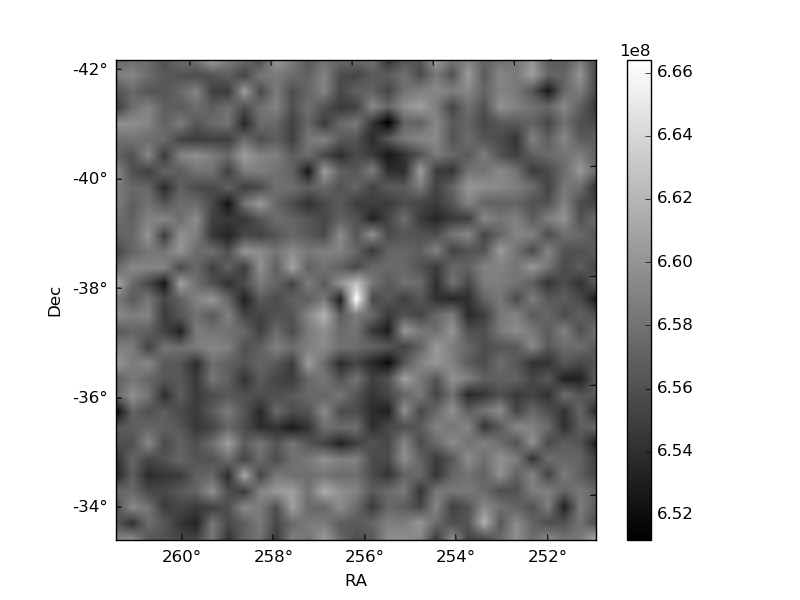
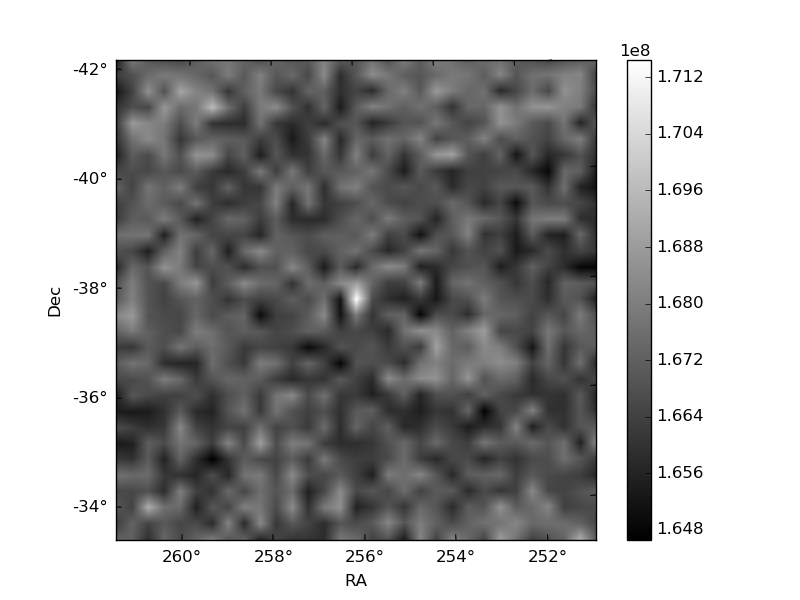
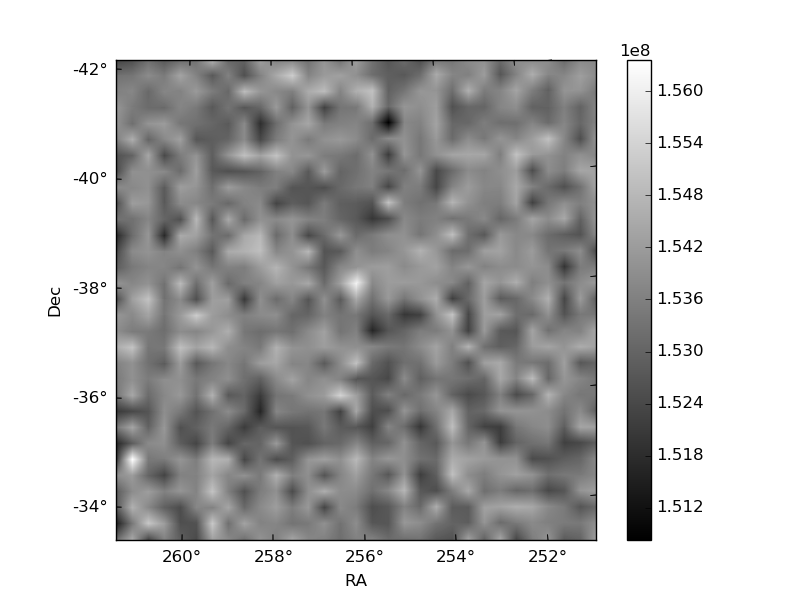
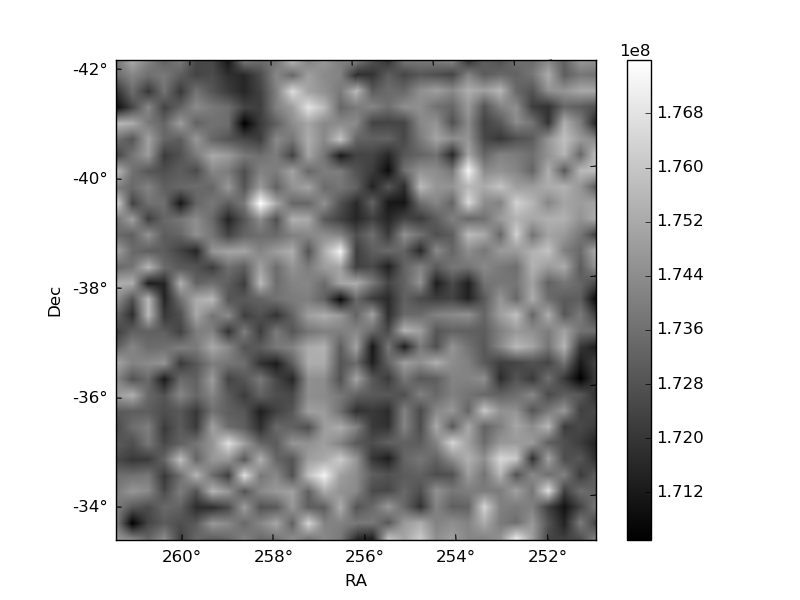
Histogram calculated using DETX and DETY for each event in the final _common_clean file
| Quadrant A | 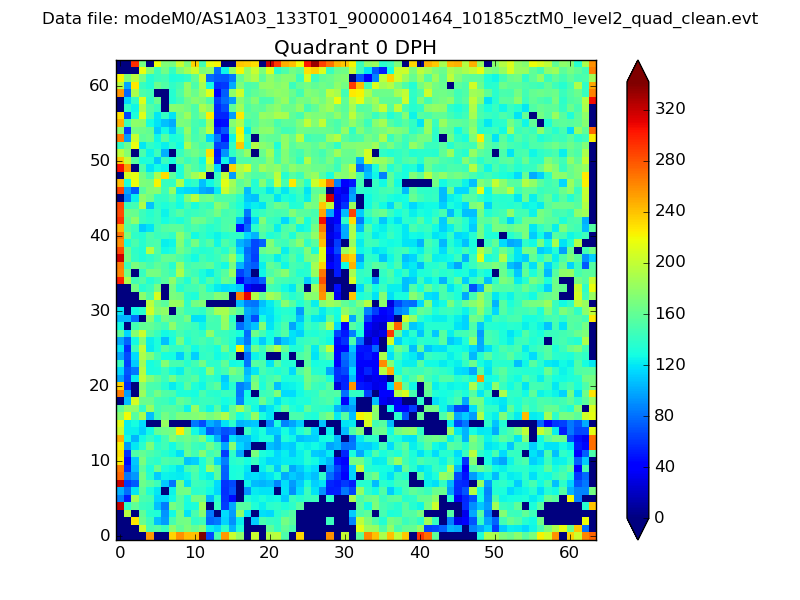 |
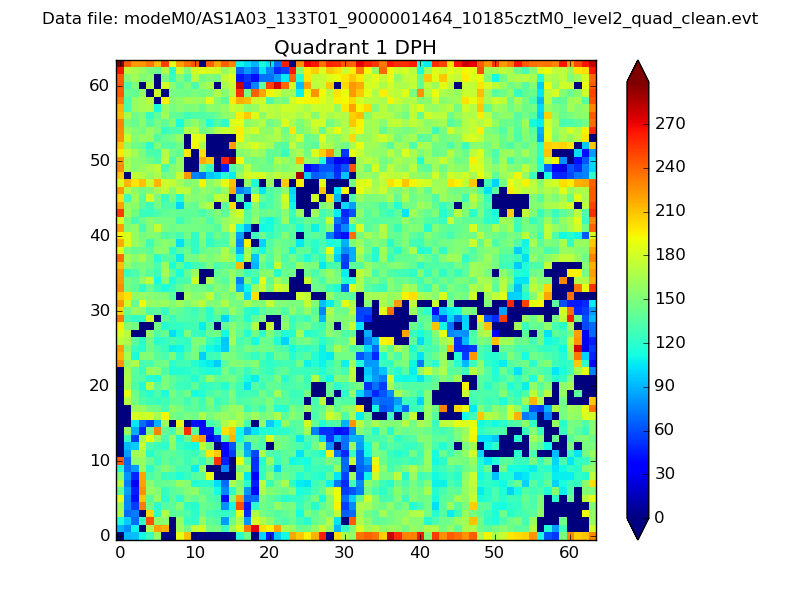 |
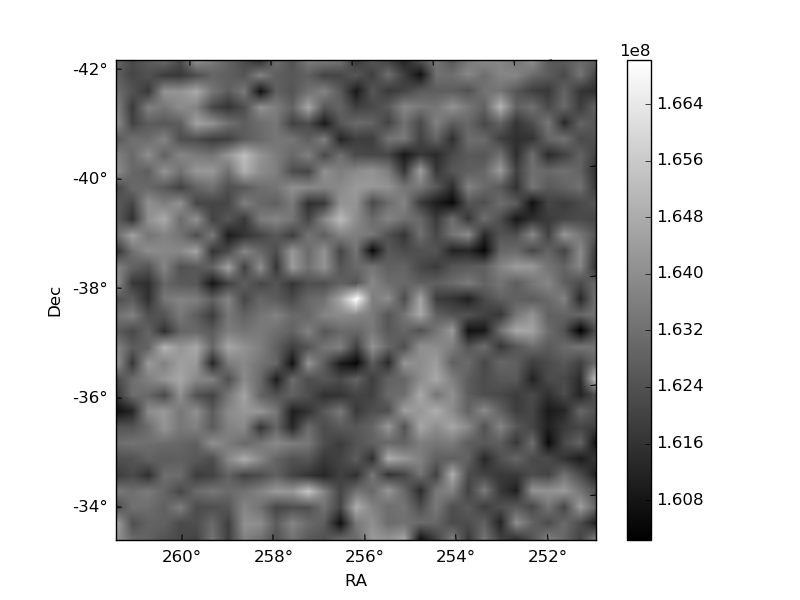
Quadrant B |
|---|---|---|---|
| Quadrant D | 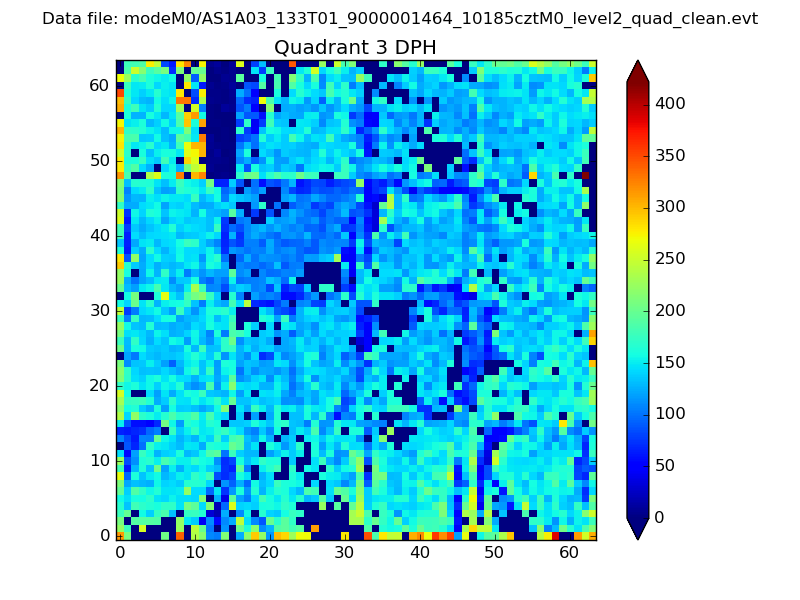 |
 |
Quadrant C |
| Plot type | Count rate plots | Images |
|---|---|---|
| Comparison with Poisson distribution Blue bars denote a histogram of data divided into 1 sec bins. Red curve is a Poisson curve with rate = median count rate of data. |
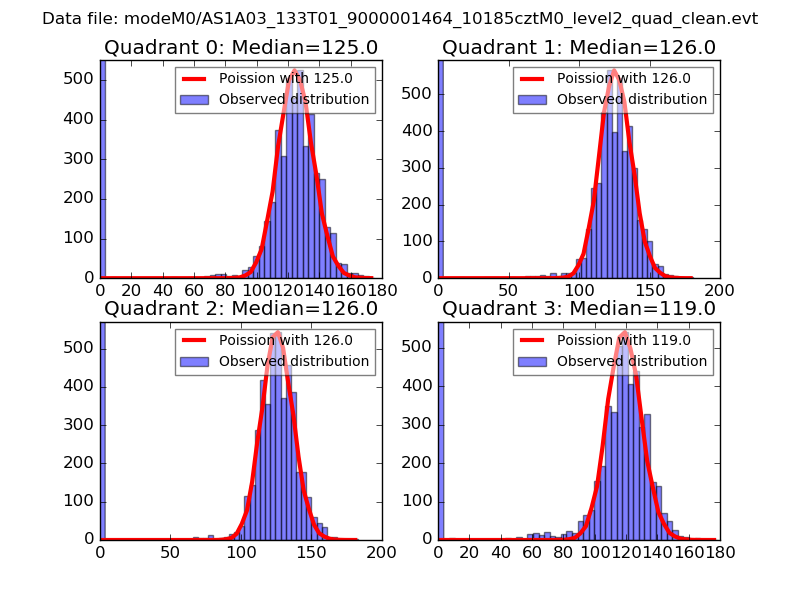 |
 |
| Quadrant-wise count rates Data is divided into 100 sec bins |
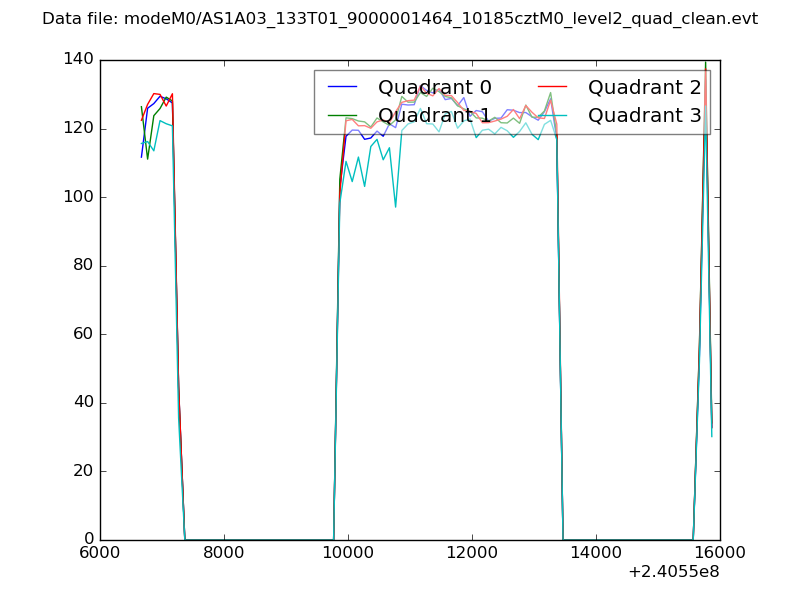 |
|
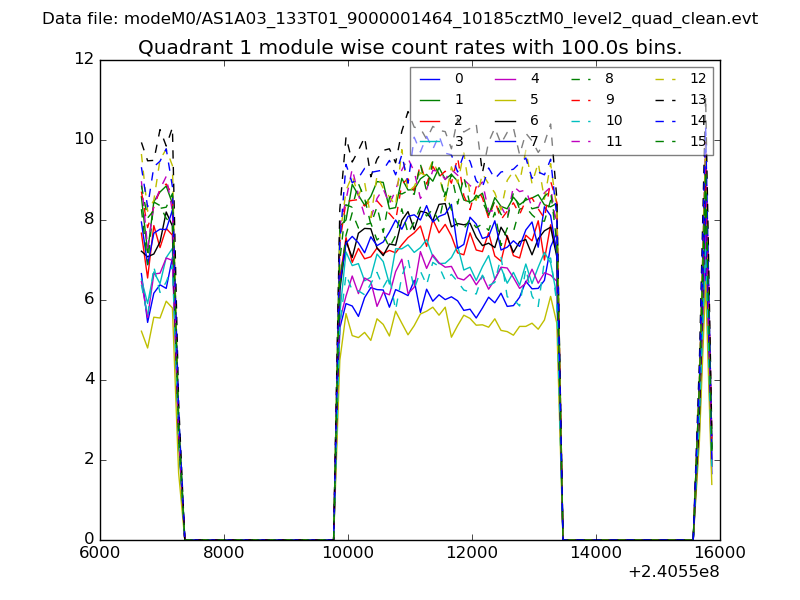
| Module-wise count rates for Quadrant A Data is divided into 100 sec bins |
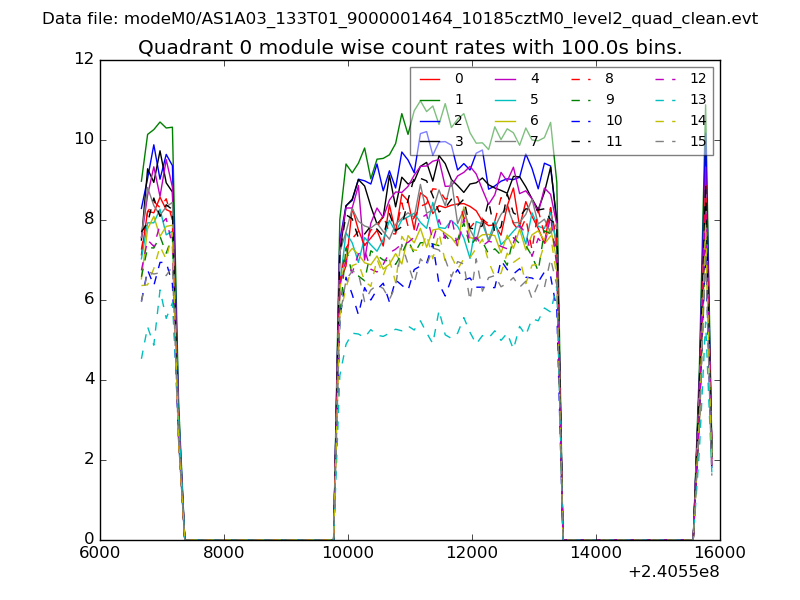 |
 |
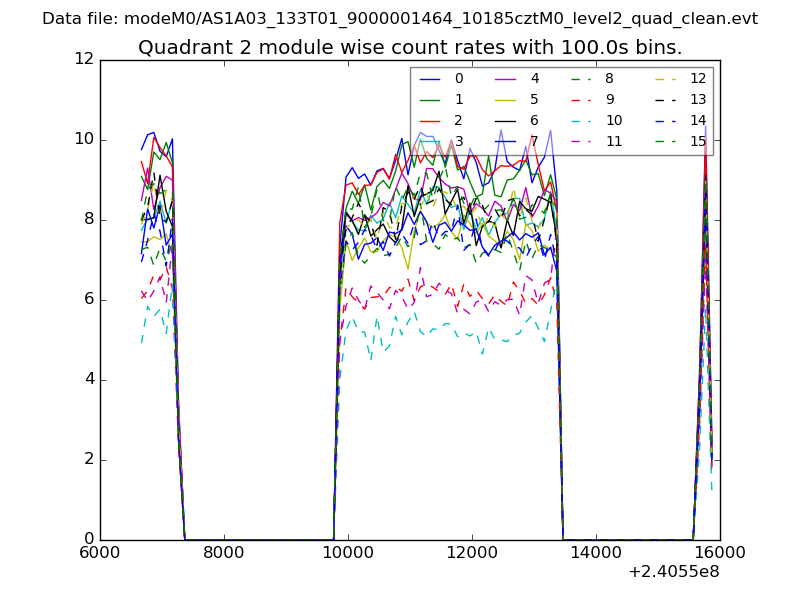
| Module-wise count rates for Quadrant B Data is divided into 100 sec bins |
 |
 |
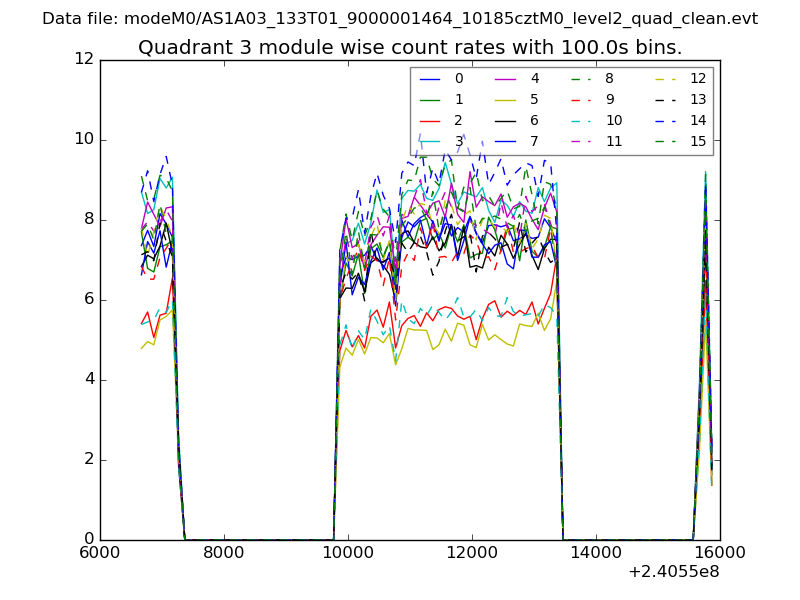
| Module-wise count rates for Quadrant C Data is divided into 100 sec bins |
 |
 |
| Module-wise count rates for Quadrant D Data is divided into 100 sec bins |
 |
 |
| Parameter | Plot |
|---|---|
| CZT HV Monitor | 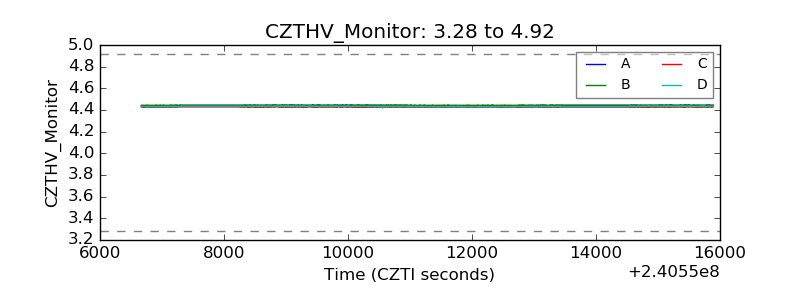 |
| D_VDD | 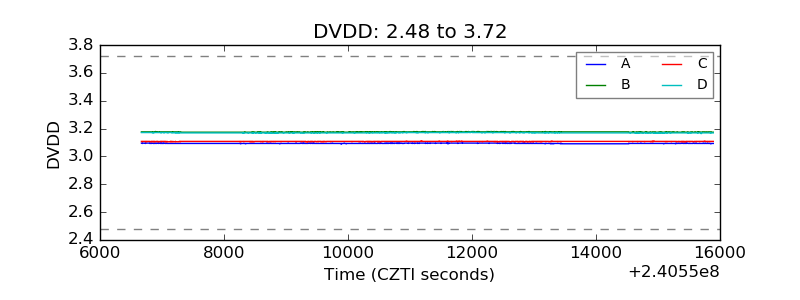 |
| Temperature 1 | 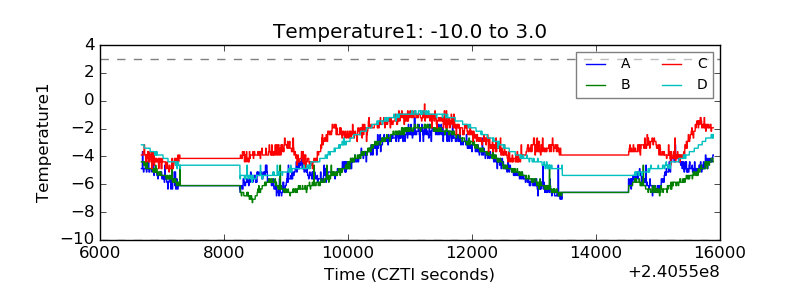 |
| Veto HV Monitor | 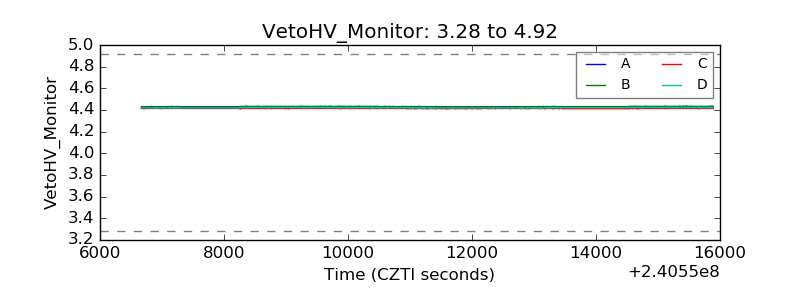 |
| Veto LLD | 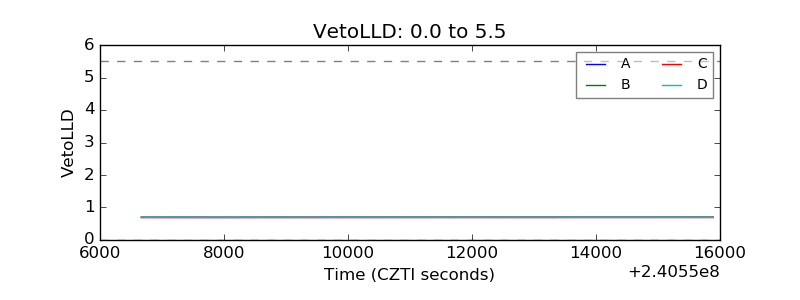 |
| Alpha Counter | 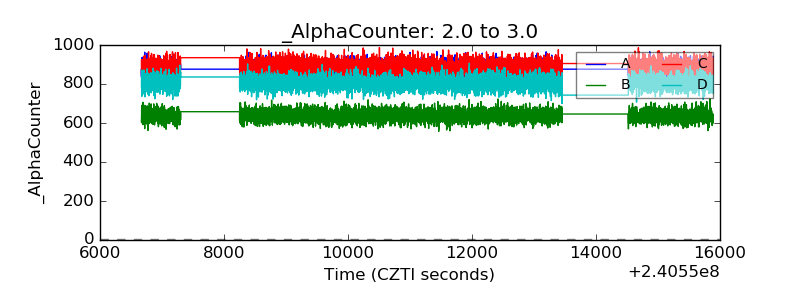 |
| _CPM_Rate | 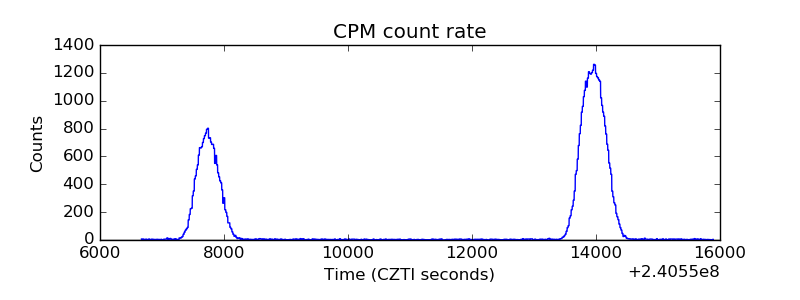 |
| CZT Counter | 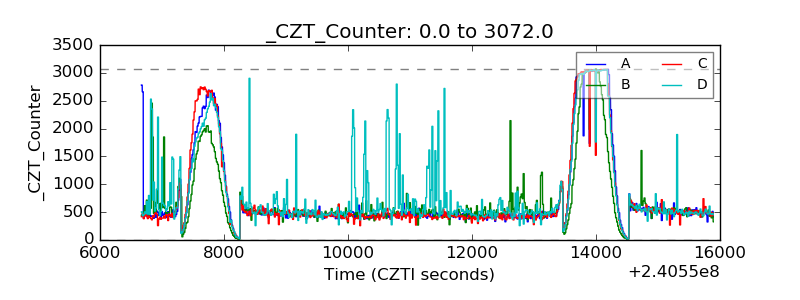 |
| +2.5 Volts monitor |  |
| +5 Volts monitor |  |
| _ROLL_ROT | 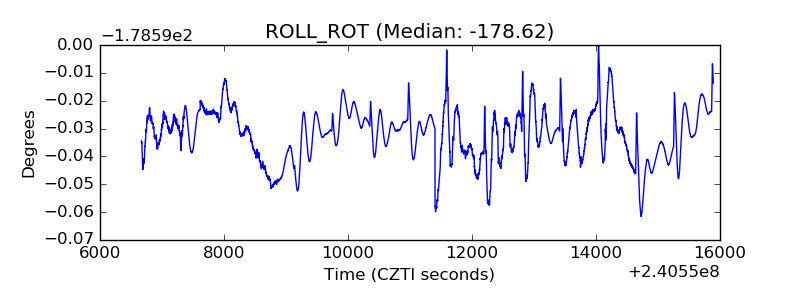 |
| _Roll_DEC | 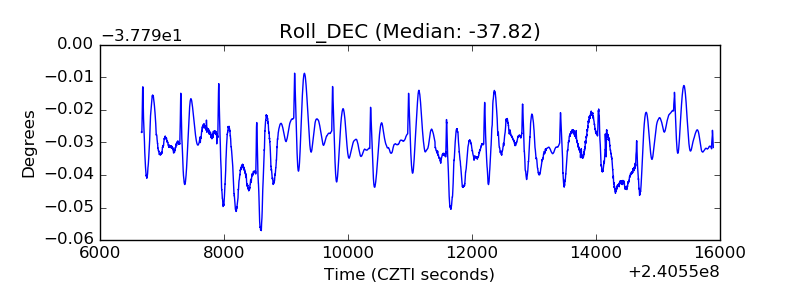 |
| _Roll_RA | 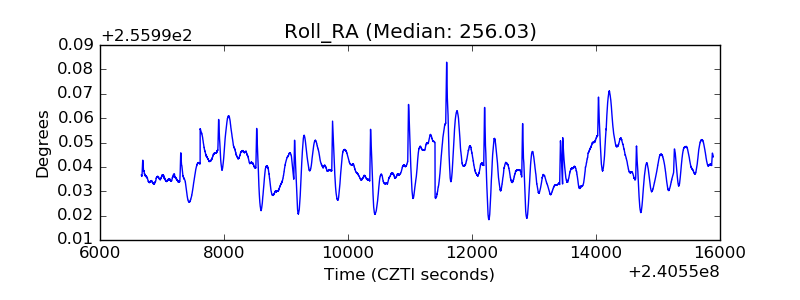 |
| Veto Counter | 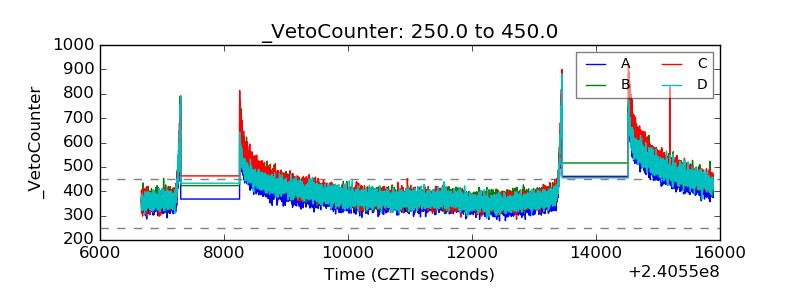 |