| Param | Original file | Final file |
|---|---|---|
| Filename | modeM0/AS1A03_133T01_9000001464_10187cztM0_level2.evt | modeM0/AS1A03_133T01_9000001464_10187cztM0_level2_quad_clean.evt |
| Size (bytes) | 127,961,280 | 17,009,280 |
| Size | 122.0 MB | 16.2 MB |
| Events in quadrant A | 907,064 | 94,618 |
| Events in quadrant B | 932,830 | 90,339 |
| Events in quadrant C | 904,191 | 93,536 |
| Events in quadrant D | 1,004,415 | 102,778 |
| Mode SS | |||
|---|---|---|---|
| Quadrant | BADHDUFLAG | Total packets | Discarded packets |
| A | 0 | 70 | 31 |
| B | 0 | 70 | 33 |
| C | 0 | 70 | 33 |
| D | 0 | 69 | 30 |
| Mode M0 | |||
|---|---|---|---|
| Quadrant | BADHDUFLAG | Total packets | Discarded packets |
| A | 0 | 7181 | 3472 |
| B | 0 | 7808 | 4065 |
| C | 0 | 7457 | 3740 |
| D | 0 | 7473 | 3363 |
| Mode M9 | |||
|---|---|---|---|
| Quadrant | BADHDUFLAG | Total packets | Discarded packets |
| A | 0 | 4 | 0 |
| B | 0 | 4 | 0 |
| C | 0 | 4 | 0 |
| D | 0 | 5 | 0 |
| Quadrant | Total seconds | Saturated seconds | Saturation percentage |
|---|---|---|---|
| A | 1788 | 12 | 0.671141% |
| B | 1748 | 19 | 1.086957% |
| C | 1786 | 6 | 0.335946% |
| D | 1958 | 6 | 0.306435% |
Noise dominated data is calculated using 1-second bins in cleaned event files. If a bin has >2000 counts, and if more than 50% of those come from <1% of pixels, then it is considered to be noise-dominated and hence unusable.
| Quadrant | # 1 sec bins | Bins with >0 counts | Bins with >2000 counts | High rate bins dominated by noise | Noise dominated (total time) | Noise dominated (detector-on time) | Marked lightcurve |
|---|---|---|---|---|---|---|---|
| A | 2070 | 2026 | 0 | 0 | 0.00% | 0.00% | 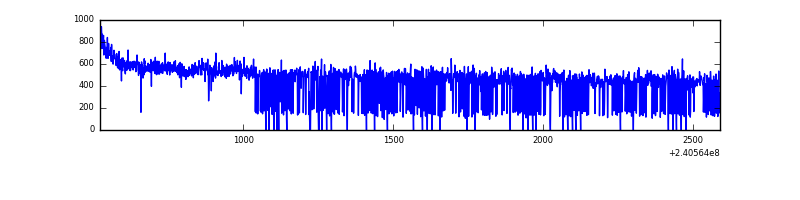 |
| B | 2070 | 1994 | 1 | 1 | 0.05% | 0.05% | 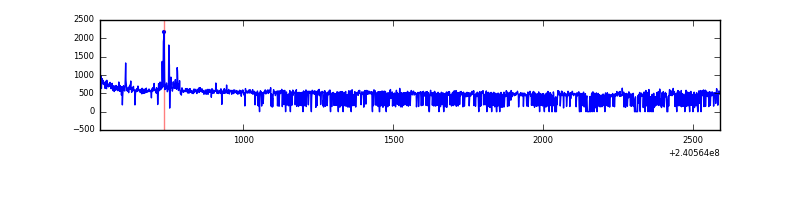 |
| C | 2070 | 2012 | 0 | 0 | 0.00% | 0.00% | 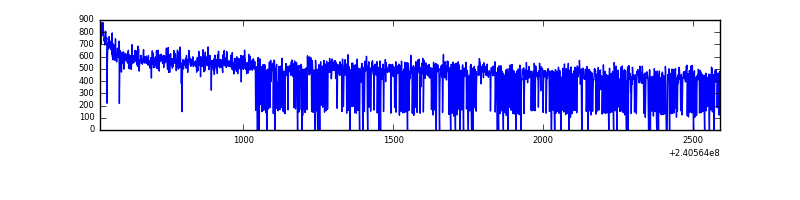 |
| D | 2070 | 2024 | 0 | 0 | 0.00% | 0.00% | 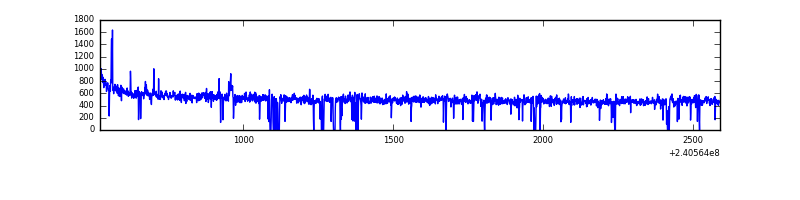 |
Top three noisy pixels from each quadrant. If the there are fewer than three noisy pixels in the level2.evt file, extra rows are filled as -1
| Pixel properties | Quadrant properties | ||||||
|---|---|---|---|---|---|---|---|
| Quadrant | DetID | PixID | Counts | Sigma | Mean | Median | Sigma |
| A | 3 | 1 | 2161 | 39.78 | 234 | 229 | 48.6 |
| A | 0 | 226 | 2114 | 38.82 | 234 | 229 | 48.6 |
| A | 12 | 194 | 1941 | 35.25 | 234 | 229 | 48.6 |
| B | 4 | 239 | 22236 | 491.6 | 229 | 223 | 44.8 |
| B | 0 | 214 | 7759 | 168.3 | 229 | 223 | 44.8 |
| B | 0 | 219 | 7113 | 153.87 | 229 | 223 | 44.8 |
| C | 14 | 67 | 4902 | 86.91 | 230 | 231 | 53.7 |
| C | 13 | 61 | 1699 | 27.31 | 230 | 231 | 53.7 |
| C | 3 | 202 | 573 | 6.36 | 230 | 231 | 53.7 |
| D | 1 | 52 | 24851 | 372.85 | 247 | 241 | 66.0 |
| D | 8 | 195 | 21647 | 324.31 | 247 | 241 | 66.0 |
| D | 2 | 234 | 6077 | 88.42 | 247 | 241 | 66.0 |
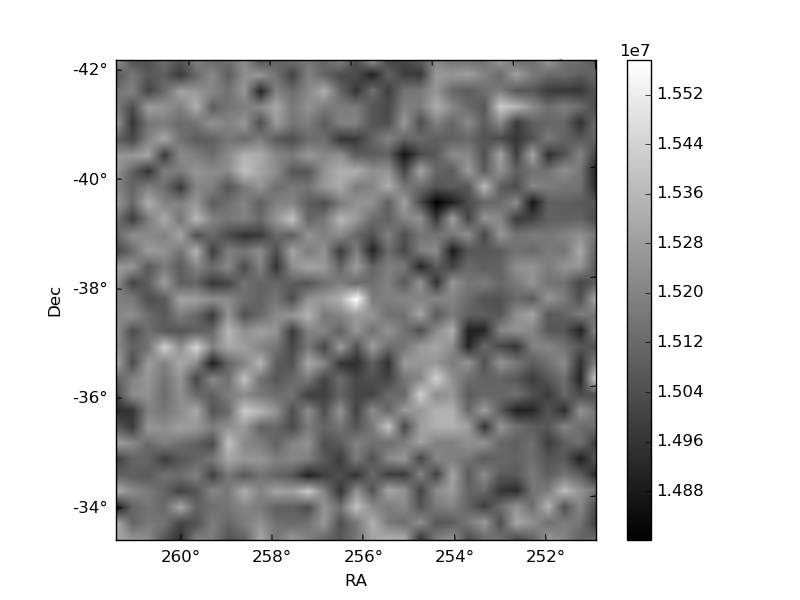
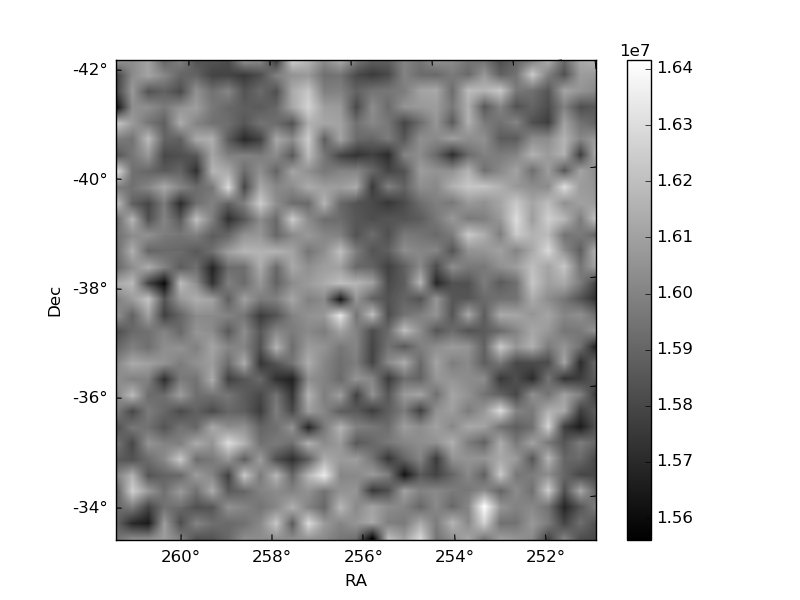
Histogram calculated using DETX and DETY for each event in the final _common_clean file
| Quadrant A | 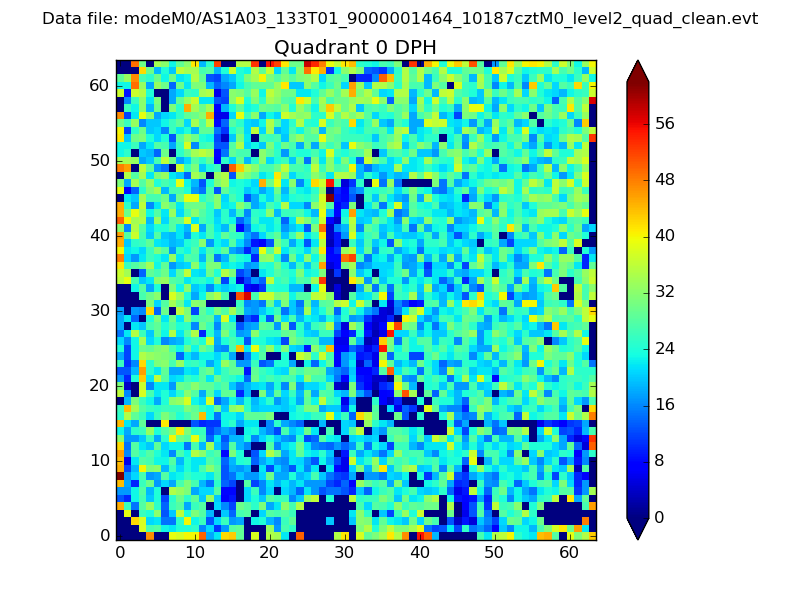 |
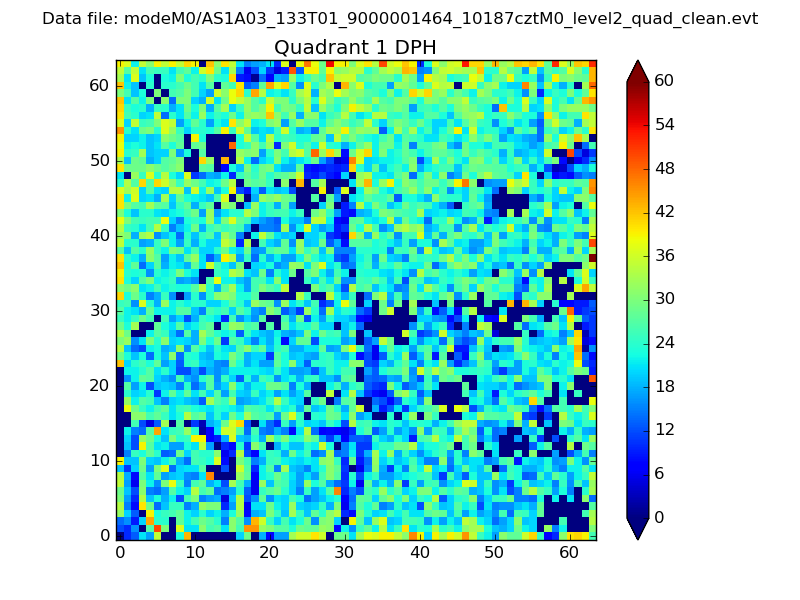 |
Quadrant B |
|---|---|---|---|
| Quadrant D | 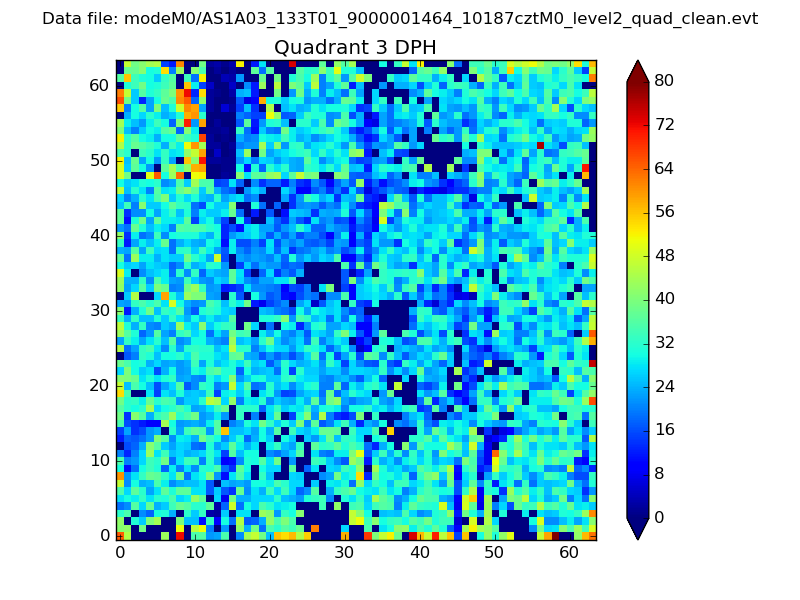 |
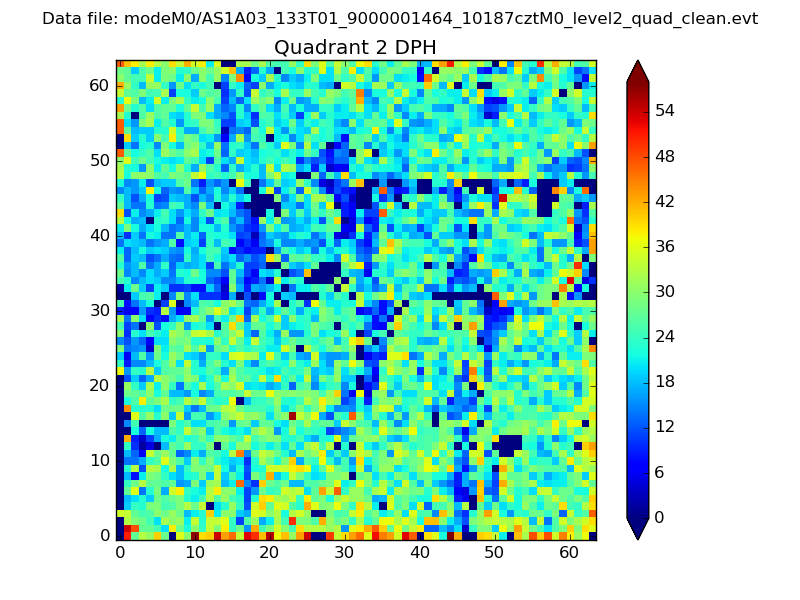 |
Quadrant C |
| Plot type | Count rate plots | Images |
|---|---|---|
| Comparison with Poisson distribution Blue bars denote a histogram of data divided into 1 sec bins. Red curve is a Poisson curve with rate = median count rate of data. |
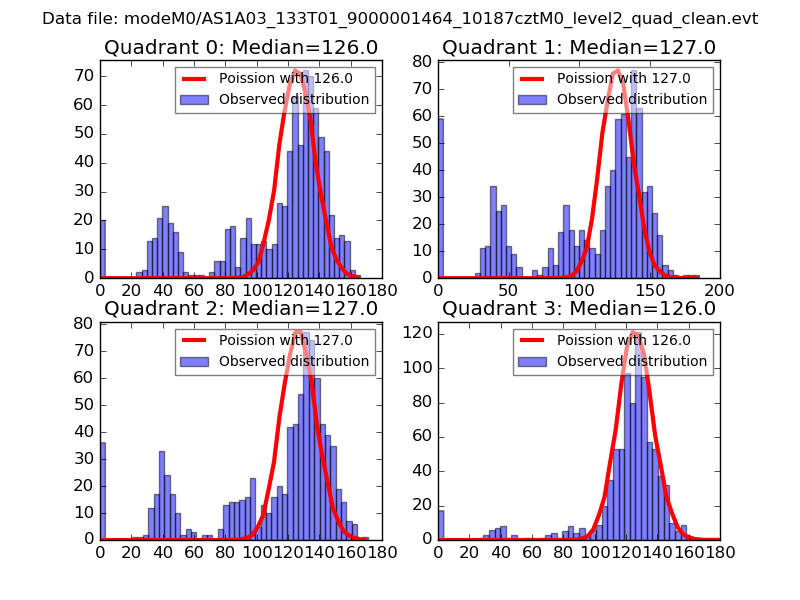 |
 |
| Quadrant-wise count rates Data is divided into 100 sec bins |
 |
|
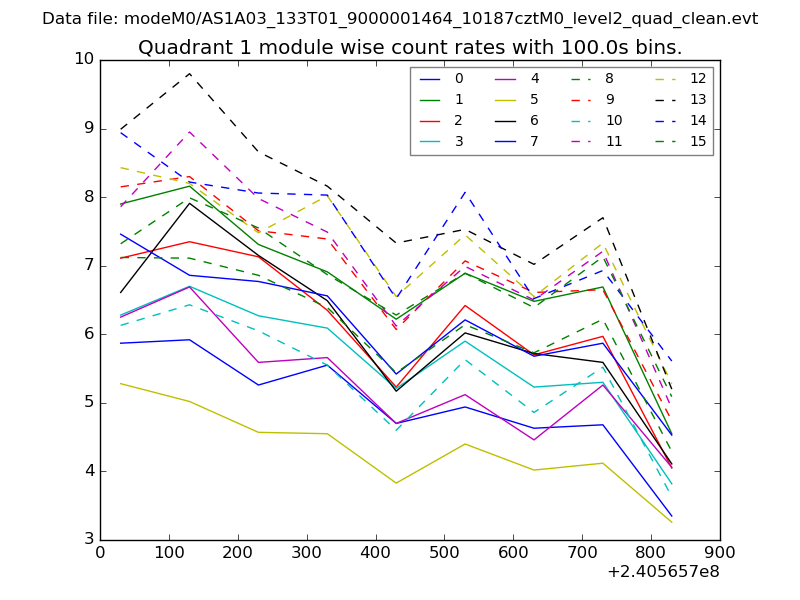
| Module-wise count rates for Quadrant A Data is divided into 100 sec bins |
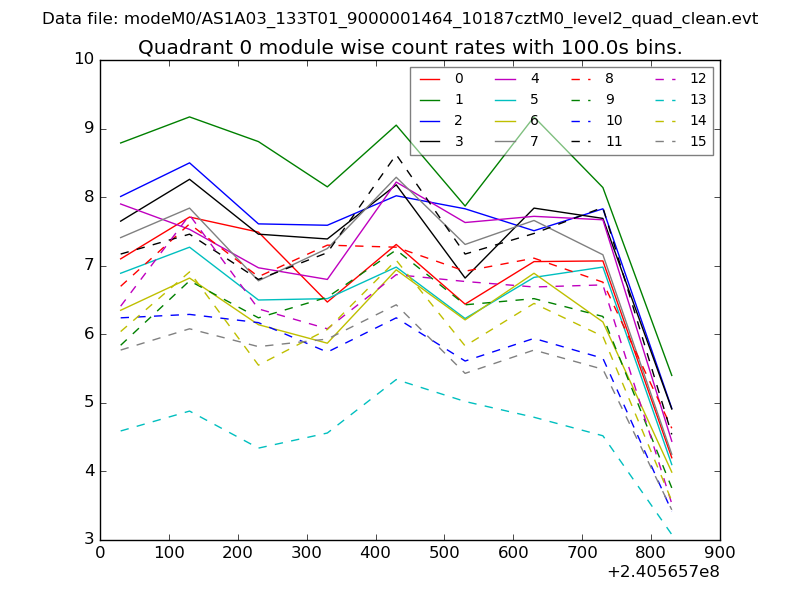 |
 |
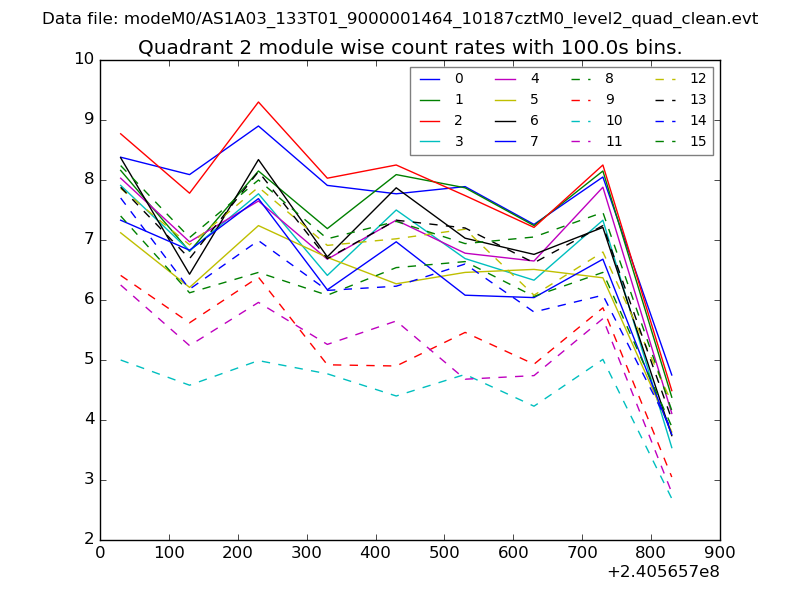
| Module-wise count rates for Quadrant B Data is divided into 100 sec bins |
 |
 |
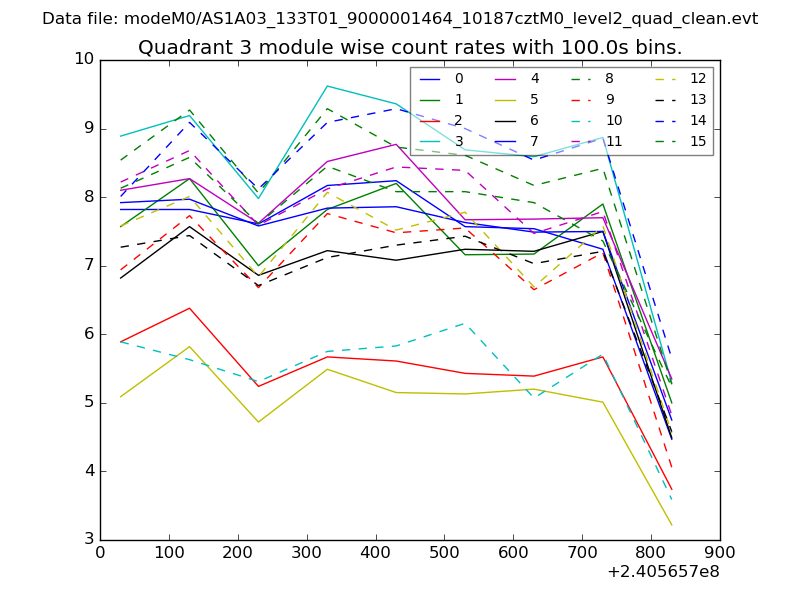
| Module-wise count rates for Quadrant C Data is divided into 100 sec bins |
 |
 |
| Module-wise count rates for Quadrant D Data is divided into 100 sec bins |
 |
 |
| Parameter | Plot |
|---|---|
| CZT HV Monitor | 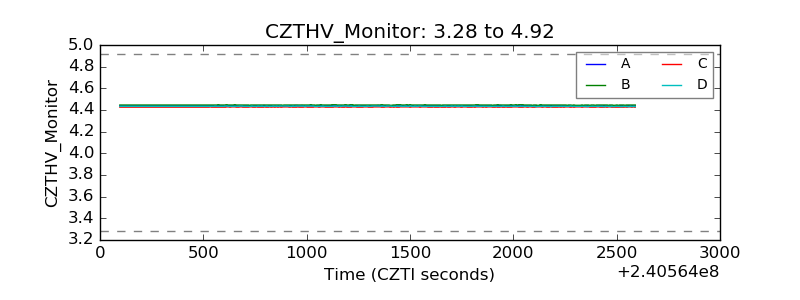 |
| D_VDD | 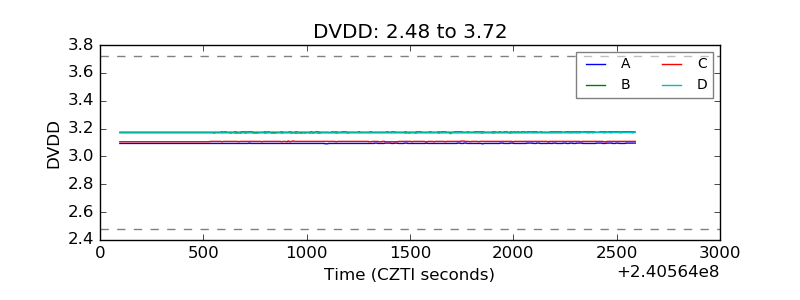 |
| Temperature 1 | 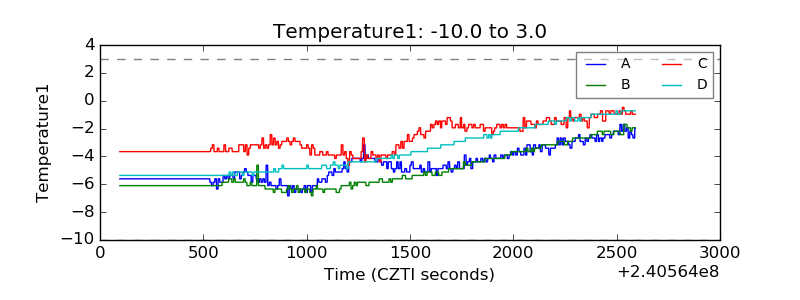 |
| Veto HV Monitor | 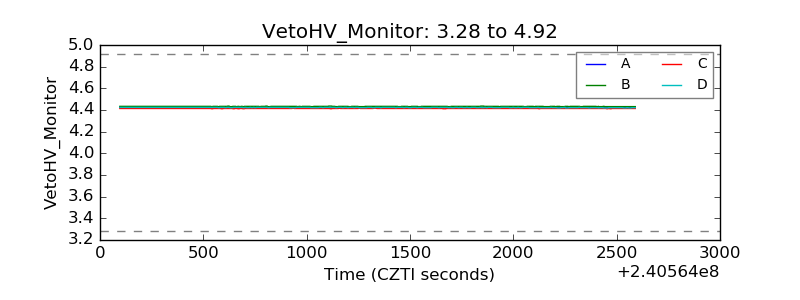 |
| Veto LLD | 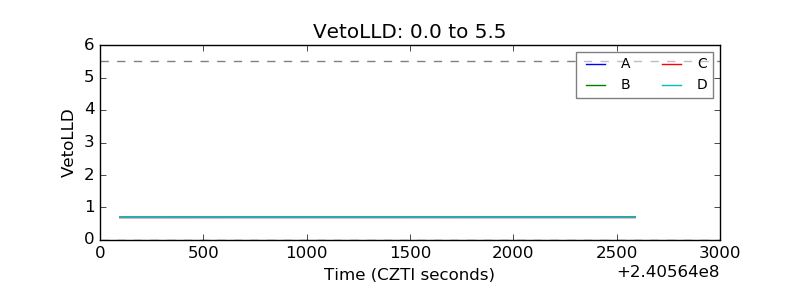 |
| Alpha Counter | 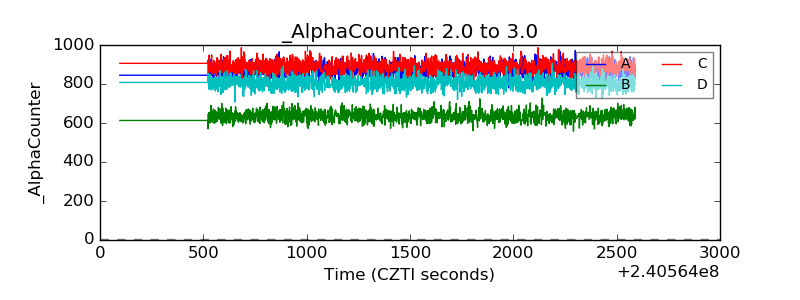 |
| _CPM_Rate | 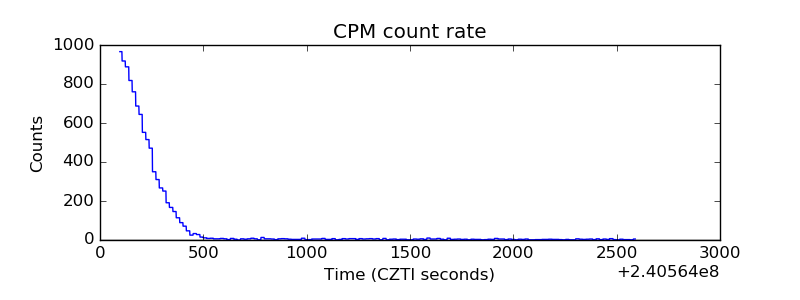 |
| CZT Counter | 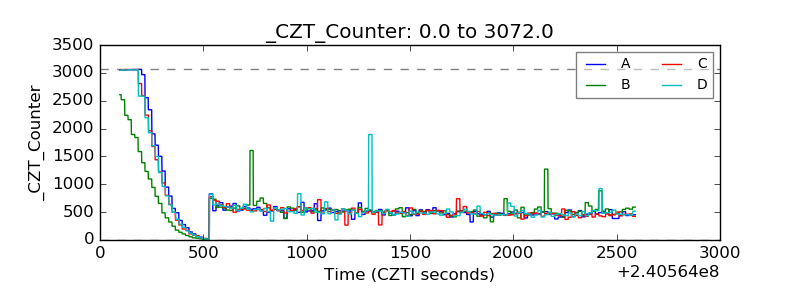 |
| +2.5 Volts monitor |  |
| +5 Volts monitor |  |
| _ROLL_ROT | 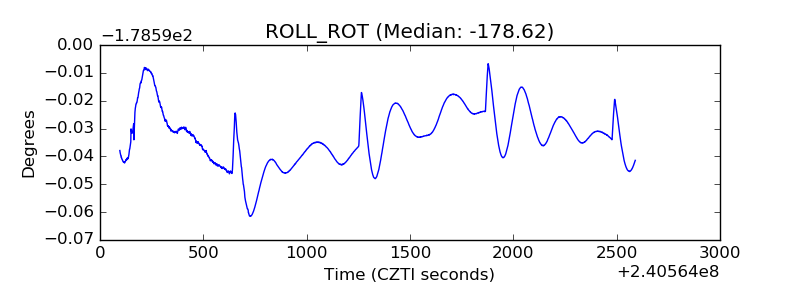 |
| _Roll_DEC |  |
| _Roll_RA | 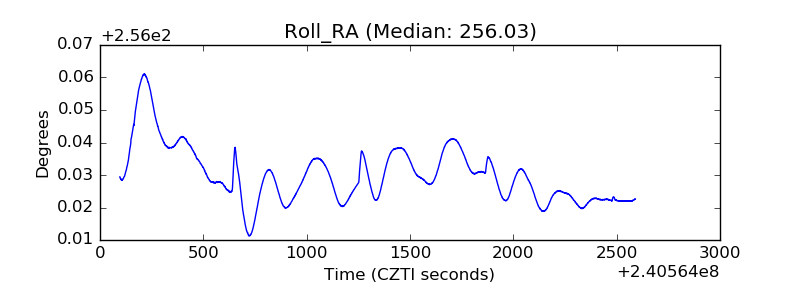 |
| Veto Counter | 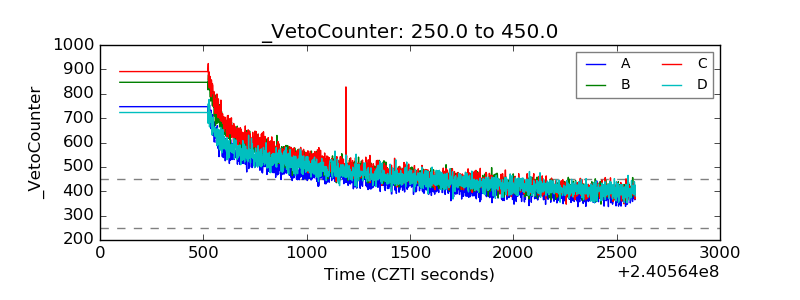 |