| Param | Original file | Final file |
|---|---|---|
| Filename | modeM0/AS1A03_050T01_9000001468cztM0_level2.fits | modeM0/AS1A03_050T01_9000001468cztM0_level2_quad_clean.evt |
| Size (bytes) | 733,109,760 | 856,641,600 |
| Size | 699.1 MB | 817.0 MB |
| Events in quadrant A | 4,438,650 | 5,322,593 |
| Events in quadrant B | 4,271,824 | 5,332,695 |
| Events in quadrant C | 4,382,508 | 5,241,233 |
| Events in quadrant D | 3,755,134 | 4,695,770 |
| Mode M0 | |||
|---|---|---|---|
| Quadrant | BADHDUFLAG | Total packets | Discarded packets |
| A | 0 | 165724 | 0 |
| B | 0 | 169427 | 0 |
| C | 0 | 159677 | 0 |
| D | 0 | 209869 | 0 |
| Mode M9 | |||
|---|---|---|---|
| Quadrant | BADHDUFLAG | Total packets | Discarded packets |
| A | 0 | 129 | 0 |
| B | 0 | 129 | 0 |
| C | 0 | 129 | 0 |
| D | 0 | 129 | 0 |
| Mode SS | |||
|---|---|---|---|
| Quadrant | BADHDUFLAG | Total packets | Discarded packets |
| A | 0 | 1592 | 0 |
| B | 0 | 1592 | 0 |
| C | 0 | 1592 | 0 |
| D | 0 | 1592 | 0 |
| Quadrant | Total seconds | Saturated seconds | Saturation percentage |
|---|---|---|---|
| A | 78076 | 1198 | 1.534402% |
| B | 78074 | 1036 | 1.326946% |
| C | 78076 | 445 | 0.569957% |
| D | 78076 | 2461 | 3.152057% |
Noise dominated data is calculated using 1-second bins in cleaned event files. If a bin has >2000 counts, and if more than 50% of those come from <1% of pixels, then it is considered to be noise-dominated and hence unusable.
| Quadrant | # 1 sec bins | Bins with >0 counts | Bins with >2000 counts | High rate bins dominated by noise | Noise dominated (total time) | Noise dominated (detector-on time) | Marked lightcurve |
|---|---|---|---|---|---|---|---|
| A | 90315 | 78052 | 0 | 0 | 0.00% | 0.00% |  |
| B | 90315 | 78069 | 0 | 0 | 0.00% | 0.00% |  |
| C | 90315 | 78070 | 0 | 0 | 0.00% | 0.00% | 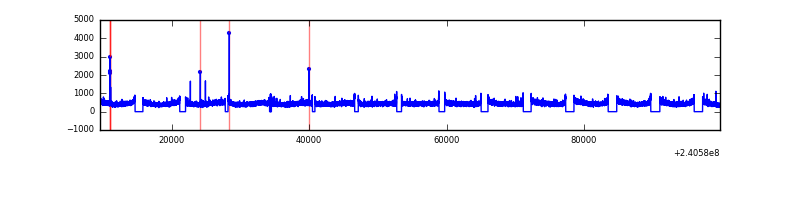 |
| D | 90315 | 78058 | 0 | 0 | 0.00% | 0.00% |  |
Top three noisy pixels from each quadrant. If the there are fewer than three noisy pixels in the level2.evt file, extra rows are filled as -1
| Pixel properties | Quadrant properties | ||||||
|---|---|---|---|---|---|---|---|
| Quadrant | DetID | PixID | Counts | Sigma | Mean | Median | Sigma |
| A | 0 | 29 | 4293 | 11.17 | 1157 | 1086 | 287.2 |
| A | 7 | 110 | 3663 | 8.97 | 1157 | 1086 | 287.2 |
| A | 0 | 30 | 3321 | 7.78 | 1157 | 1086 | 287.2 |
| B | 2 | 9 | 3756 | 12.23 | 1132 | 1086 | 218.4 |
| B | 3 | 17 | 2874 | 8.19 | 1132 | 1086 | 218.4 |
| B | 14 | 254 | 2832 | 8.0 | 1132 | 1086 | 218.4 |
| C | 12 | 241 | 3118 | 6.83 | 1159 | 1083 | 297.9 |
| C | 2 | 191 | 2925 | 6.18 | 1159 | 1083 | 297.9 |
| C | 9 | 188 | 2899 | 6.1 | 1159 | 1083 | 297.9 |
| D | 6 | 231 | 2819 | 6.45 | 1072 | 977 | 285.5 |
| D | 3 | 14 | 2802 | 6.39 | 1072 | 977 | 285.5 |
| D | 10 | 189 | 2697 | 6.02 | 1072 | 977 | 285.5 |
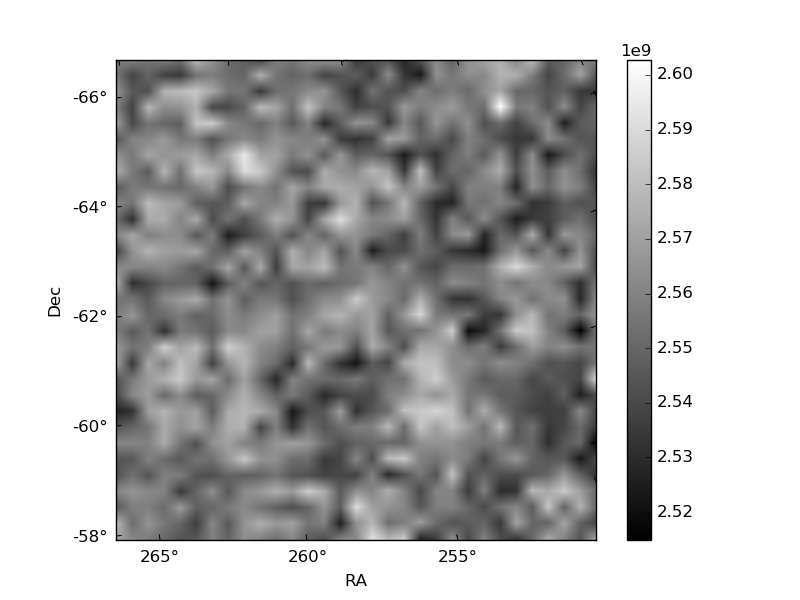
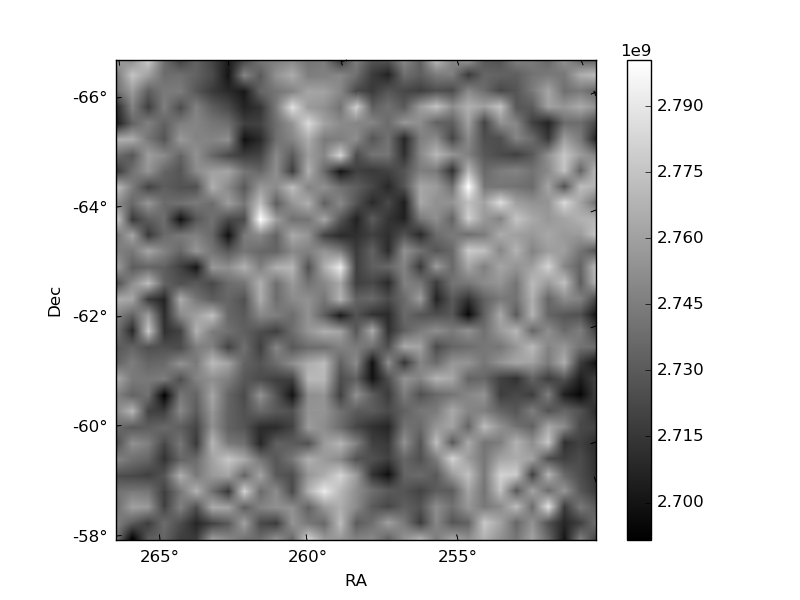
Histogram calculated using DETX and DETY for each event in the final _common_clean file
| Quadrant A | 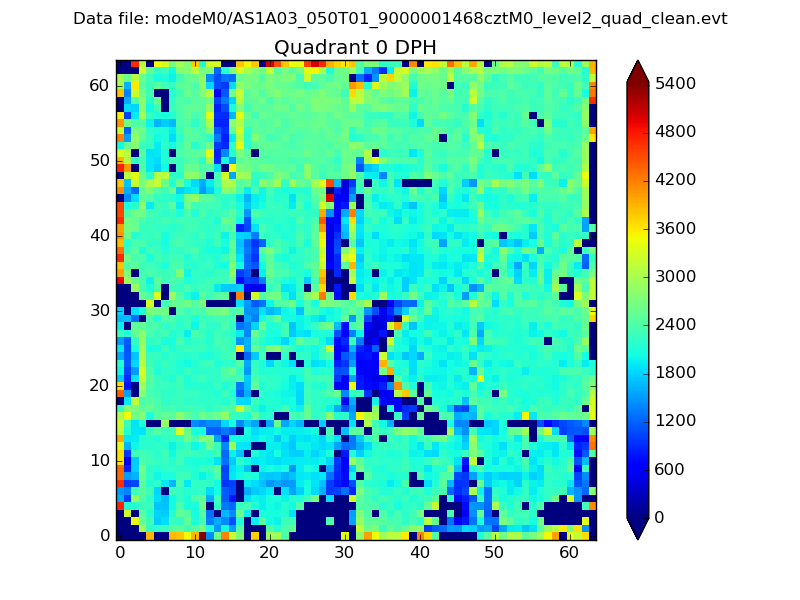 |
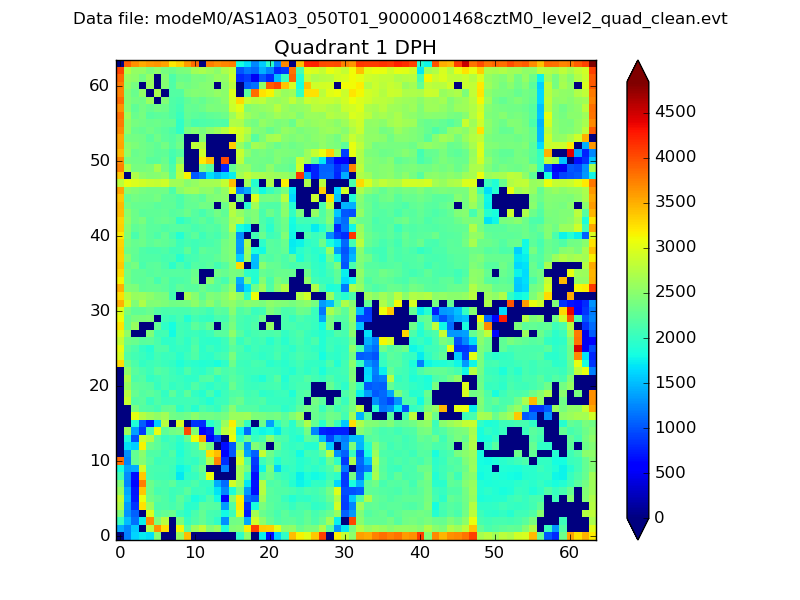 |
Quadrant B |
|---|---|---|---|
| Quadrant D | 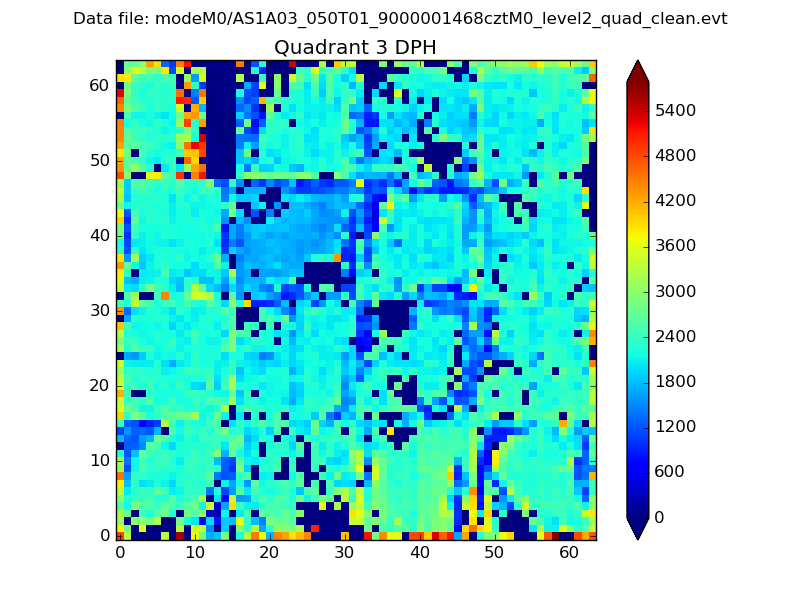 |
 |
Quadrant C |
| Plot type | Count rate plots | Images |
|---|---|---|
| Comparison with Poisson distribution Blue bars denote a histogram of data divided into 1 sec bins. Red curve is a Poisson curve with rate = median count rate of data. |
 |
 |
| Quadrant-wise count rates Data is divided into 100 sec bins |
 |
|
| Module-wise count rates for Quadrant A Data is divided into 100 sec bins |
 |
 |
| Module-wise count rates for Quadrant B Data is divided into 100 sec bins |
 |
 |
| Module-wise count rates for Quadrant C Data is divided into 100 sec bins |
 |
 |
| Module-wise count rates for Quadrant D Data is divided into 100 sec bins |
 |
 |
| Parameter | Plot |
|---|---|
| CZT HV Monitor | 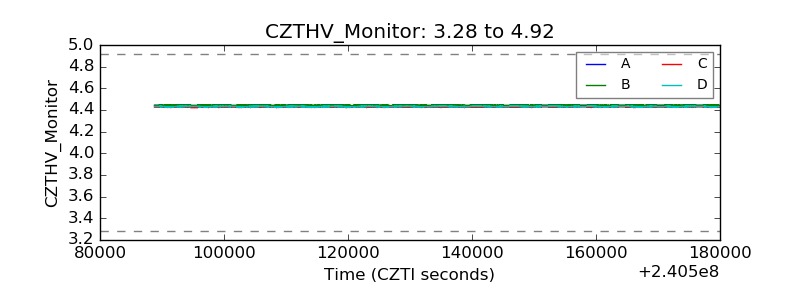 |
| D_VDD | 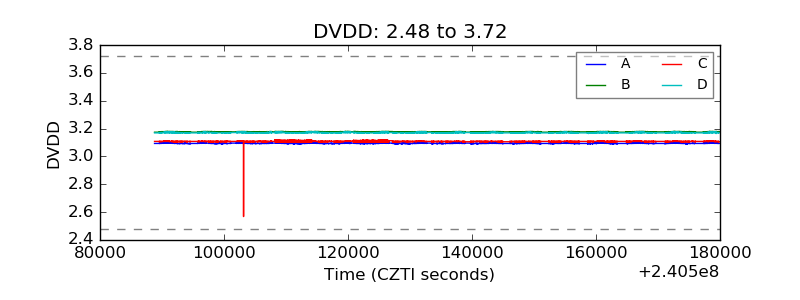 |
| Temperature 1 |  |
| Veto HV Monitor |  |
| Veto LLD |  |
| Alpha Counter |  |
| _CPM_Rate | 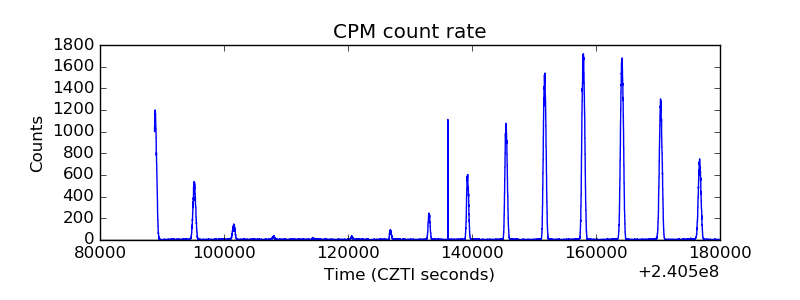 |
| CZT Counter |  |
| +2.5 Volts monitor |  |
| +5 Volts monitor |  |
| _ROLL_ROT |  |
| _Roll_DEC |  |
| _Roll_RA |  |
| Veto Counter |  |