| Param | Original file | Final file |
|---|---|---|
| Filename | modeM0/AS1A03_050T01_9000001468_10190cztM0_level2.evt | modeM0/AS1A03_050T01_9000001468_10190cztM0_level2_quad_clean.evt |
| Size (bytes) | 117,927,360 | 33,523,200 |
| Size | 112.5 MB | 32.0 MB |
| Events in quadrant A | 803,221 | 225,969 |
| Events in quadrant B | 907,330 | 228,533 |
| Events in quadrant C | 786,684 | 227,646 |
| Events in quadrant D | 965,334 | 217,351 |
| Mode M0 | |||
|---|---|---|---|
| Quadrant | BADHDUFLAG | Total packets | Discarded packets |
| A | 0 | 3296 | 2 |
| B | 0 | 3692 | 1 |
| C | 0 | 3278 | 1 |
| D | 0 | 3844 | 1 |
| Mode M9 | |||
|---|---|---|---|
| Quadrant | BADHDUFLAG | Total packets | Discarded packets |
| A | 0 | 8 | 0 |
| B | 0 | 8 | 0 |
| C | 0 | 8 | 0 |
| D | 0 | 8 | 0 |
| Mode SS | |||
|---|---|---|---|
| Quadrant | BADHDUFLAG | Total packets | Discarded packets |
| A | 0 | 30 | 0 |
| B | 0 | 30 | 0 |
| C | 0 | 30 | 0 |
| D | 0 | 30 | 0 |
| Quadrant | Total seconds | Saturated seconds | Saturation percentage |
|---|---|---|---|
| A | 1564 | 13 | 0.831202% |
| B | 1564 | 6 | 0.383632% |
| C | 1564 | 4 | 0.255754% |
| D | 1564 | 19 | 1.214834% |
Noise dominated data is calculated using 1-second bins in cleaned event files. If a bin has >2000 counts, and if more than 50% of those come from <1% of pixels, then it is considered to be noise-dominated and hence unusable.
| Quadrant | # 1 sec bins | Bins with >0 counts | Bins with >2000 counts | High rate bins dominated by noise | Noise dominated (total time) | Noise dominated (detector-on time) | Marked lightcurve |
|---|---|---|---|---|---|---|---|
| A | 1564 | 1564 | 0 | 0 | 0.00% | 0.00% | 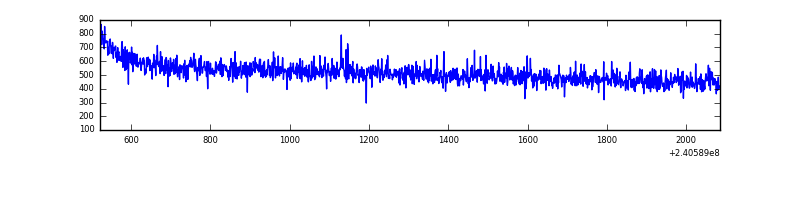 |
| B | 1564 | 1564 | 1 | 1 | 0.06% | 0.06% | 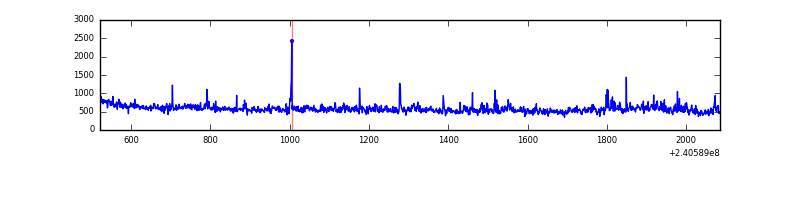 |
| C | 1564 | 1564 | 3 | 3 | 0.19% | 0.19% | 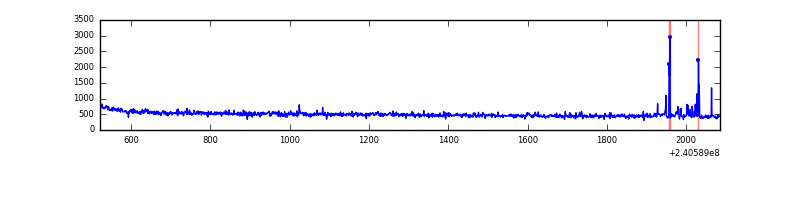 |
| D | 1564 | 1564 | 12 | 12 | 0.77% | 0.77% | 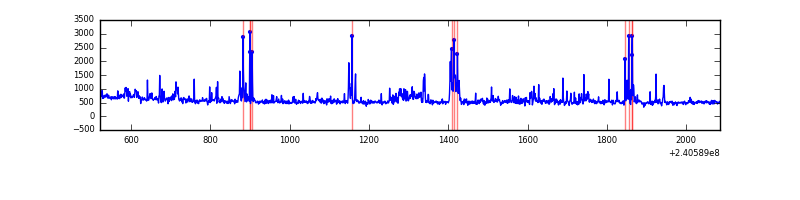 |
Top three noisy pixels from each quadrant. If the there are fewer than three noisy pixels in the level2.evt file, extra rows are filled as -1
| Pixel properties | Quadrant properties | ||||||
|---|---|---|---|---|---|---|---|
| Quadrant | DetID | PixID | Counts | Sigma | Mean | Median | Sigma |
| A | 0 | 226 | 1933 | 39.48 | 207 | 203 | 43.8 |
| A | 13 | 251 | 1922 | 39.23 | 207 | 203 | 43.8 |
| A | 12 | 194 | 1865 | 37.92 | 207 | 203 | 43.8 |
| B | 0 | 189 | 22934 | 566.43 | 204 | 200 | 40.1 |
| B | 5 | 255 | 17117 | 421.5 | 204 | 200 | 40.1 |
| B | 0 | 214 | 14927 | 366.93 | 204 | 200 | 40.1 |
| C | 14 | 234 | 19487 | 418.88 | 195 | 196 | 46.1 |
| C | 14 | 67 | 3065 | 62.3 | 195 | 196 | 46.1 |
| C | 13 | 61 | 1539 | 29.16 | 195 | 196 | 46.1 |
| D | 13 | 104 | 64146 | 1316.21 | 199 | 194 | 48.6 |
| D | 7 | 71 | 48720 | 998.73 | 199 | 194 | 48.6 |
| D | 8 | 195 | 34113 | 698.1 | 199 | 194 | 48.6 |
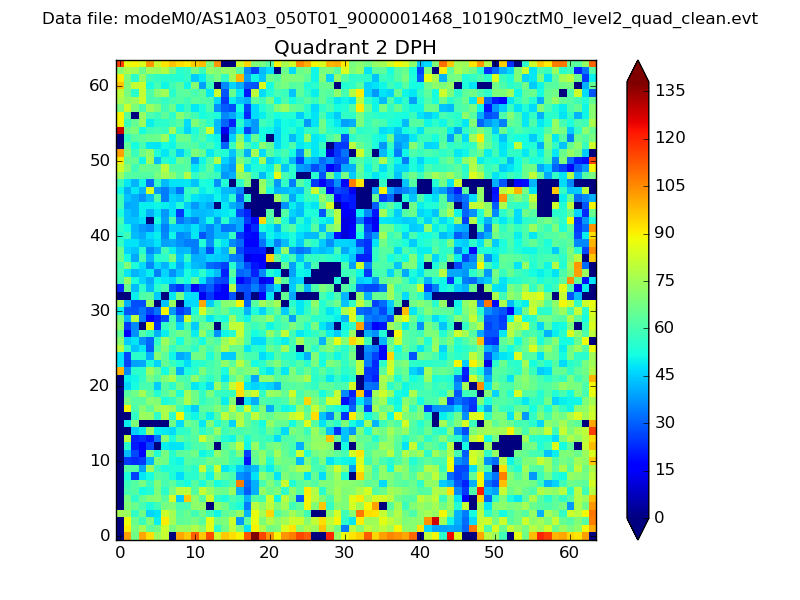
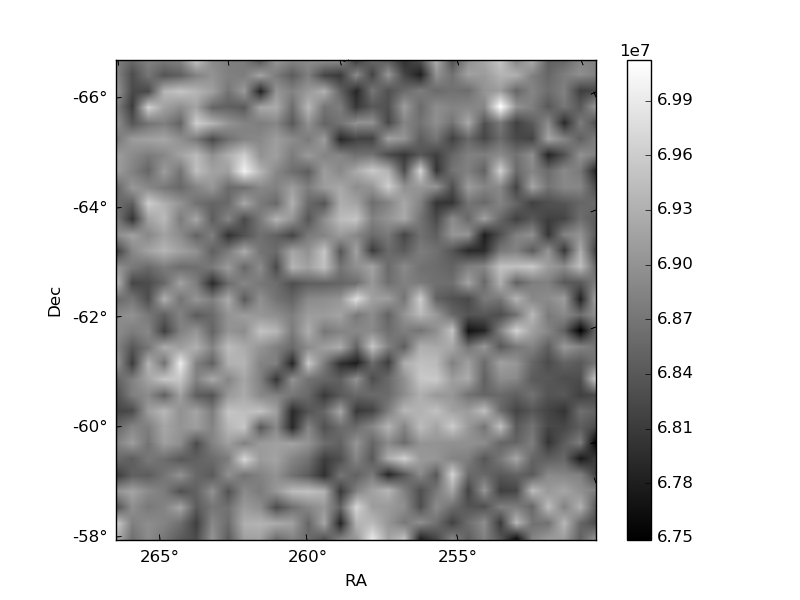
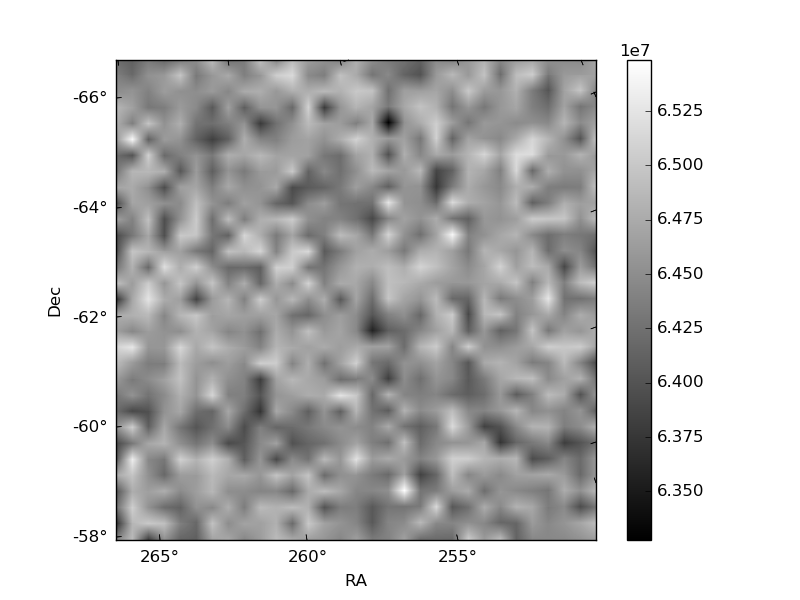
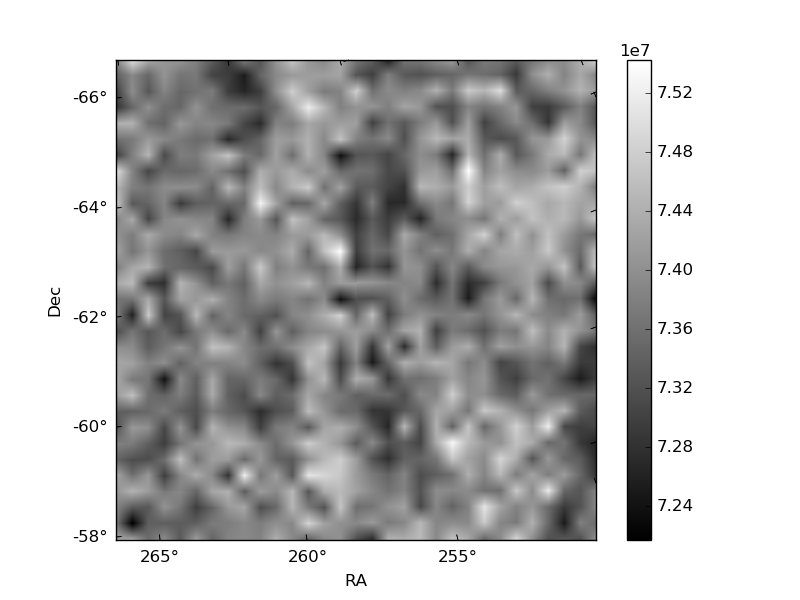
Histogram calculated using DETX and DETY for each event in the final _common_clean file
| Quadrant A | 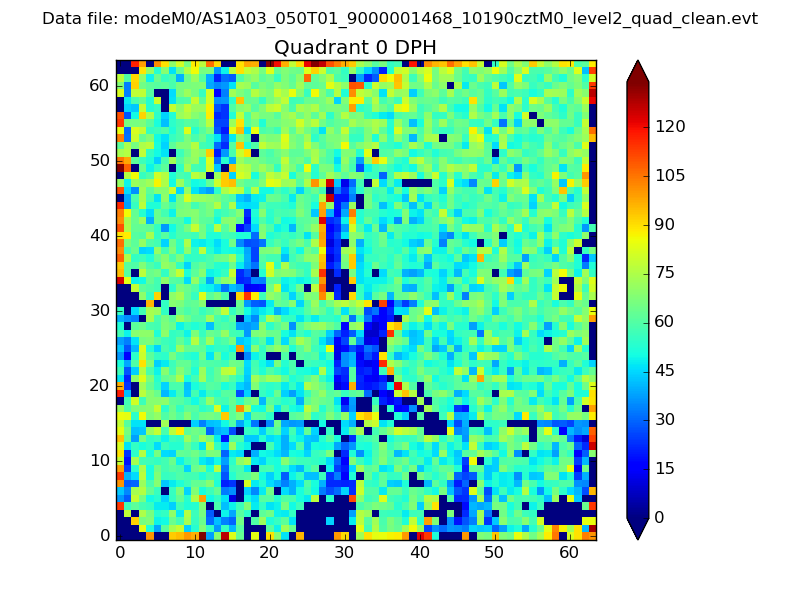 |
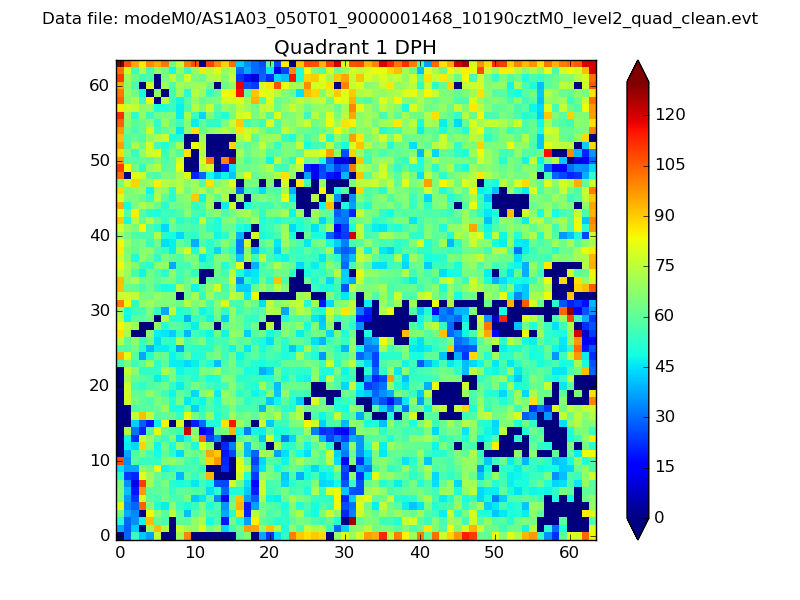 |
Quadrant B |
|---|---|---|---|
| Quadrant D | 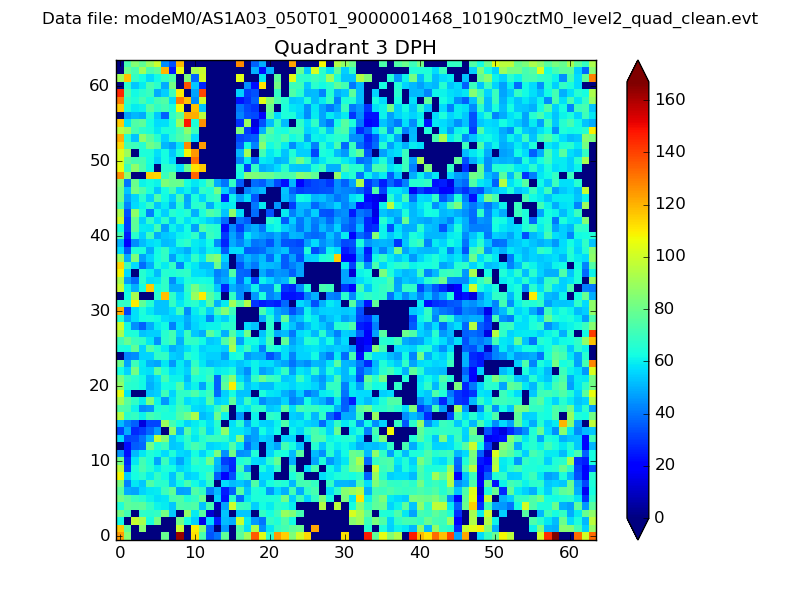 |
 |
Quadrant C |
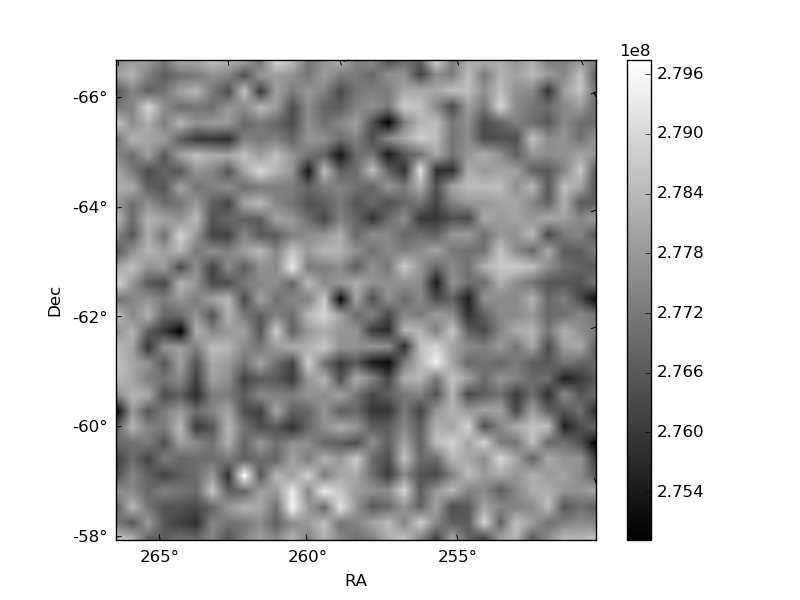
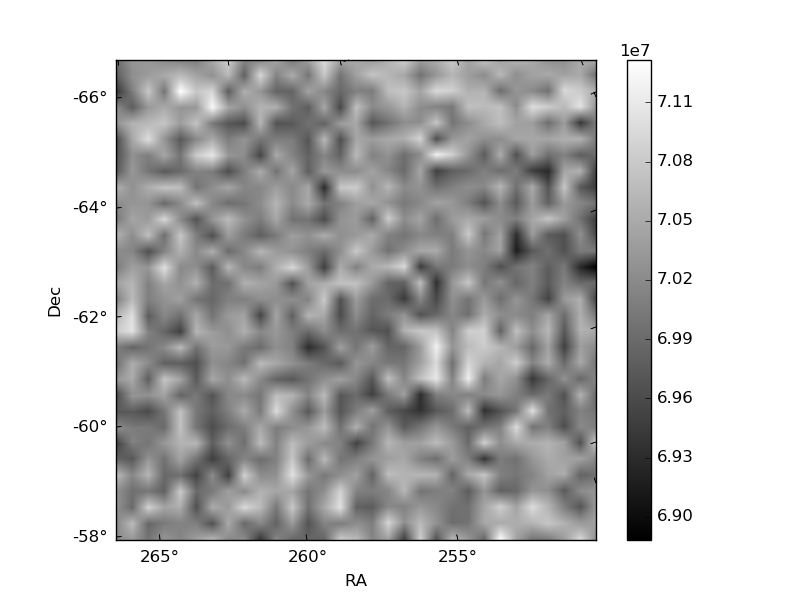
| Plot type | Count rate plots | Images |
|---|---|---|
| Comparison with Poisson distribution Blue bars denote a histogram of data divided into 1 sec bins. Red curve is a Poisson curve with rate = median count rate of data. |
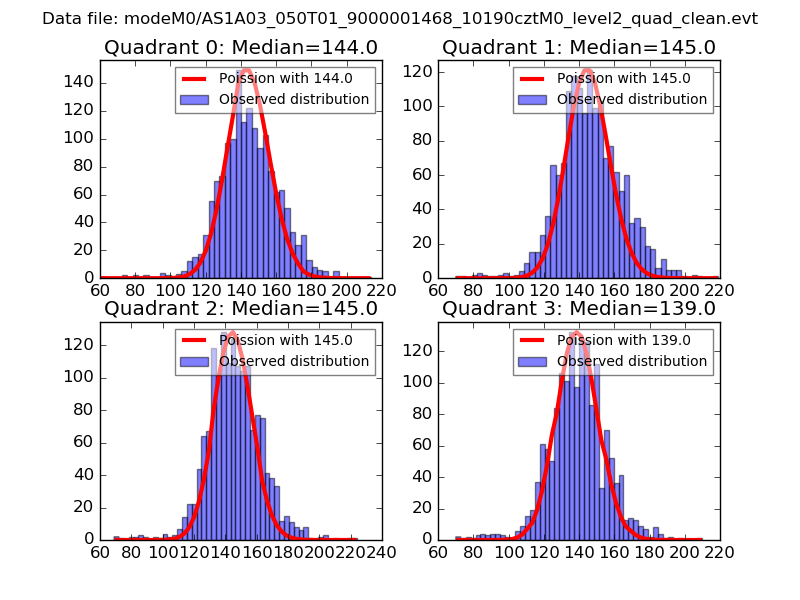 |
 |
| Quadrant-wise count rates Data is divided into 100 sec bins |
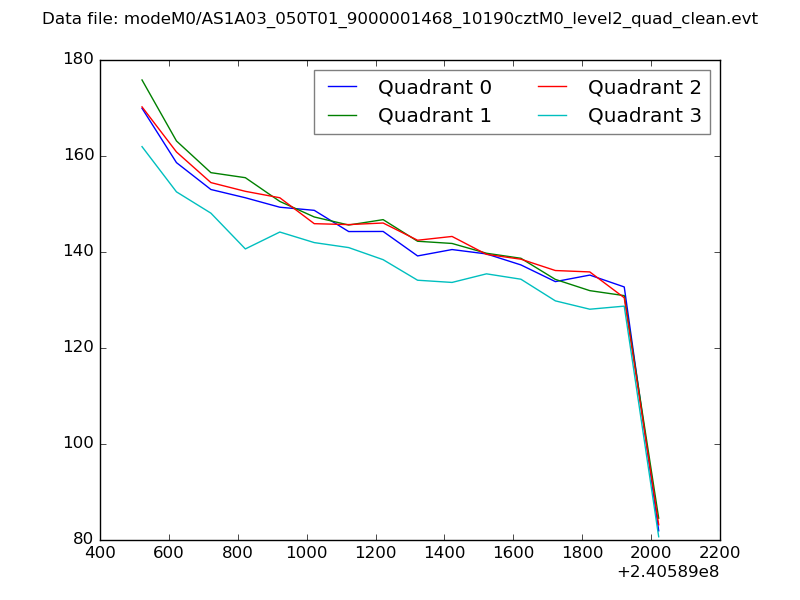 |
|
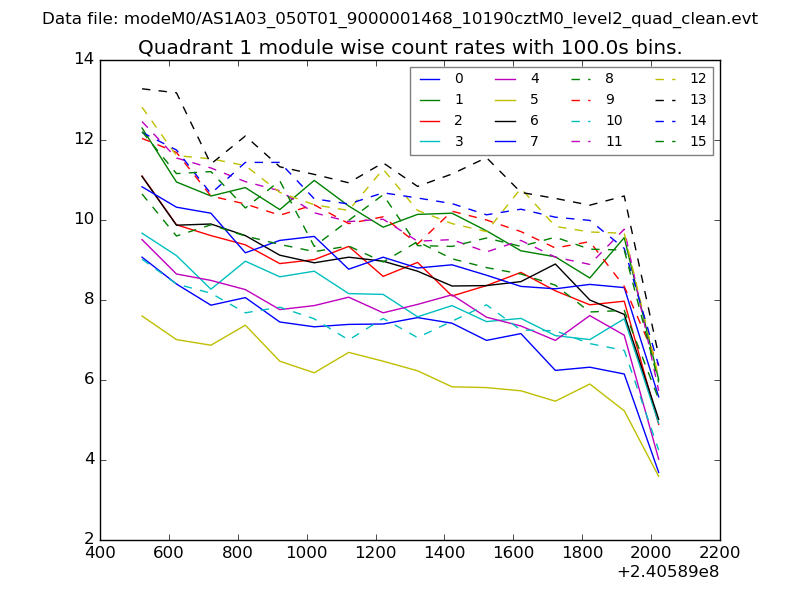
| Module-wise count rates for Quadrant A Data is divided into 100 sec bins |
 |
 |
| Module-wise count rates for Quadrant B Data is divided into 100 sec bins |
 |
 |
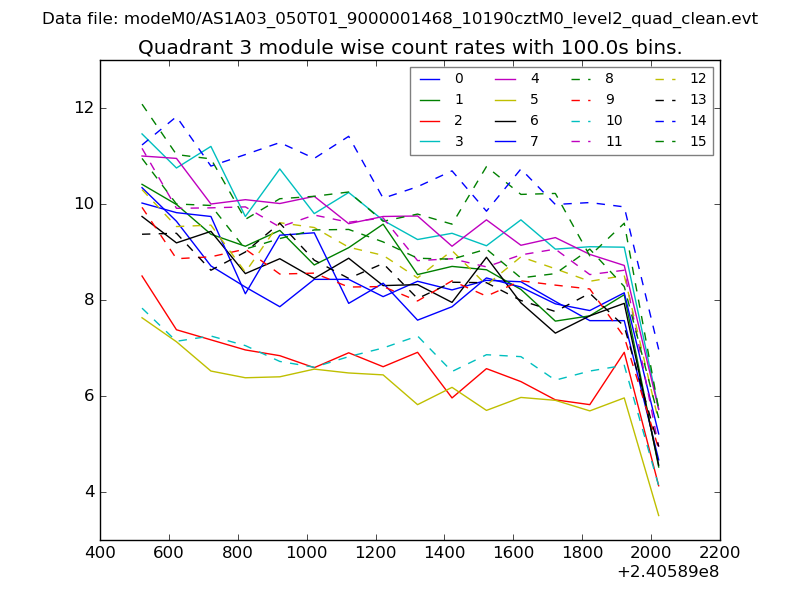
| Module-wise count rates for Quadrant C Data is divided into 100 sec bins |
 |
 |
| Module-wise count rates for Quadrant D Data is divided into 100 sec bins |
 |
 |
| Parameter | Plot |
|---|---|
| CZT HV Monitor | 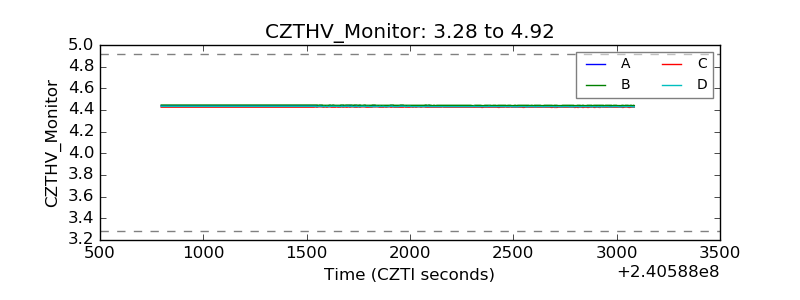 |
| D_VDD | 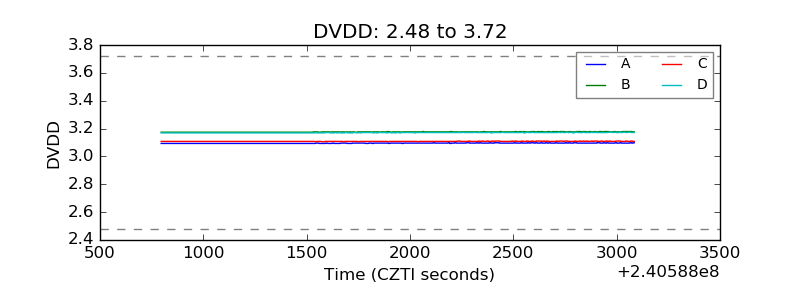 |
| Temperature 1 |  |
| Veto HV Monitor | 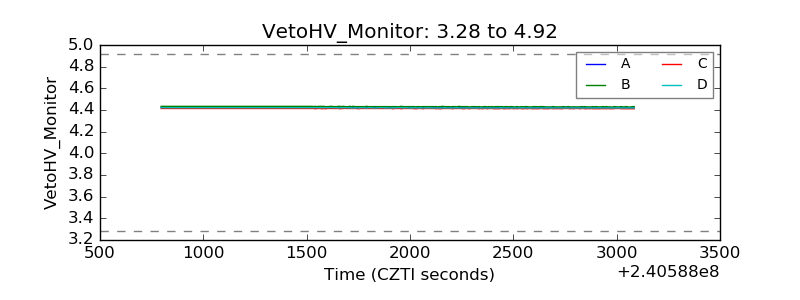 |
| Veto LLD | 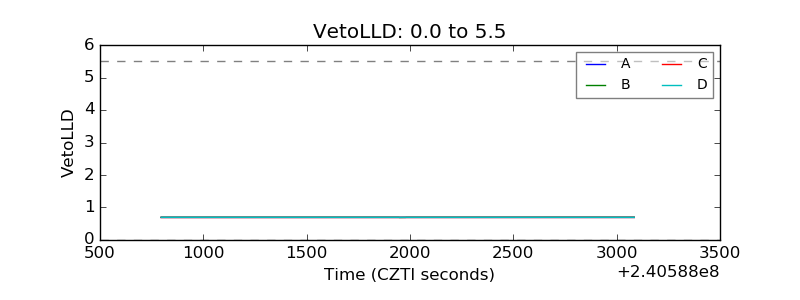 |
| Alpha Counter | 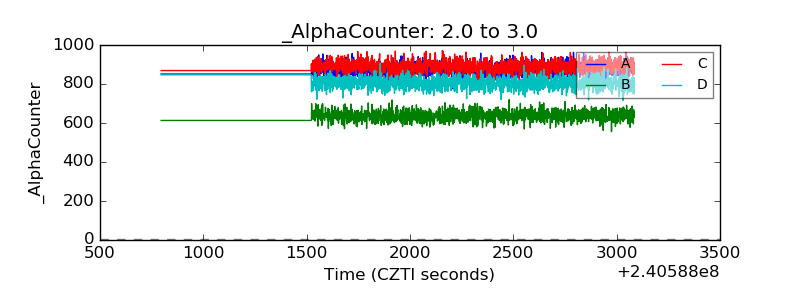 |
| _CPM_Rate | 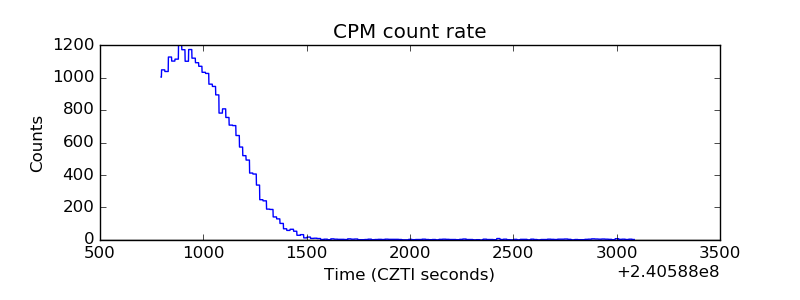 |
| CZT Counter | 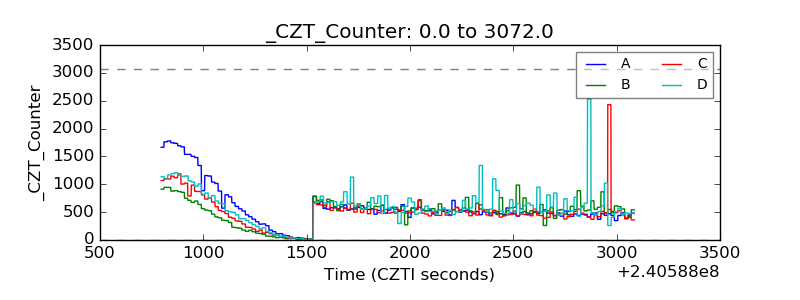 |
| +2.5 Volts monitor |  |
| +5 Volts monitor |  |
| _ROLL_ROT |  |
| _Roll_DEC | 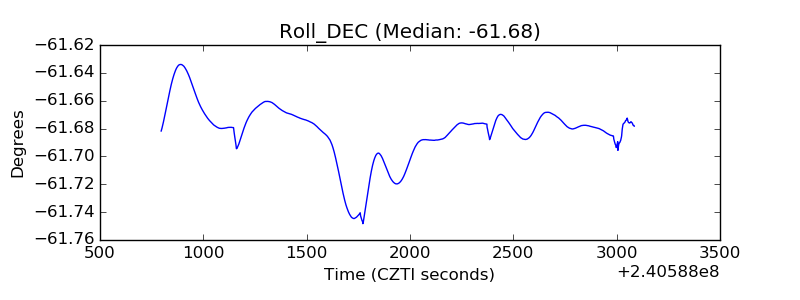 |
| _Roll_RA | 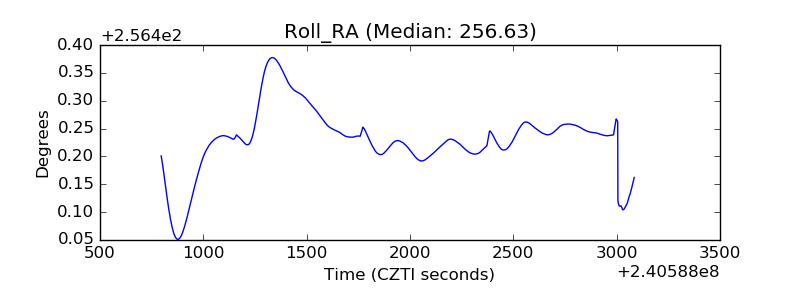 |
| Veto Counter |  |