| Param | Original file | Final file |
|---|---|---|
| Filename | modeM0/AS1A03_050T01_9000001468_10192cztM0_level2.evt | modeM0/AS1A03_050T01_9000001468_10192cztM0_level2_quad_clean.evt |
| Size (bytes) | 442,226,880 | 111,202,560 |
| Size | 421.7 MB | 106.1 MB |
| Events in quadrant A | 3,031,867 | 731,067 |
| Events in quadrant B | 3,347,813 | 733,710 |
| Events in quadrant C | 2,938,015 | 735,801 |
| Events in quadrant D | 3,620,205 | 700,861 |
| Mode M0 | |||
|---|---|---|---|
| Quadrant | BADHDUFLAG | Total packets | Discarded packets |
| A | 0 | 13724 | 3 |
| B | 0 | 14282 | 2 |
| C | 0 | 13614 | 2 |
| D | 0 | 15045 | 2 |
| Mode M9 | |||
|---|---|---|---|
| Quadrant | BADHDUFLAG | Total packets | Discarded packets |
| A | 0 | 8 | 0 |
| B | 0 | 8 | 0 |
| C | 0 | 8 | 0 |
| D | 0 | 8 | 0 |
| Mode SS | |||
|---|---|---|---|
| Quadrant | BADHDUFLAG | Total packets | Discarded packets |
| A | 0 | 138 | 0 |
| B | 0 | 138 | 0 |
| C | 0 | 138 | 0 |
| D | 0 | 138 | 0 |
| Quadrant | Total seconds | Saturated seconds | Saturation percentage |
|---|---|---|---|
| A | 6685 | 23 | 0.344054% |
| B | 6685 | 50 | 0.747943% |
| C | 6685 | 10 | 0.149589% |
| D | 6686 | 50 | 0.747831% |
Noise dominated data is calculated using 1-second bins in cleaned event files. If a bin has >2000 counts, and if more than 50% of those come from <1% of pixels, then it is considered to be noise-dominated and hence unusable.
| Quadrant | # 1 sec bins | Bins with >0 counts | Bins with >2000 counts | High rate bins dominated by noise | Noise dominated (total time) | Noise dominated (detector-on time) | Marked lightcurve |
|---|---|---|---|---|---|---|---|
| A | 7540 | 6686 | 1 | 1 | 0.01% | 0.01% | 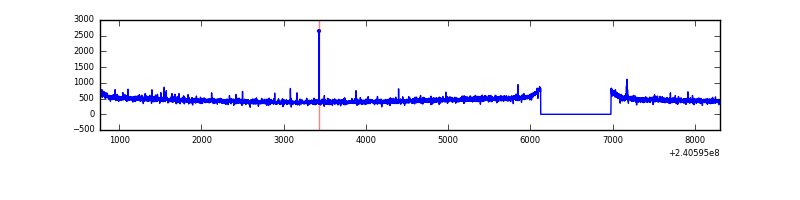 |
| B | 7540 | 6686 | 7 | 7 | 0.09% | 0.10% | 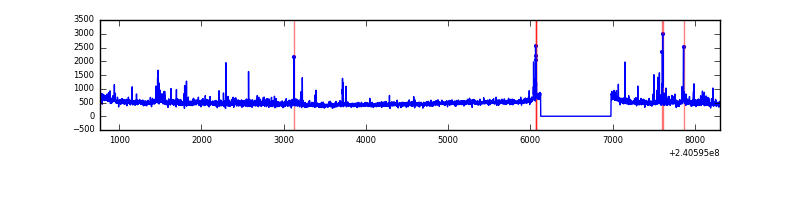 |
| C | 7540 | 6686 | 0 | 0 | 0.00% | 0.00% | 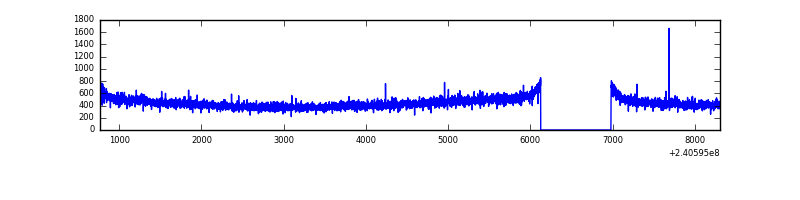 |
| D | 7541 | 6687 | 25 | 25 | 0.33% | 0.37% | 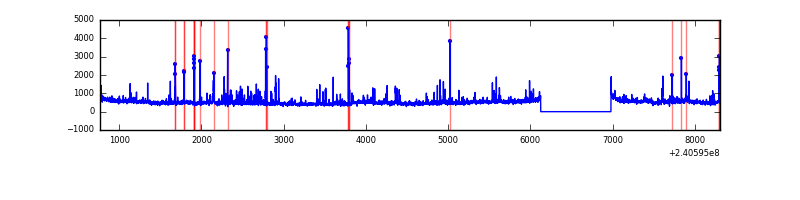 |
Top three noisy pixels from each quadrant. If the there are fewer than three noisy pixels in the level2.evt file, extra rows are filled as -1
| Pixel properties | Quadrant properties | ||||||
|---|---|---|---|---|---|---|---|
| Quadrant | DetID | PixID | Counts | Sigma | Mean | Median | Sigma |
| A | 15 | 174 | 10902 | 63.86 | 781 | 762 | 158.8 |
| A | 3 | 1 | 10206 | 59.47 | 781 | 762 | 158.8 |
| A | 0 | 226 | 7402 | 41.81 | 781 | 762 | 158.8 |
| B | 11 | 51 | 125726 | 852.26 | 780 | 764 | 146.6 |
| B | 0 | 189 | 43255 | 289.8 | 780 | 764 | 146.6 |
| B | 5 | 255 | 40759 | 272.77 | 780 | 764 | 146.6 |
| C | 14 | 67 | 7745 | 40.53 | 750 | 752 | 172.5 |
| C | 13 | 61 | 5519 | 27.63 | 750 | 752 | 172.5 |
| C | 14 | 234 | 3579 | 16.39 | 750 | 752 | 172.5 |
| D | 8 | 195 | 324381 | 1813.07 | 748 | 726 | 178.5 |
| D | 1 | 52 | 132294 | 737.03 | 748 | 726 | 178.5 |
| D | 7 | 71 | 73414 | 407.19 | 748 | 726 | 178.5 |
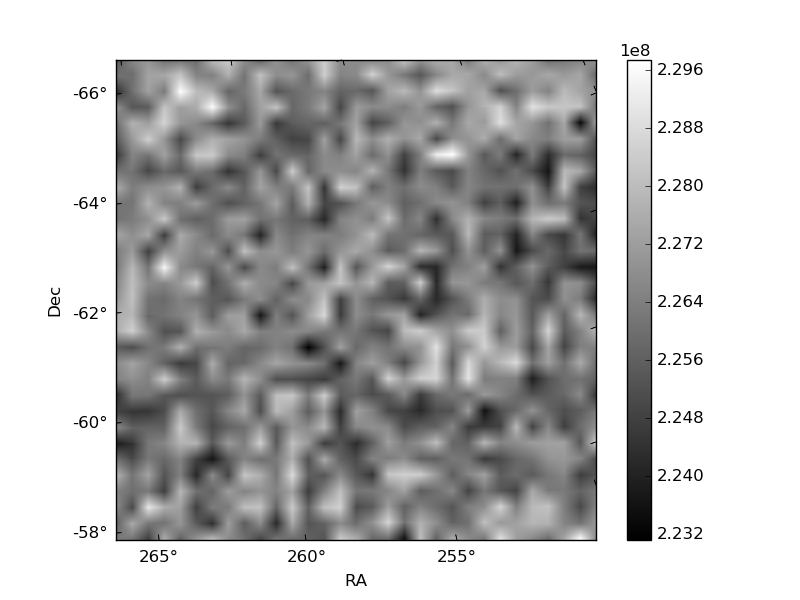
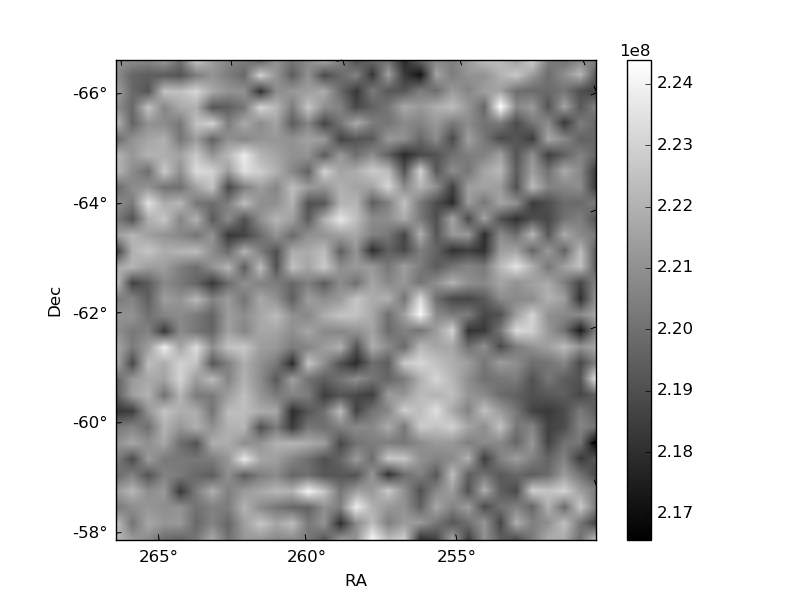
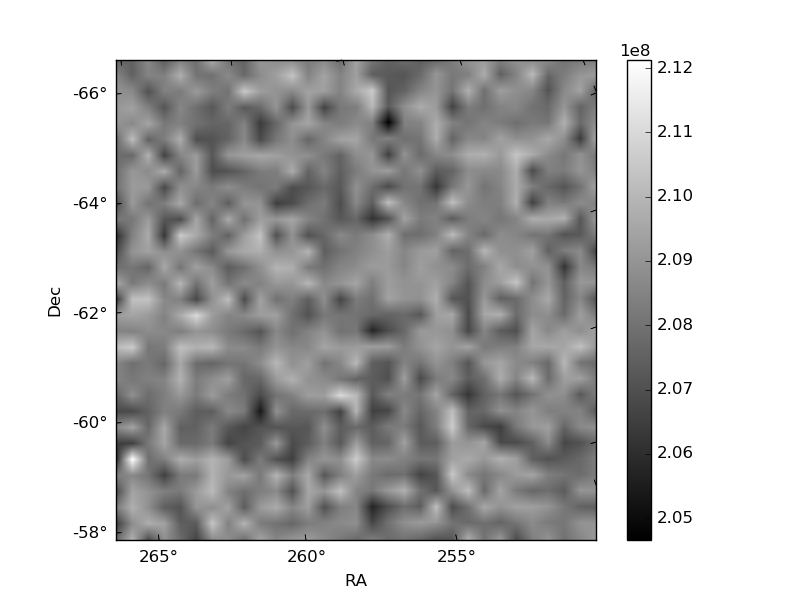
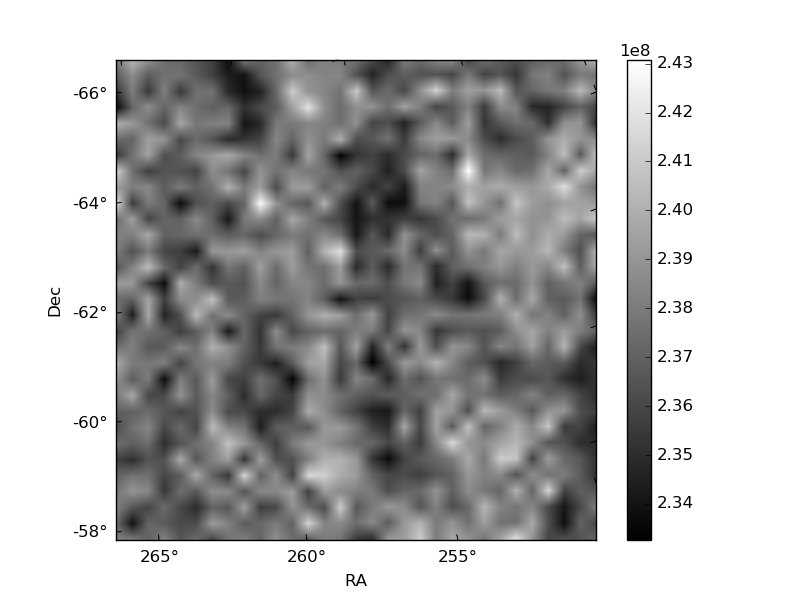
Histogram calculated using DETX and DETY for each event in the final _common_clean file
| Quadrant A |  |
 |
Quadrant B |
|---|---|---|---|
| Quadrant D |  |
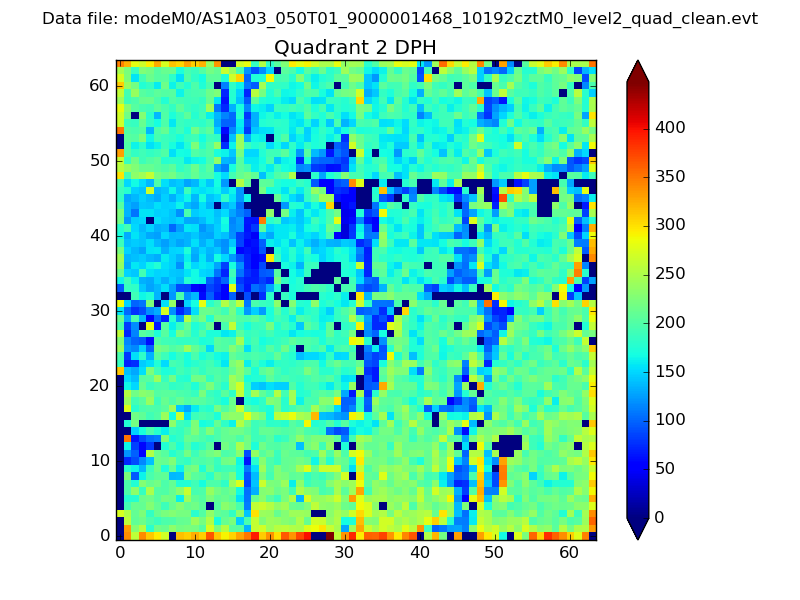 |
Quadrant C |
| Plot type | Count rate plots | Images |
|---|---|---|
| Comparison with Poisson distribution Blue bars denote a histogram of data divided into 1 sec bins. Red curve is a Poisson curve with rate = median count rate of data. |
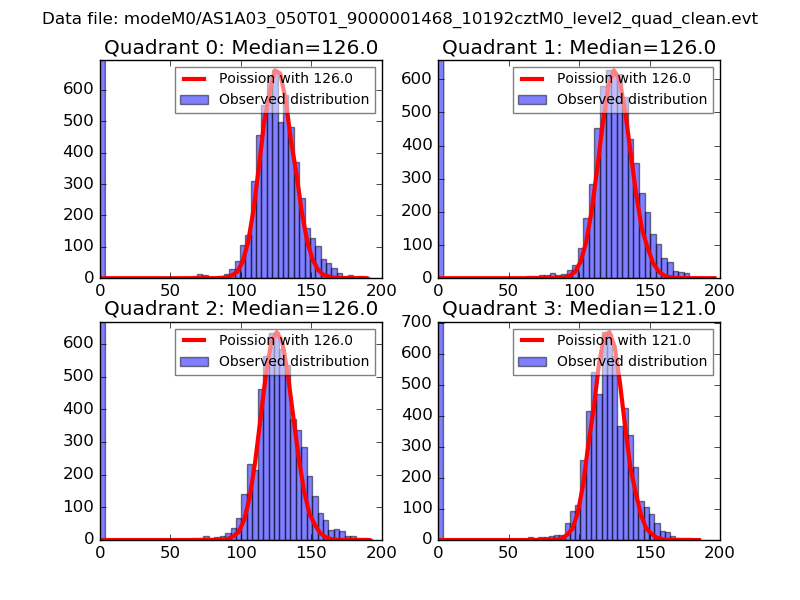 |
 |
| Quadrant-wise count rates Data is divided into 100 sec bins |
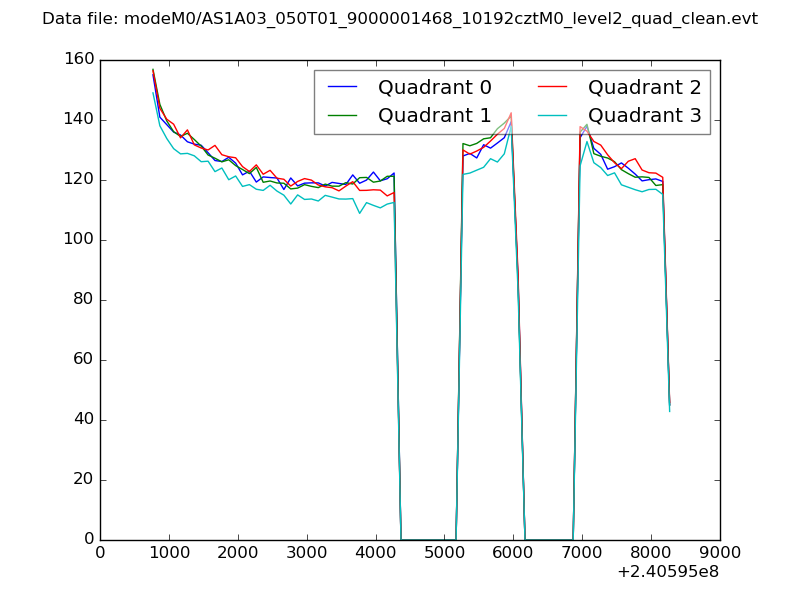 |
|
| Module-wise count rates for Quadrant A Data is divided into 100 sec bins |
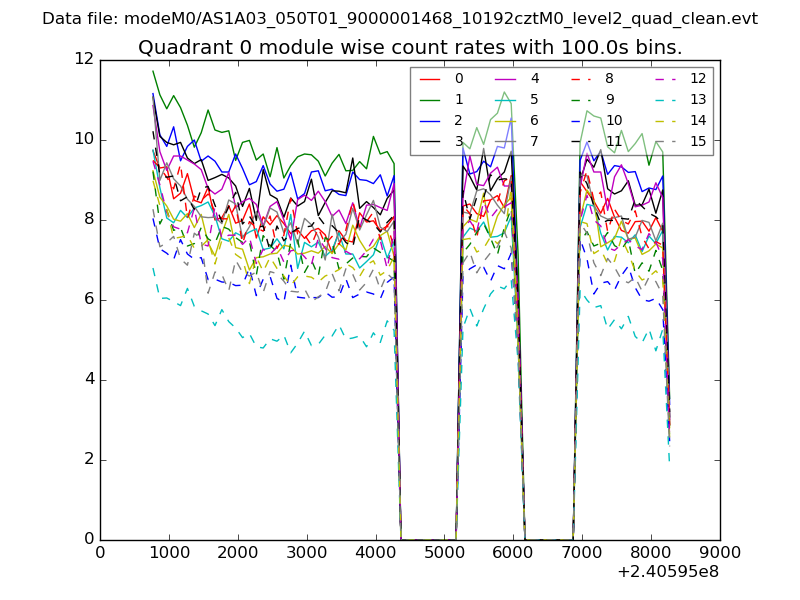 |
 |
| Module-wise count rates for Quadrant B Data is divided into 100 sec bins |
 |
 |
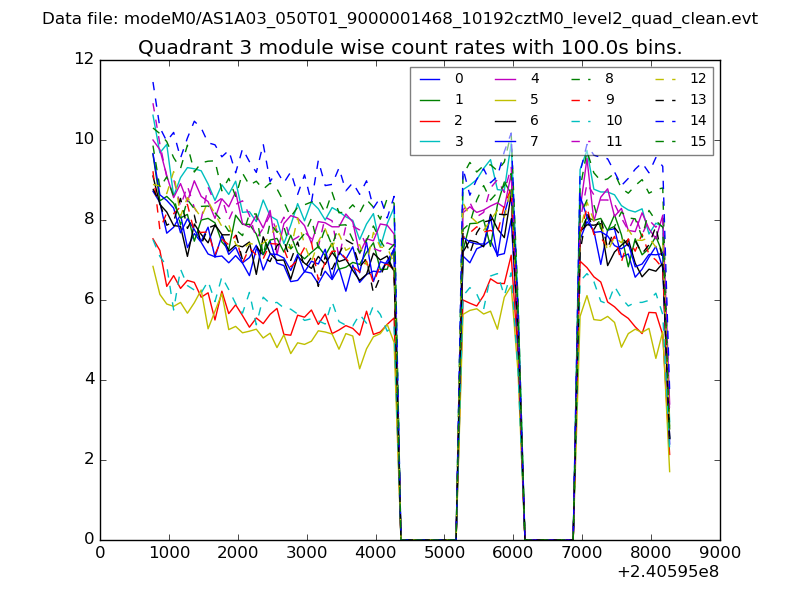
| Module-wise count rates for Quadrant C Data is divided into 100 sec bins |
 |
 |
| Module-wise count rates for Quadrant D Data is divided into 100 sec bins |
 |
 |
| Parameter | Plot |
|---|---|
| CZT HV Monitor |  |
| D_VDD | 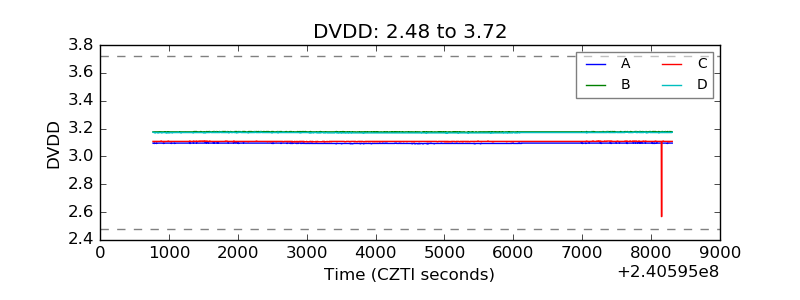 |
| Temperature 1 | 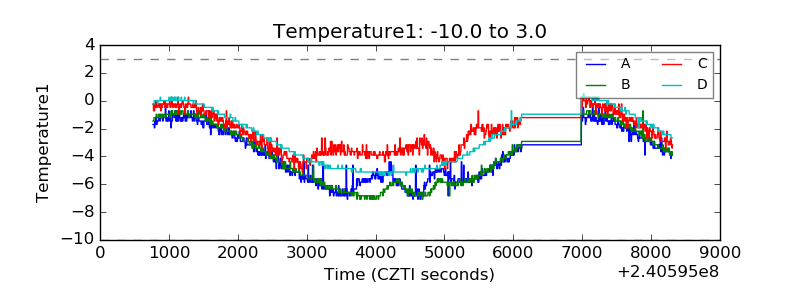 |
| Veto HV Monitor | 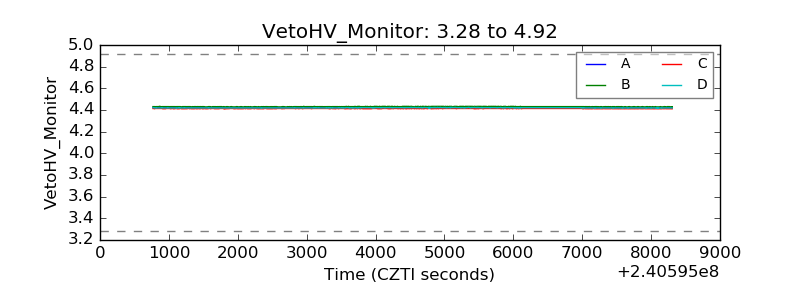 |
| Veto LLD | 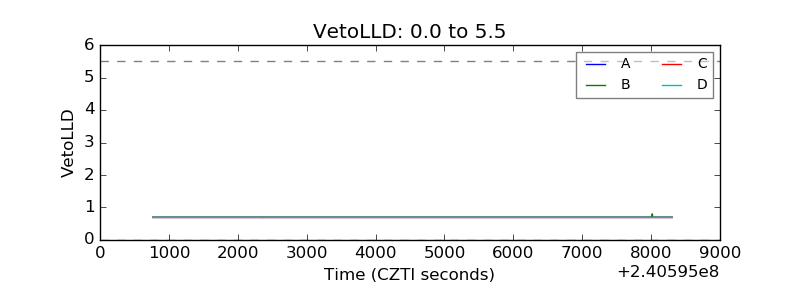 |
| Alpha Counter | 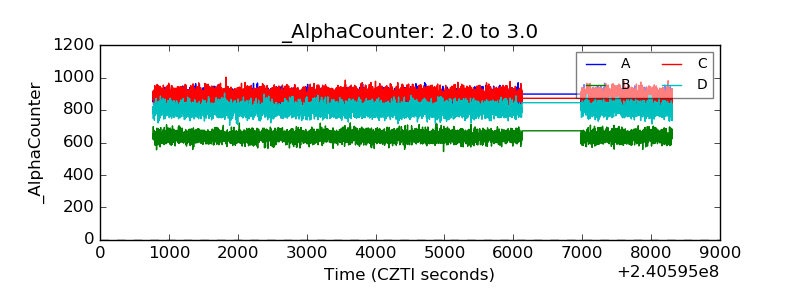 |
| _CPM_Rate | 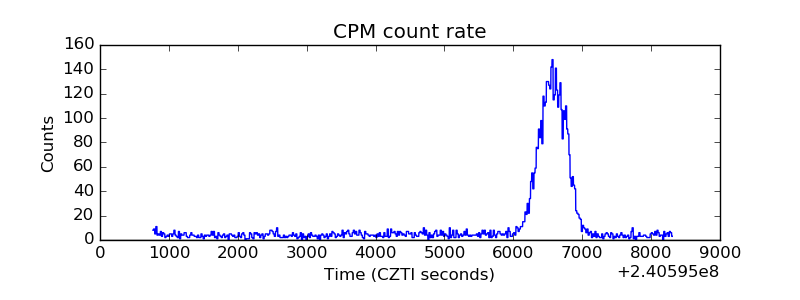 |
| CZT Counter | 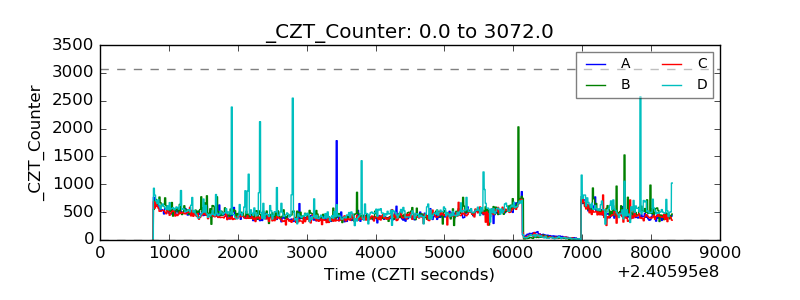 |
| +2.5 Volts monitor |  |
| +5 Volts monitor | 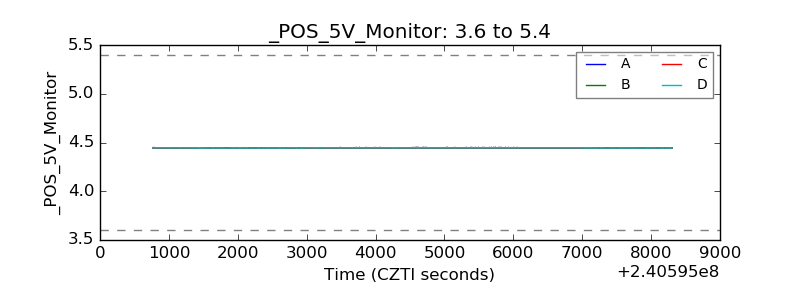 |
| _ROLL_ROT | 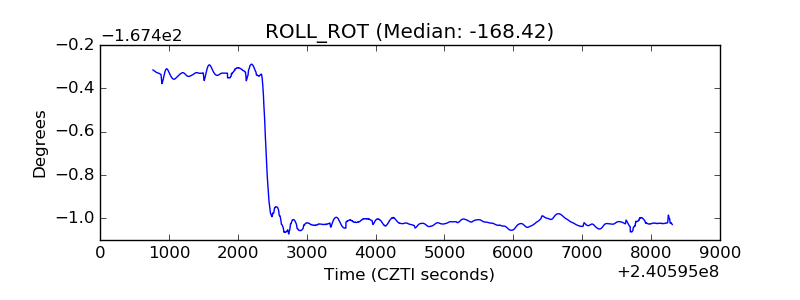 |
| _Roll_DEC | 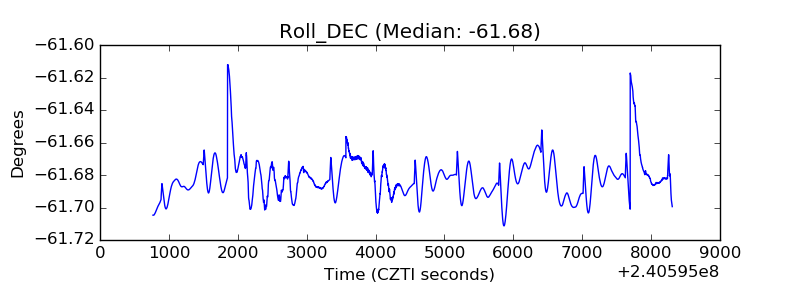 |
| _Roll_RA | 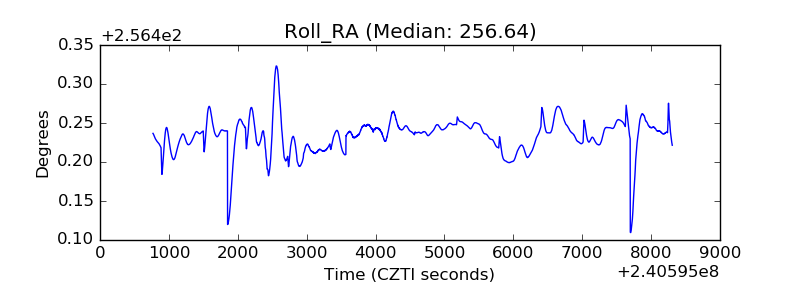 |
| Veto Counter | 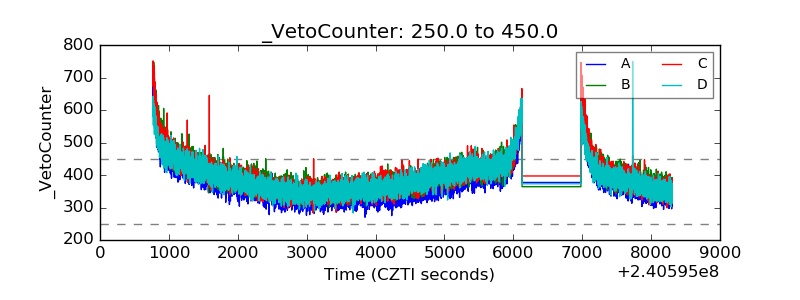 |