| Param | Original file | Final file |
|---|---|---|
| Filename | modeM0/AS1A03_050T01_9000001468_10193cztM0_level2.evt | modeM0/AS1A03_050T01_9000001468_10193cztM0_level2_quad_clean.evt |
| Size (bytes) | 483,278,400 | 118,056,960 |
| Size | 460.9 MB | 112.6 MB |
| Events in quadrant A | 3,277,971 | 772,318 |
| Events in quadrant B | 3,753,463 | 773,061 |
| Events in quadrant C | 3,193,382 | 780,990 |
| Events in quadrant D | 3,919,338 | 745,382 |
| Mode M0 | |||
|---|---|---|---|
| Quadrant | BADHDUFLAG | Total packets | Discarded packets |
| A | 0 | 14922 | 2 |
| B | 0 | 16022 | 1 |
| C | 0 | 14694 | 1 |
| D | 0 | 16393 | 1 |
| Mode M9 | |||
|---|---|---|---|
| Quadrant | BADHDUFLAG | Total packets | Discarded packets |
| A | 0 | 4 | 0 |
| B | 0 | 4 | 0 |
| C | 0 | 4 | 0 |
| D | 0 | 4 | 0 |
| Mode SS | |||
|---|---|---|---|
| Quadrant | BADHDUFLAG | Total packets | Discarded packets |
| A | 0 | 148 | 0 |
| B | 0 | 148 | 0 |
| C | 0 | 148 | 0 |
| D | 0 | 148 | 0 |
| Quadrant | Total seconds | Saturated seconds | Saturation percentage |
|---|---|---|---|
| A | 7235 | 36 | 0.497581% |
| B | 7235 | 108 | 1.492744% |
| C | 7235 | 15 | 0.207326% |
| D | 7235 | 58 | 0.801659% |
Noise dominated data is calculated using 1-second bins in cleaned event files. If a bin has >2000 counts, and if more than 50% of those come from <1% of pixels, then it is considered to be noise-dominated and hence unusable.
| Quadrant | # 1 sec bins | Bins with >0 counts | Bins with >2000 counts | High rate bins dominated by noise | Noise dominated (total time) | Noise dominated (detector-on time) | Marked lightcurve |
|---|---|---|---|---|---|---|---|
| A | 7640 | 7236 | 5 | 5 | 0.07% | 0.07% | 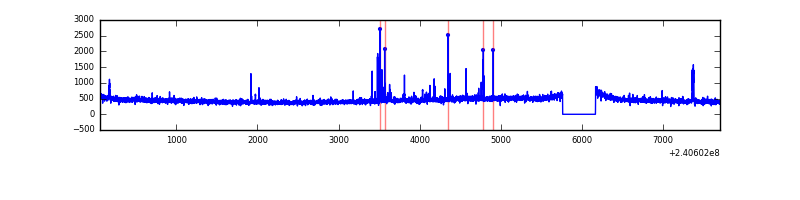 |
| B | 7640 | 7236 | 26 | 26 | 0.34% | 0.36% | 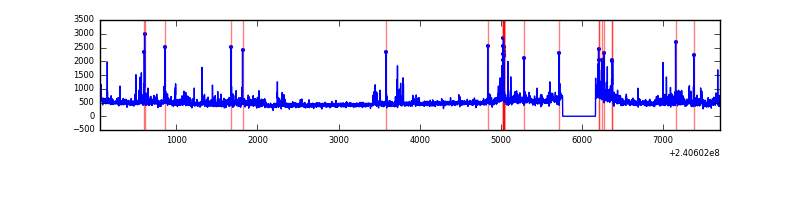 |
| C | 7640 | 7236 | 2 | 2 | 0.03% | 0.03% | 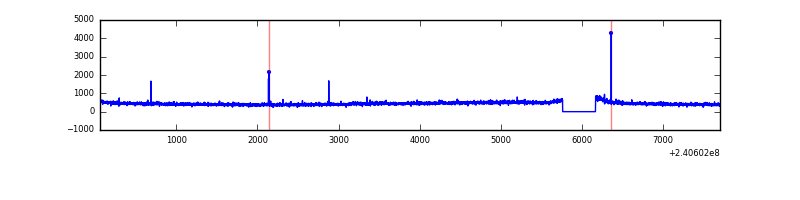 |
| D | 7640 | 7236 | 33 | 33 | 0.43% | 0.46% | 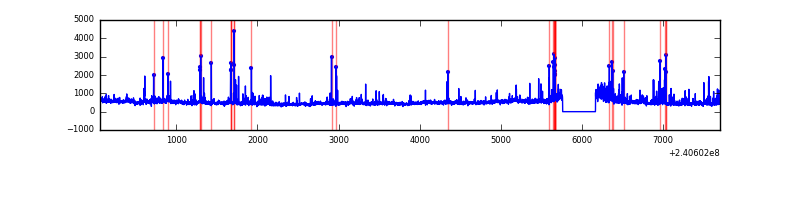 |
Top three noisy pixels from each quadrant. If the there are fewer than three noisy pixels in the level2.evt file, extra rows are filled as -1
| Pixel properties | Quadrant properties | ||||||
|---|---|---|---|---|---|---|---|
| Quadrant | DetID | PixID | Counts | Sigma | Mean | Median | Sigma |
| A | 15 | 223 | 39576 | 232.75 | 827 | 809 | 166.6 |
| A | 15 | 174 | 27868 | 162.45 | 827 | 809 | 166.6 |
| A | 15 | 239 | 18095 | 103.78 | 827 | 809 | 166.6 |
| B | 11 | 51 | 181780 | 1154.56 | 827 | 806 | 156.7 |
| B | 4 | 239 | 95550 | 604.44 | 827 | 806 | 156.7 |
| B | 6 | 51 | 77028 | 486.28 | 827 | 806 | 156.7 |
| C | 14 | 67 | 37093 | 195.9 | 802 | 806 | 185.2 |
| C | 12 | 4 | 12857 | 65.06 | 802 | 806 | 185.2 |
| C | 13 | 61 | 6012 | 28.1 | 802 | 806 | 185.2 |
| D | 8 | 195 | 349737 | 1822.86 | 796 | 771 | 191.4 |
| D | 5 | 222 | 99005 | 513.13 | 796 | 771 | 191.4 |
| D | 7 | 71 | 84763 | 438.74 | 796 | 771 | 191.4 |
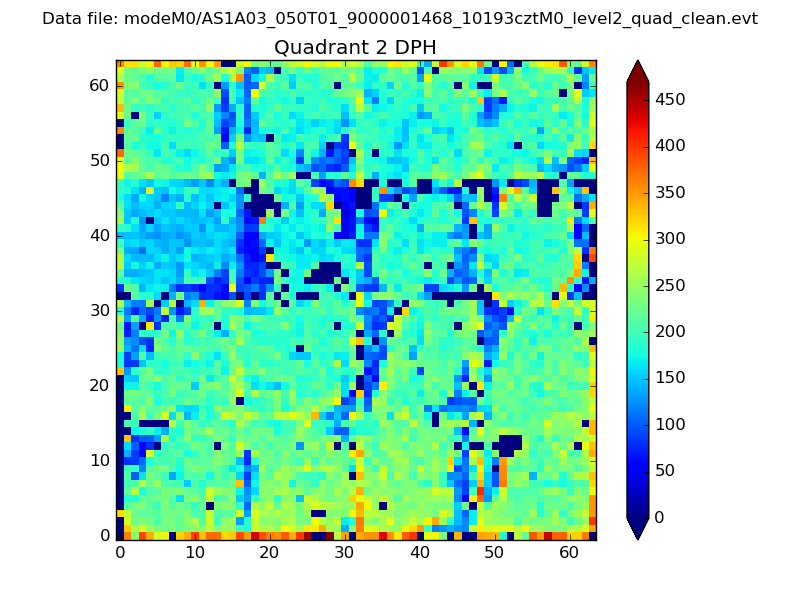
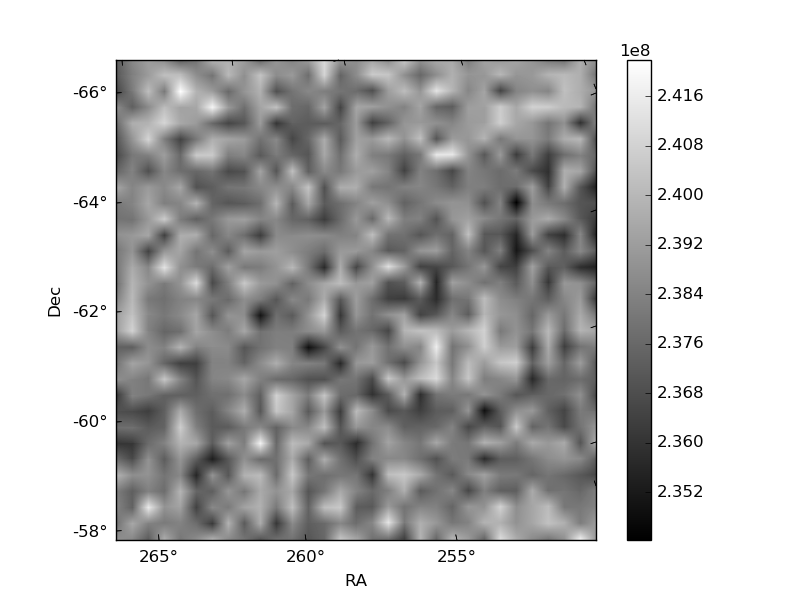
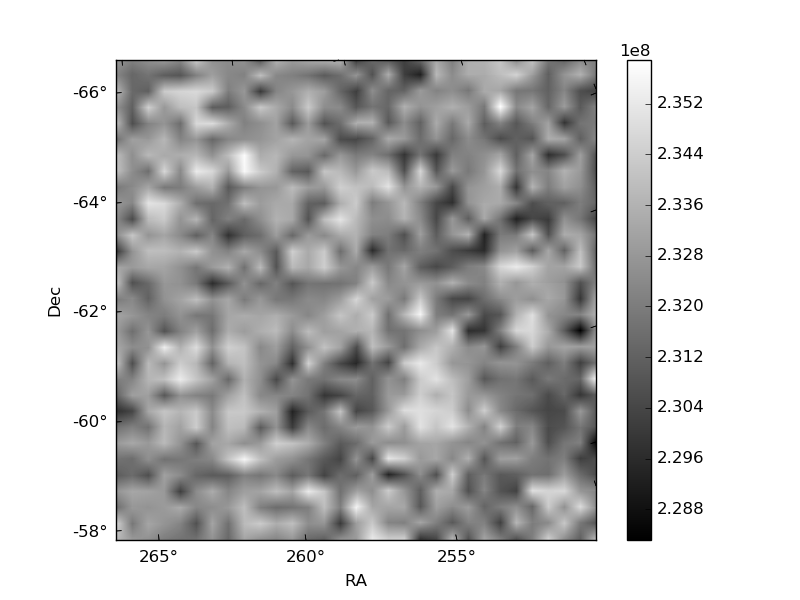
Histogram calculated using DETX and DETY for each event in the final _common_clean file
| Quadrant A | 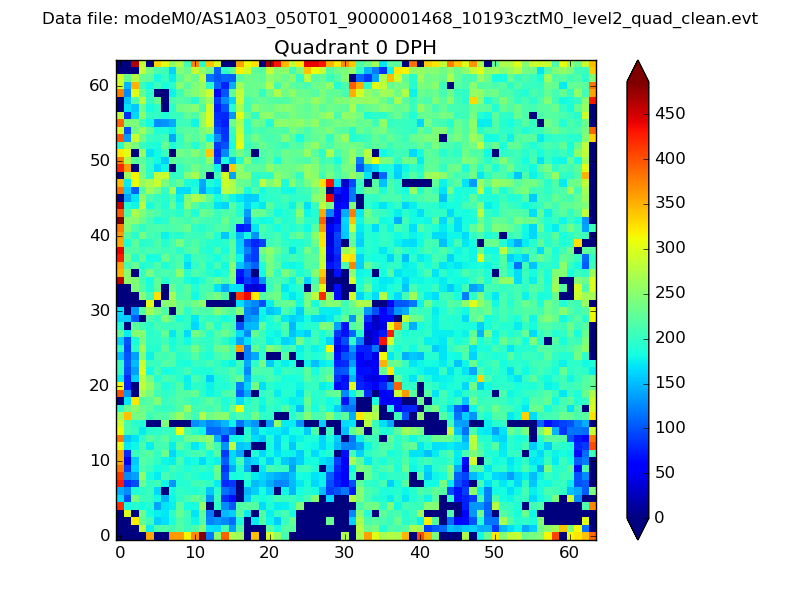 |
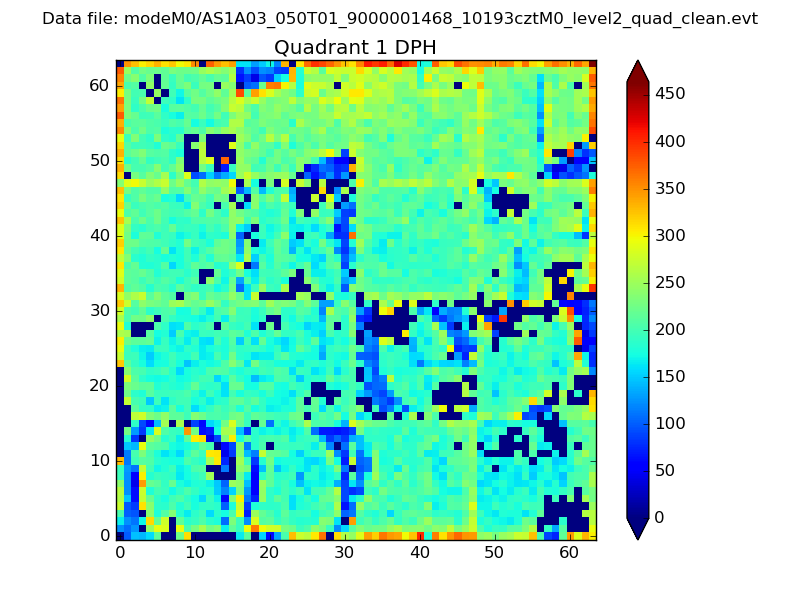 |
Quadrant B |
|---|---|---|---|
| Quadrant D | 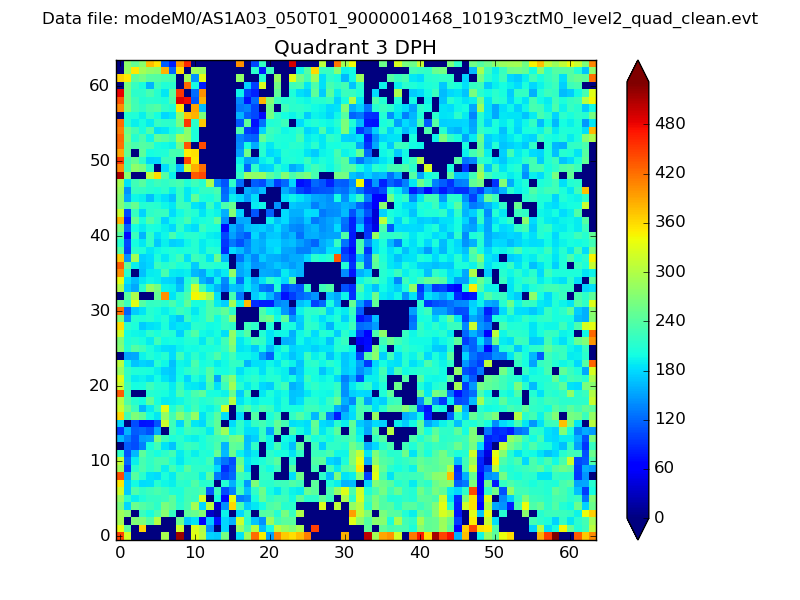 |
 |
Quadrant C |
| Plot type | Count rate plots | Images |
|---|---|---|
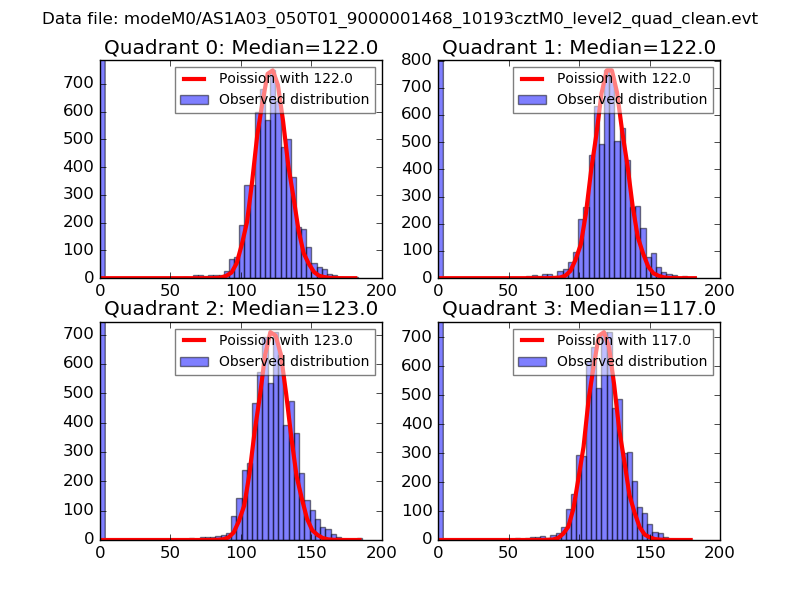
| Comparison with Poisson distribution Blue bars denote a histogram of data divided into 1 sec bins. Red curve is a Poisson curve with rate = median count rate of data. |
 |
 |
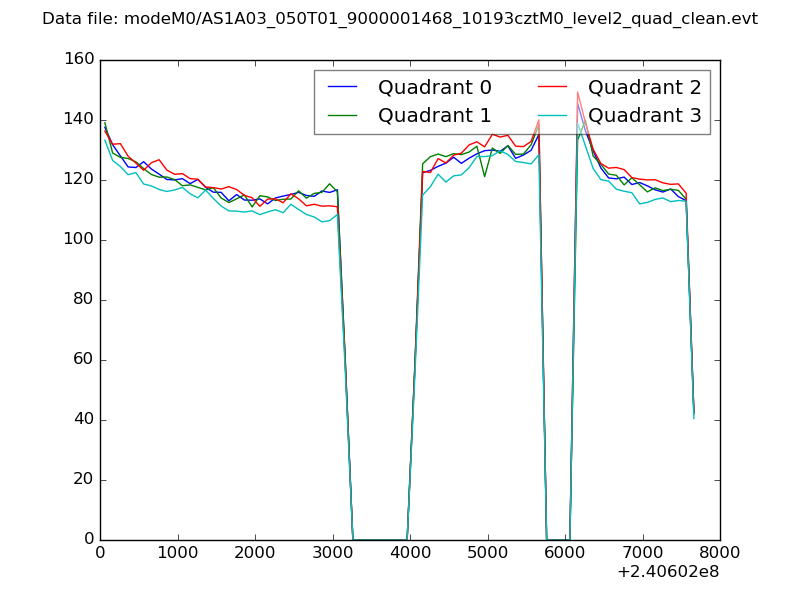
| Quadrant-wise count rates Data is divided into 100 sec bins |
 |
|
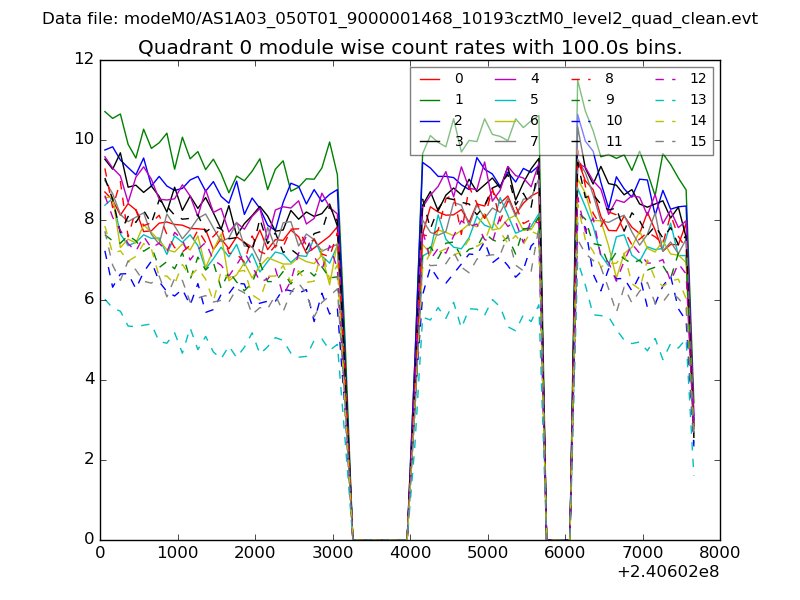
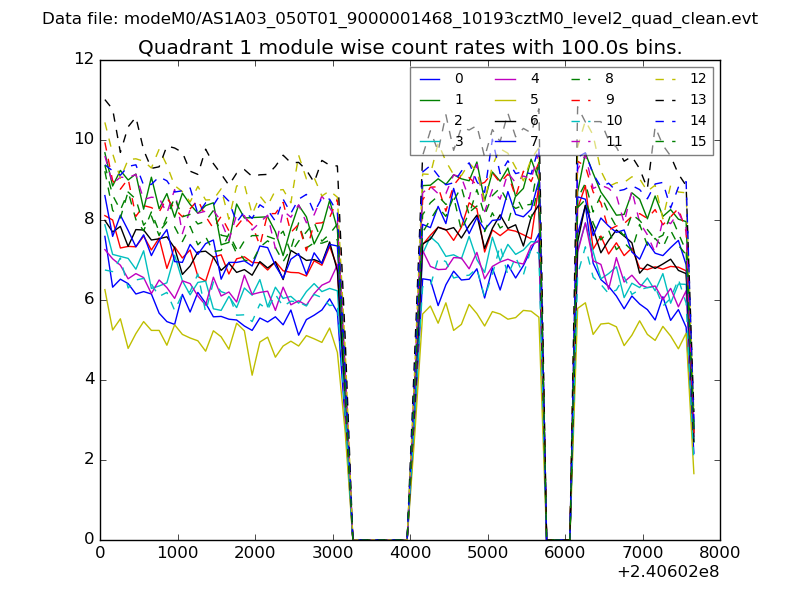
| Module-wise count rates for Quadrant A Data is divided into 100 sec bins |
 |
 |
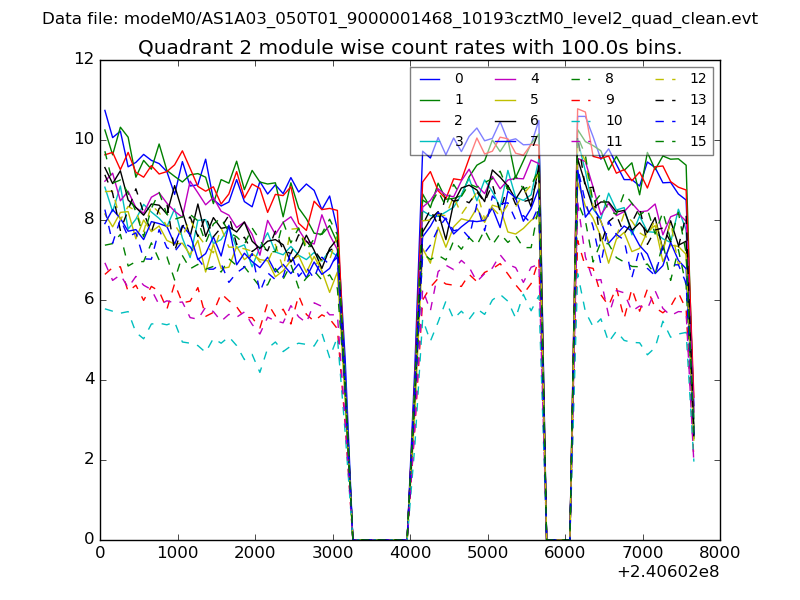
| Module-wise count rates for Quadrant B Data is divided into 100 sec bins |
 |
 |
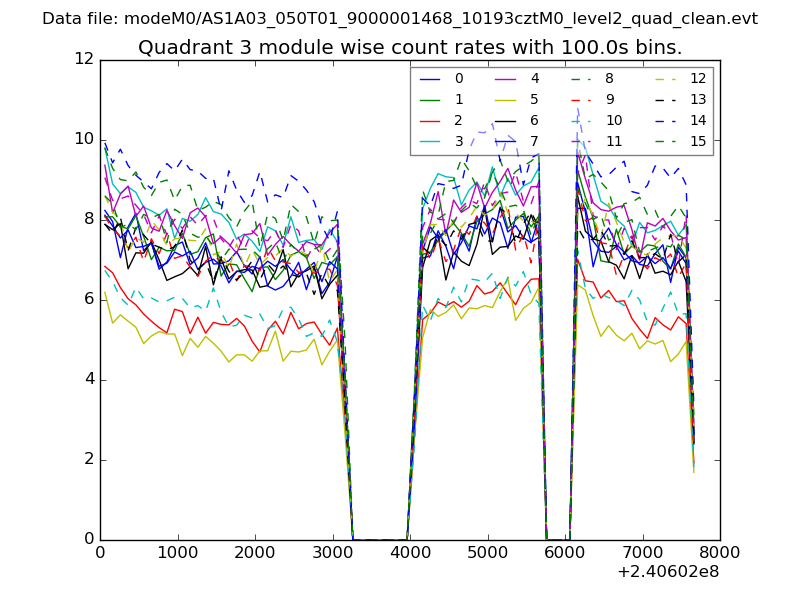
| Module-wise count rates for Quadrant C Data is divided into 100 sec bins |
 |
 |
| Module-wise count rates for Quadrant D Data is divided into 100 sec bins |
 |
 |
| Parameter | Plot |
|---|---|
| CZT HV Monitor | 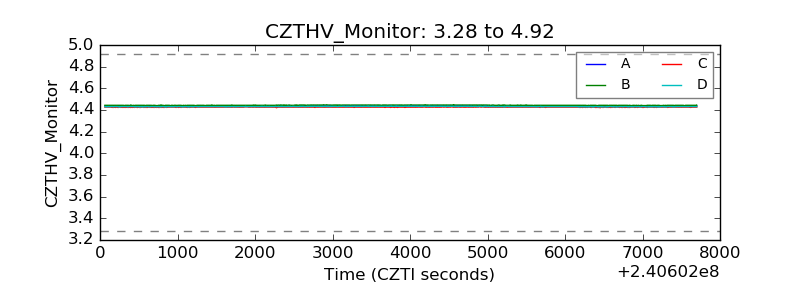 |
| D_VDD | 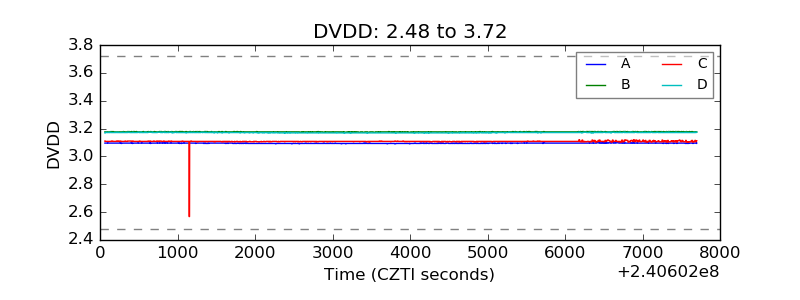 |
| Temperature 1 | 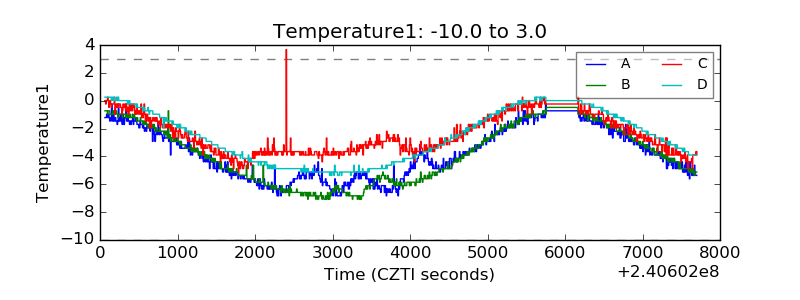 |
| Veto HV Monitor |  |
| Veto LLD | 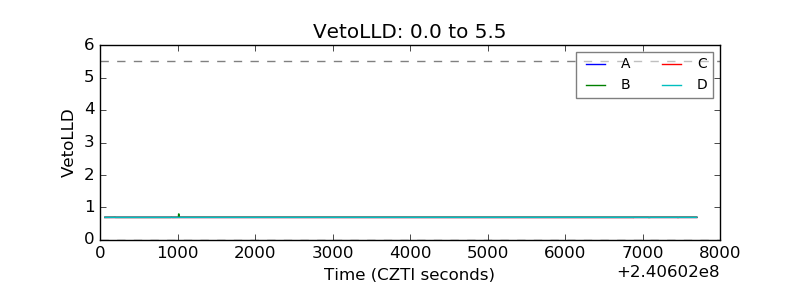 |
| Alpha Counter | 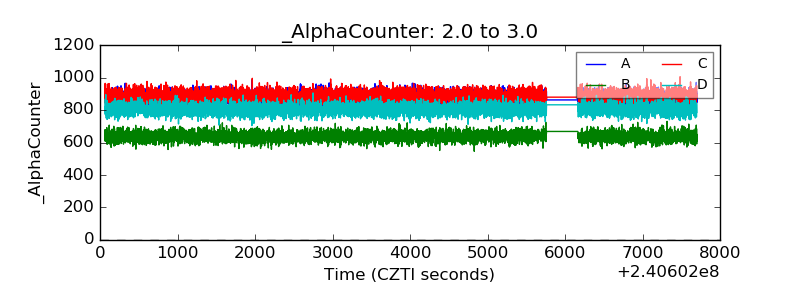 |
| _CPM_Rate | 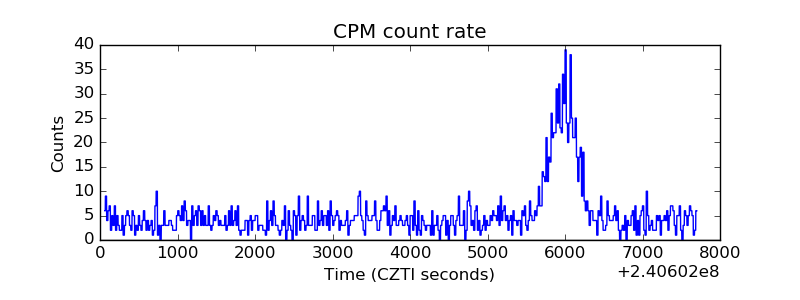 |
| CZT Counter | 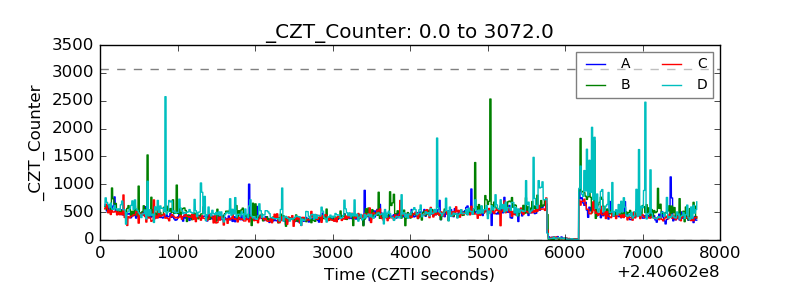 |
| +2.5 Volts monitor |  |
| +5 Volts monitor |  |
| _ROLL_ROT |  |
| _Roll_DEC |  |
| _Roll_RA | 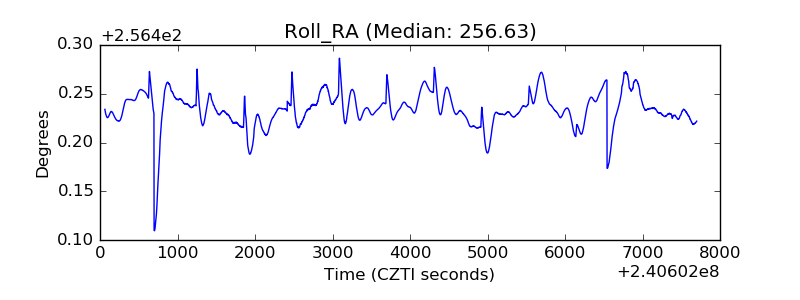 |
| Veto Counter | 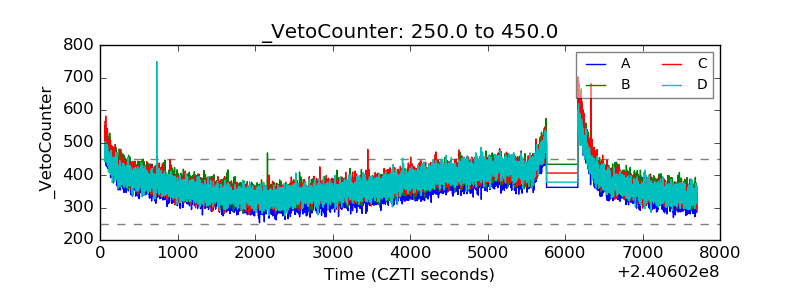 |