| Param | Original file | Final file |
|---|---|---|
| Filename | modeM0/AS1A03_050T01_9000001468_10199cztM0_level2.evt | modeM0/AS1A03_050T01_9000001468_10199cztM0_level2_quad_clean.evt |
| Size (bytes) | 442,854,720 | 81,313,920 |
| Size | 422.3 MB | 77.5 MB |
| Events in quadrant A | 3,001,135 | 508,327 |
| Events in quadrant B | 3,098,182 | 517,943 |
| Events in quadrant C | 2,677,356 | 525,529 |
| Events in quadrant D | 4,229,384 | 493,499 |
| Mode M0 | |||
|---|---|---|---|
| Quadrant | BADHDUFLAG | Total packets | Discarded packets |
| A | 0 | 13042 | 2 |
| B | 0 | 13022 | 3 |
| C | 0 | 12146 | 1 |
| D | 0 | 16401 | 1 |
| Mode M9 | |||
|---|---|---|---|
| Quadrant | BADHDUFLAG | Total packets | Discarded packets |
| A | 0 | 10 | 0 |
| B | 0 | 10 | 0 |
| C | 0 | 10 | 0 |
| D | 0 | 10 | 0 |
| Mode SS | |||
|---|---|---|---|
| Quadrant | BADHDUFLAG | Total packets | Discarded packets |
| A | 0 | 120 | 0 |
| B | 0 | 120 | 0 |
| C | 0 | 120 | 0 |
| D | 0 | 120 | 0 |
| Quadrant | Total seconds | Saturated seconds | Saturation percentage |
|---|---|---|---|
| A | 5976 | 130 | 2.175368% |
| B | 5975 | 76 | 1.271967% |
| C | 5976 | 43 | 0.719545% |
| D | 5976 | 123 | 2.058233% |
Noise dominated data is calculated using 1-second bins in cleaned event files. If a bin has >2000 counts, and if more than 50% of those come from <1% of pixels, then it is considered to be noise-dominated and hence unusable.
| Quadrant | # 1 sec bins | Bins with >0 counts | Bins with >2000 counts | High rate bins dominated by noise | Noise dominated (total time) | Noise dominated (detector-on time) | Marked lightcurve |
|---|---|---|---|---|---|---|---|
| A | 6981 | 5976 | 65 | 65 | 0.93% | 1.09% | 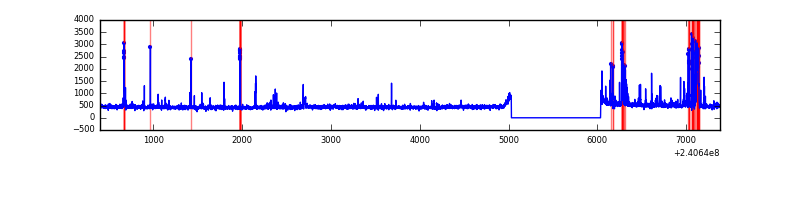 |
| B | 6981 | 5976 | 11 | 11 | 0.16% | 0.18% | 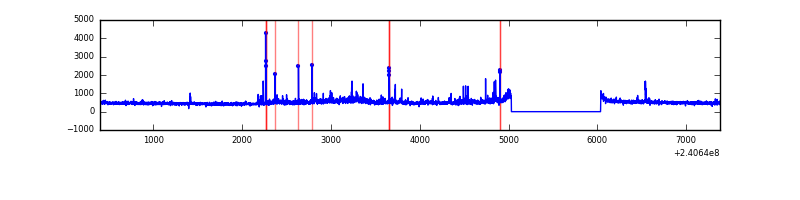 |
| C | 6981 | 5976 | 0 | 0 | 0.00% | 0.00% | 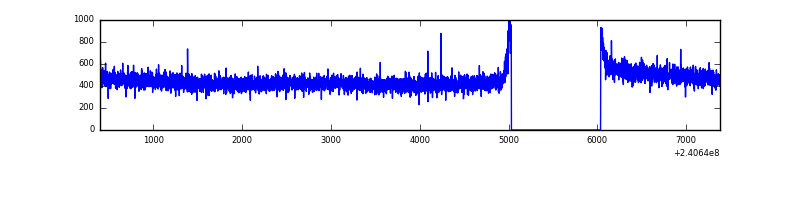 |
| D | 6981 | 5976 | 62 | 62 | 0.89% | 1.04% | 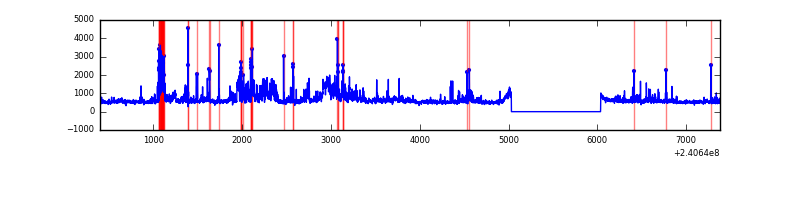 |
Top three noisy pixels from each quadrant. If the there are fewer than three noisy pixels in the level2.evt file, extra rows are filled as -1
| Pixel properties | Quadrant properties | ||||||
|---|---|---|---|---|---|---|---|
| Quadrant | DetID | PixID | Counts | Sigma | Mean | Median | Sigma |
| A | 15 | 223 | 221651 | 1579.61 | 693 | 678 | 139.9 |
| A | 15 | 239 | 88433 | 627.31 | 693 | 678 | 139.9 |
| A | 15 | 255 | 10829 | 72.56 | 693 | 678 | 139.9 |
| B | 0 | 214 | 102313 | 765.97 | 699 | 681 | 132.7 |
| B | 5 | 255 | 94487 | 706.98 | 699 | 681 | 132.7 |
| B | 0 | 189 | 53337 | 396.85 | 699 | 681 | 132.7 |
| C | 14 | 67 | 5755 | 32.15 | 684 | 687 | 157.6 |
| C | 13 | 61 | 5050 | 27.68 | 684 | 687 | 157.6 |
| C | 4 | 175 | 3260 | 16.32 | 684 | 687 | 157.6 |
| D | 8 | 195 | 476020 | 2952.51 | 676 | 655 | 161.0 |
| D | 1 | 52 | 348328 | 2159.41 | 676 | 655 | 161.0 |
| D | 2 | 179 | 299317 | 1855.0 | 676 | 655 | 161.0 |
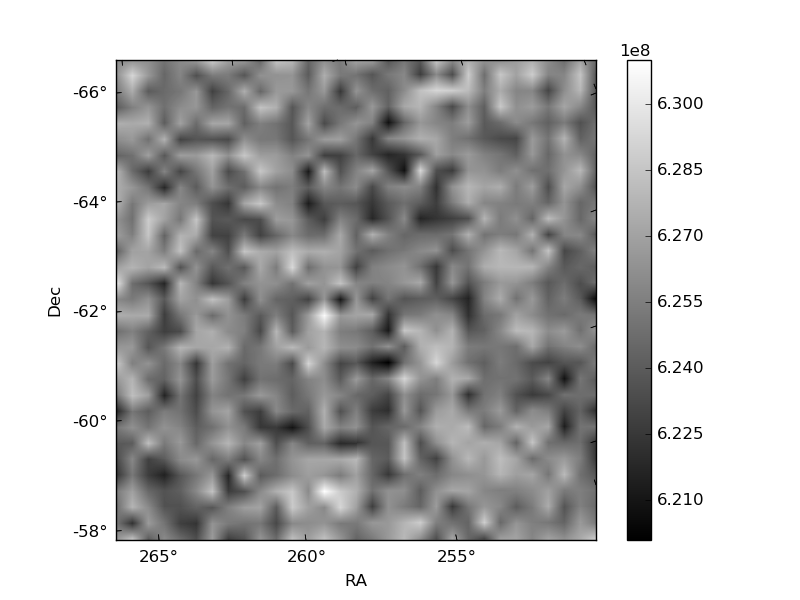
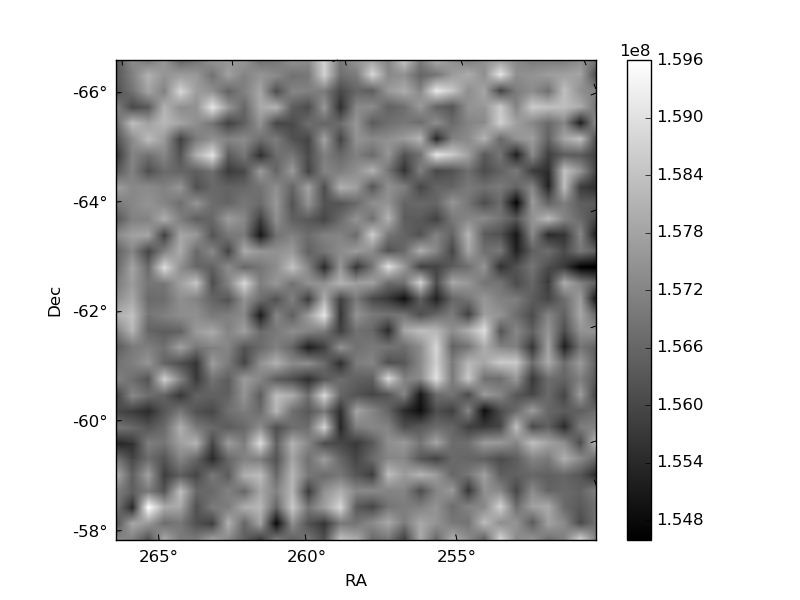
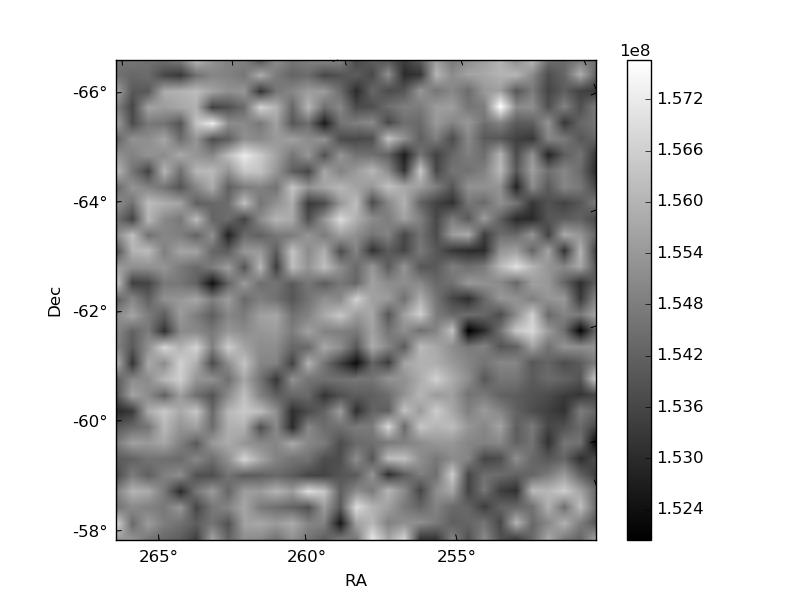
Histogram calculated using DETX and DETY for each event in the final _common_clean file
| Quadrant A | 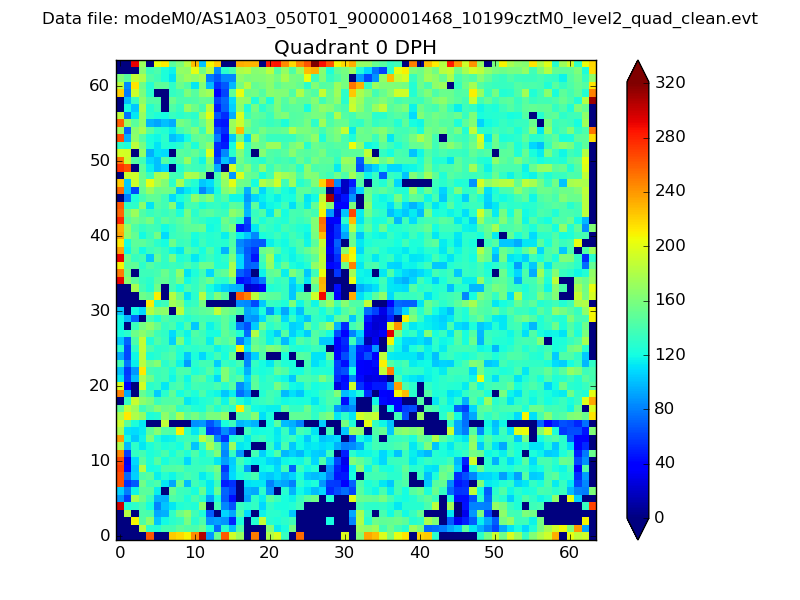 |
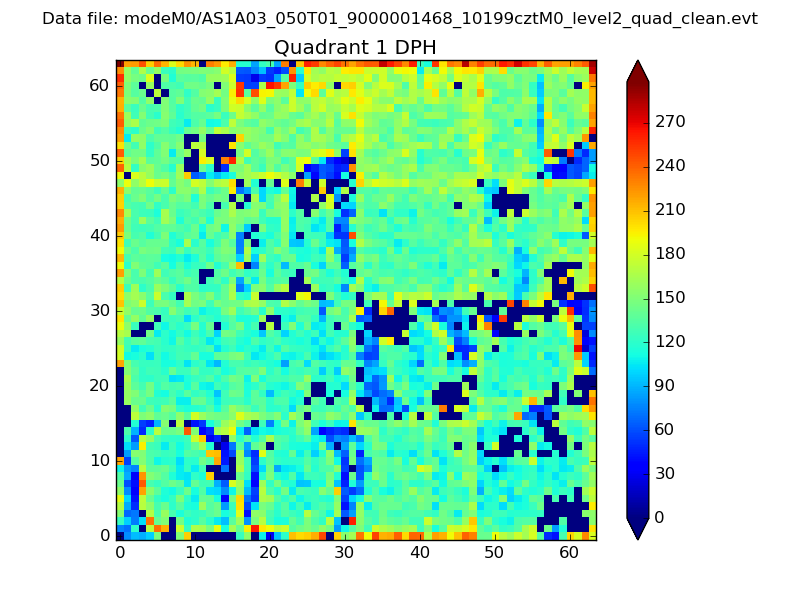 |
Quadrant B |
|---|---|---|---|
| Quadrant D |  |
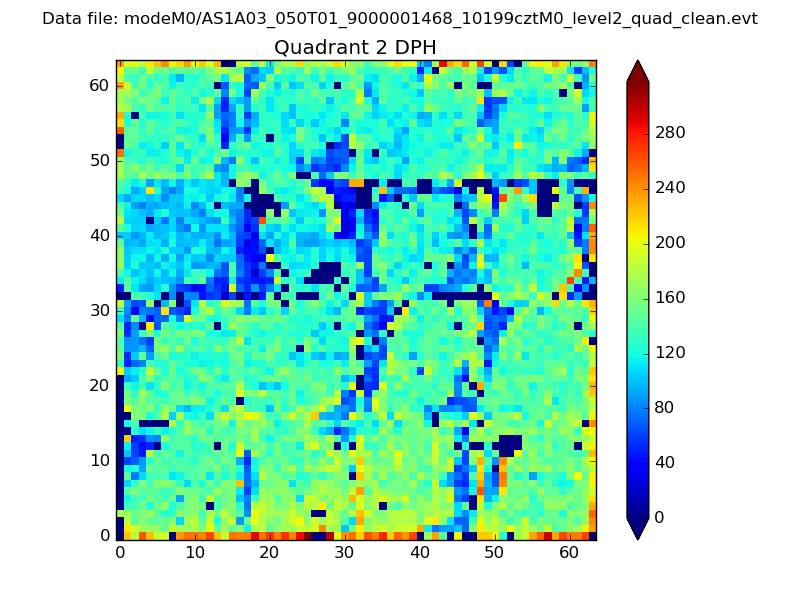 |
Quadrant C |
| Plot type | Count rate plots | Images |
|---|---|---|
| Comparison with Poisson distribution Blue bars denote a histogram of data divided into 1 sec bins. Red curve is a Poisson curve with rate = median count rate of data. |
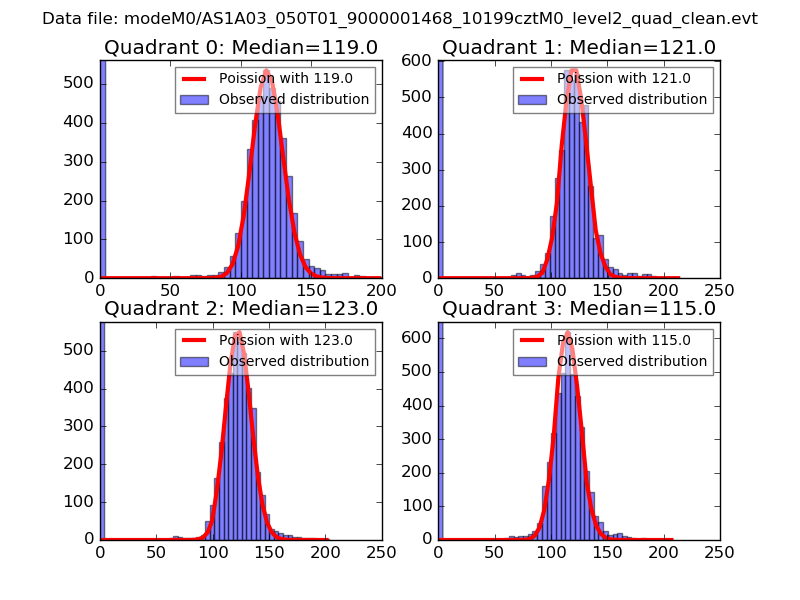 |
 |
| Quadrant-wise count rates Data is divided into 100 sec bins |
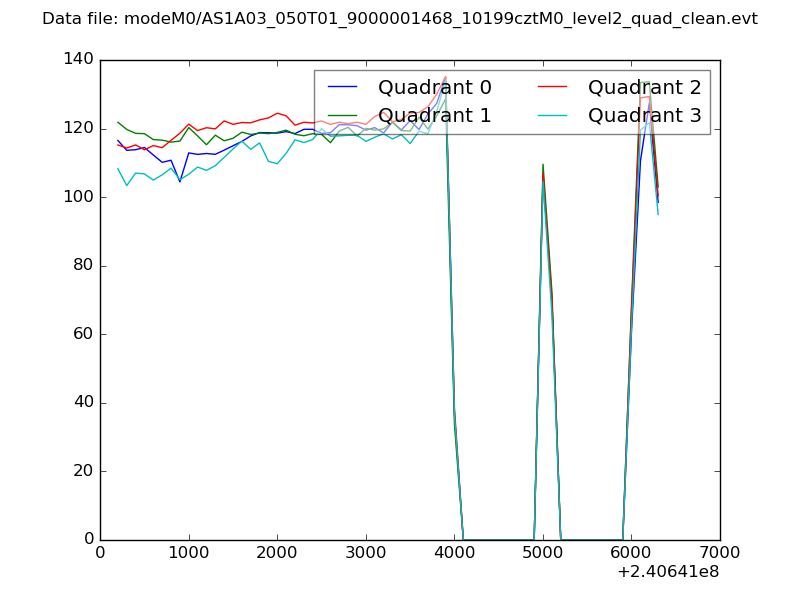 |
|
| Module-wise count rates for Quadrant A Data is divided into 100 sec bins |
 |
 |
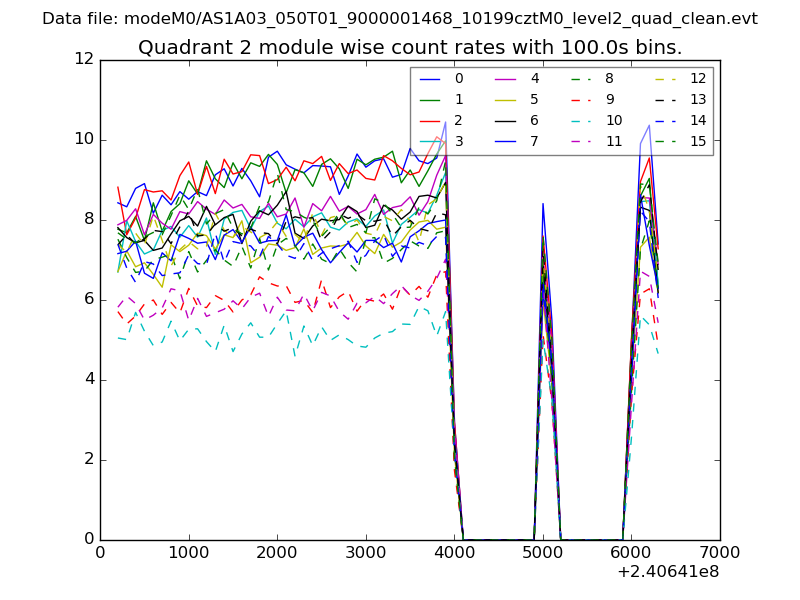
| Module-wise count rates for Quadrant B Data is divided into 100 sec bins |
 |
 |
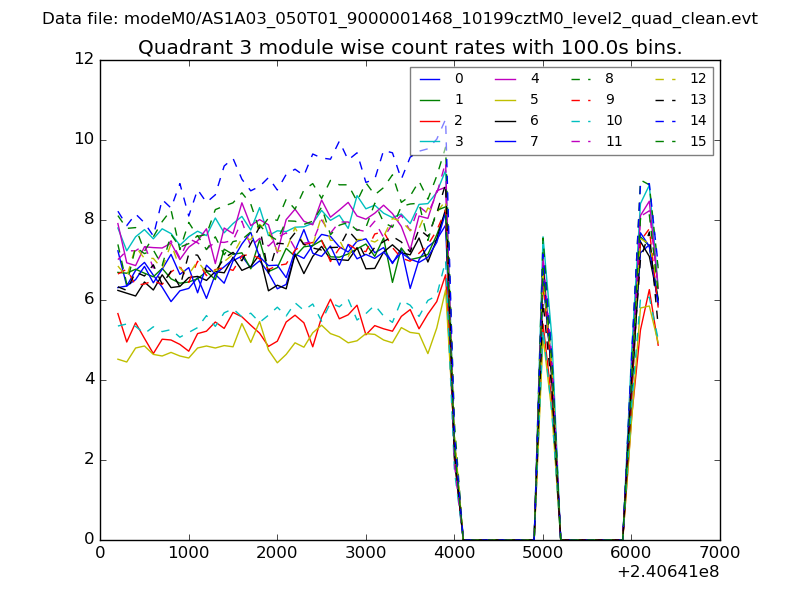
| Module-wise count rates for Quadrant C Data is divided into 100 sec bins |
 |
 |
| Module-wise count rates for Quadrant D Data is divided into 100 sec bins |
 |
 |
| Parameter | Plot |
|---|---|
| CZT HV Monitor |  |
| D_VDD | 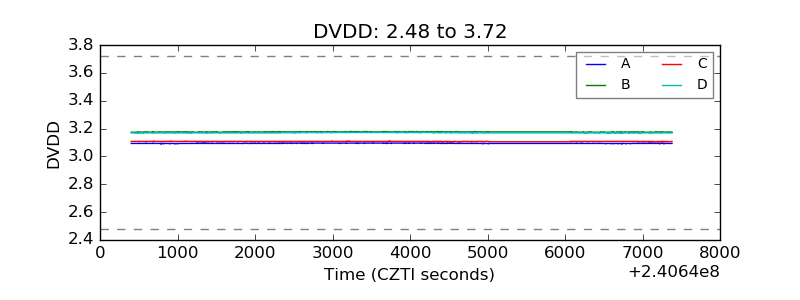 |
| Temperature 1 | 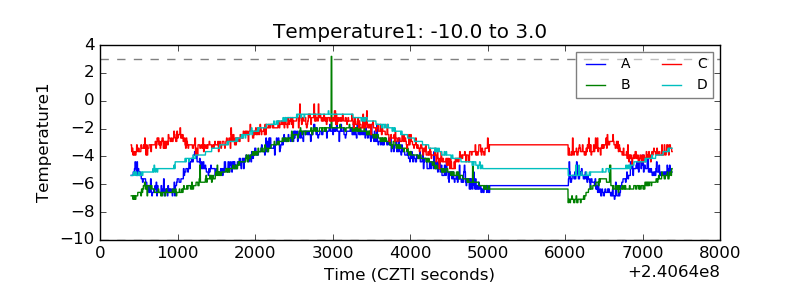 |
| Veto HV Monitor | 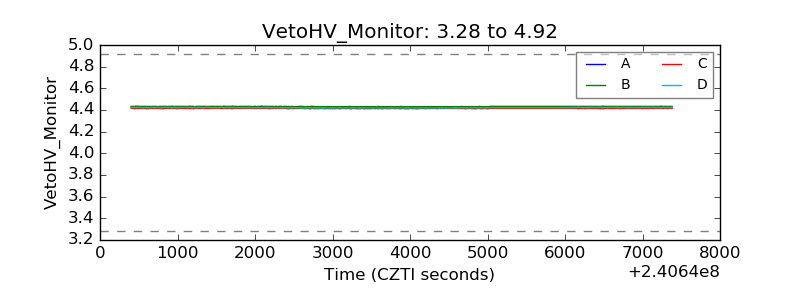 |
| Veto LLD | 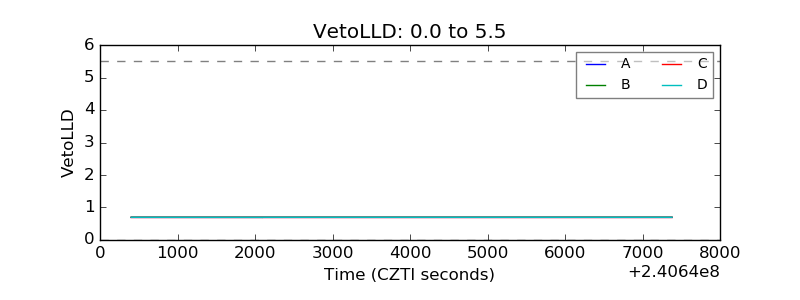 |
| Alpha Counter | 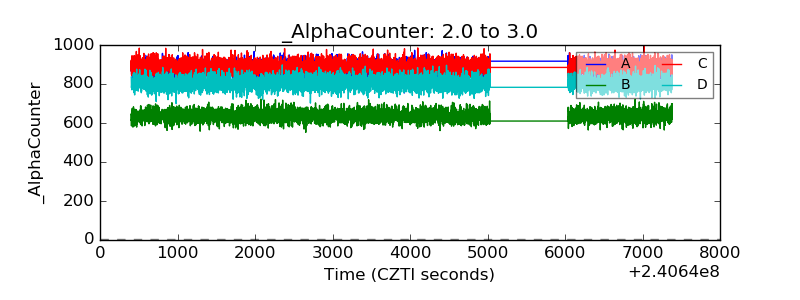 |
| _CPM_Rate | 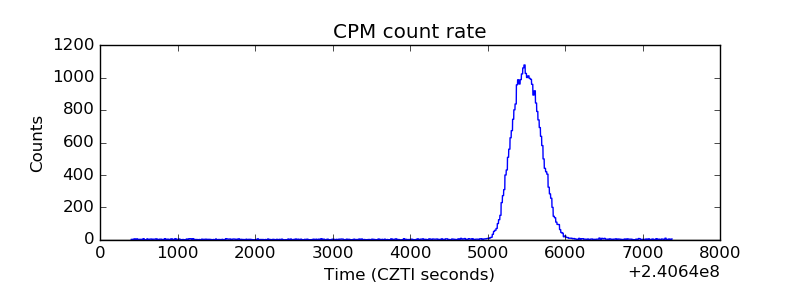 |
| CZT Counter | 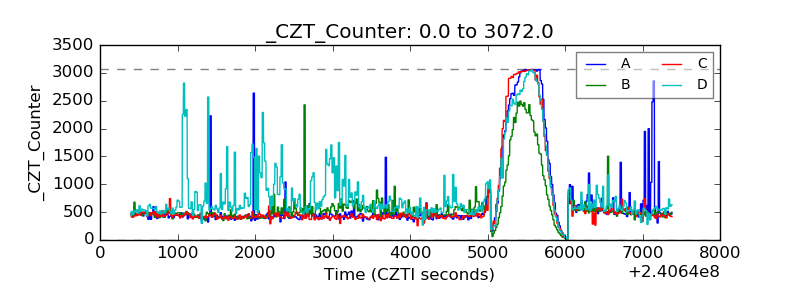 |
| +2.5 Volts monitor |  |
| +5 Volts monitor | 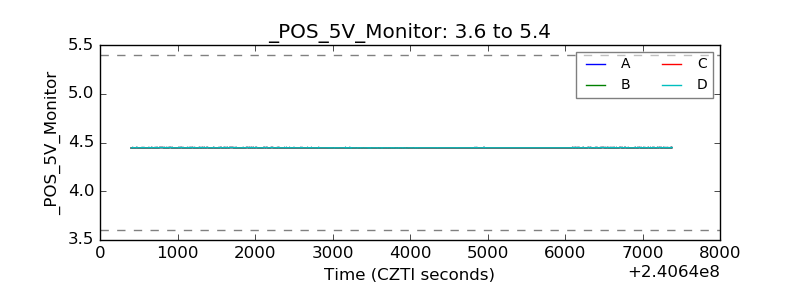 |
| _ROLL_ROT | 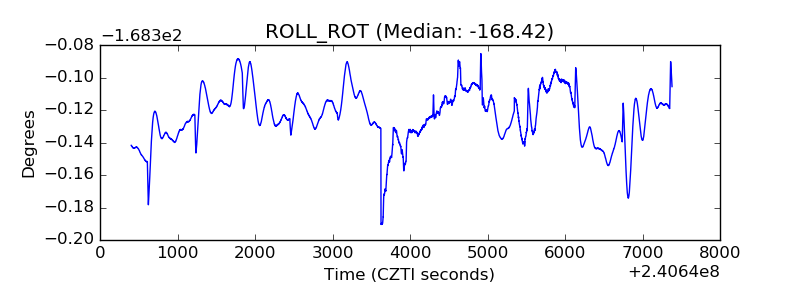 |
| _Roll_DEC | 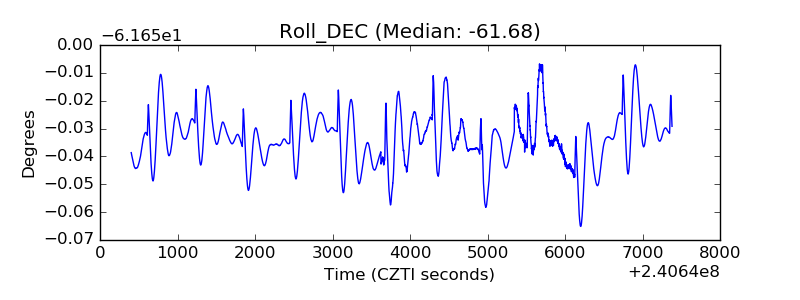 |
| _Roll_RA | 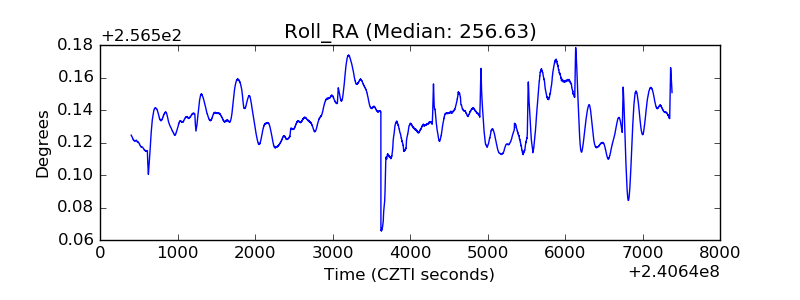 |
| Veto Counter | 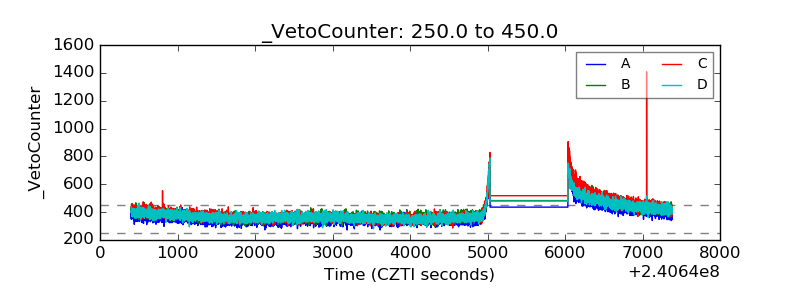 |