| Param | Original file | Final file |
|---|---|---|
| Filename | modeM0/AS1A03_050T01_9000001468_10203cztM0_level2.evt | modeM0/AS1A03_050T01_9000001468_10203cztM0_level2_quad_clean.evt |
| Size (bytes) | 548,225,280 | 137,298,240 |
| Size | 522.8 MB | 130.9 MB |
| Events in quadrant A | 3,499,084 | 935,359 |
| Events in quadrant B | 3,602,689 | 949,076 |
| Events in quadrant C | 3,254,445 | 941,749 |
| Events in quadrant D | 5,800,339 | 873,054 |
| Mode M0 | |||
|---|---|---|---|
| Quadrant | BADHDUFLAG | Total packets | Discarded packets |
| A | 0 | 14545 | 2 |
| B | 0 | 14907 | 1 |
| C | 0 | 13987 | 1 |
| D | 0 | 21933 | 1 |
| Mode M9 | |||
|---|---|---|---|
| Quadrant | BADHDUFLAG | Total packets | Discarded packets |
| A | 0 | 12 | 0 |
| B | 0 | 12 | 0 |
| C | 0 | 12 | 0 |
| D | 0 | 12 | 0 |
| Mode SS | |||
|---|---|---|---|
| Quadrant | BADHDUFLAG | Total packets | Discarded packets |
| A | 0 | 134 | 0 |
| B | 0 | 134 | 0 |
| C | 0 | 134 | 0 |
| D | 0 | 134 | 0 |
| Quadrant | Total seconds | Saturated seconds | Saturation percentage |
|---|---|---|---|
| A | 6585 | 122 | 1.852696% |
| B | 6585 | 116 | 1.761579% |
| C | 6585 | 65 | 0.987092% |
| D | 6585 | 503 | 7.638573% |
Noise dominated data is calculated using 1-second bins in cleaned event files. If a bin has >2000 counts, and if more than 50% of those come from <1% of pixels, then it is considered to be noise-dominated and hence unusable.
| Quadrant | # 1 sec bins | Bins with >0 counts | Bins with >2000 counts | High rate bins dominated by noise | Noise dominated (total time) | Noise dominated (detector-on time) | Marked lightcurve |
|---|---|---|---|---|---|---|---|
| A | 7835 | 6585 | 12 | 12 | 0.15% | 0.18% | 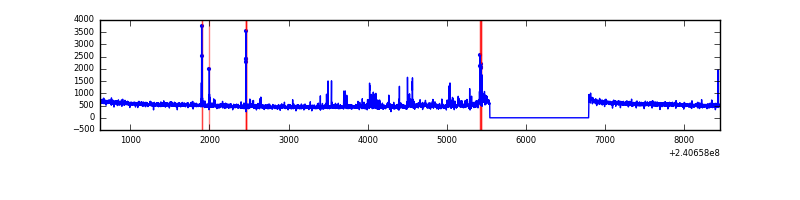 |
| B | 7835 | 6585 | 11 | 11 | 0.14% | 0.17% | 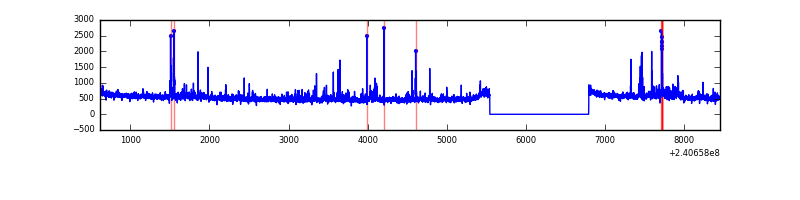 |
| C | 7835 | 6585 | 0 | 0 | 0.00% | 0.00% | 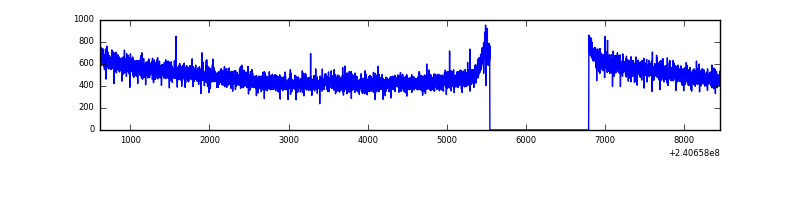 |
| D | 7835 | 6585 | 392 | 392 | 5.00% | 5.95% | 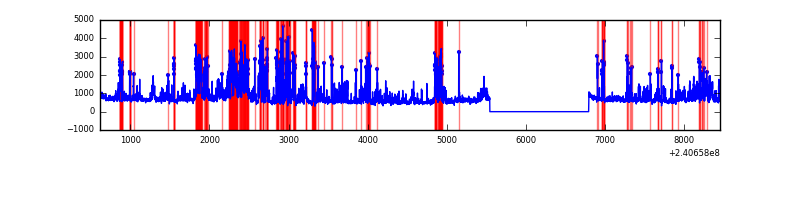 |
Top three noisy pixels from each quadrant. If the there are fewer than three noisy pixels in the level2.evt file, extra rows are filled as -1
| Pixel properties | Quadrant properties | ||||||
|---|---|---|---|---|---|---|---|
| Quadrant | DetID | PixID | Counts | Sigma | Mean | Median | Sigma |
| A | 8 | 15 | 84912 | 493.24 | 856 | 840 | 170.4 |
| A | 15 | 223 | 74337 | 431.19 | 856 | 840 | 170.4 |
| A | 15 | 239 | 34897 | 199.81 | 856 | 840 | 170.4 |
| B | 4 | 239 | 105184 | 664.97 | 849 | 829 | 156.9 |
| B | 0 | 214 | 69027 | 434.57 | 849 | 829 | 156.9 |
| B | 5 | 255 | 42245 | 263.91 | 849 | 829 | 156.9 |
| C | 4 | 175 | 12949 | 65.19 | 827 | 833 | 185.9 |
| C | 14 | 67 | 12469 | 62.6 | 827 | 833 | 185.9 |
| C | 13 | 61 | 6209 | 28.92 | 827 | 833 | 185.9 |
| D | 1 | 52 | 1504182 | 7135.28 | 806 | 795 | 210.7 |
| D | 6 | 112 | 523128 | 2479.06 | 806 | 795 | 210.7 |
| D | 8 | 195 | 356587 | 1688.64 | 806 | 795 | 210.7 |
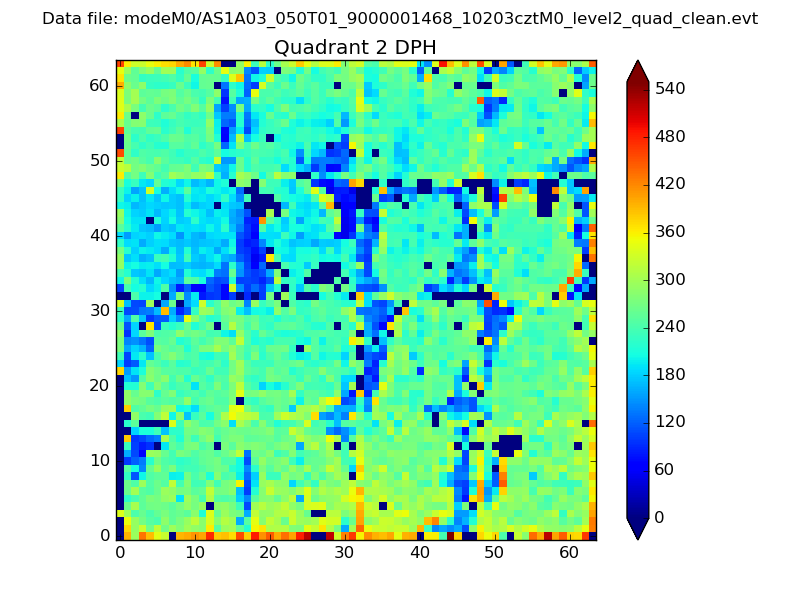
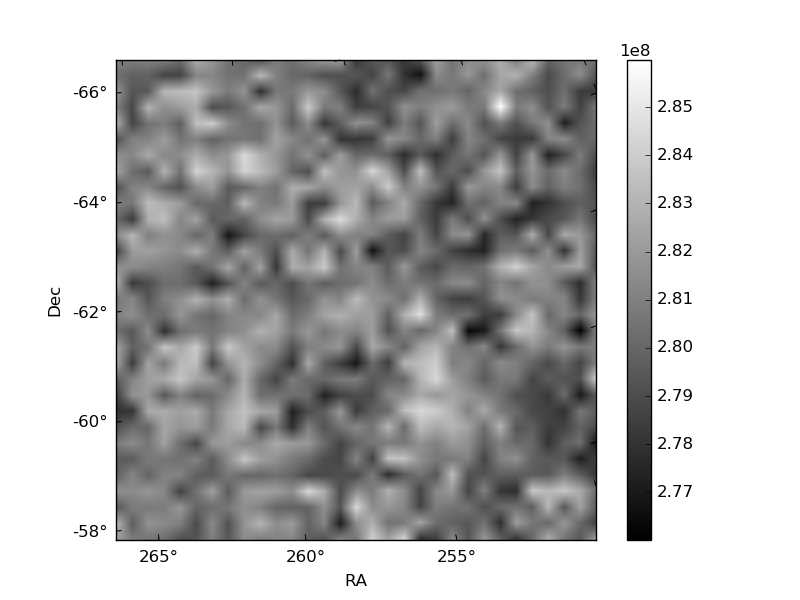
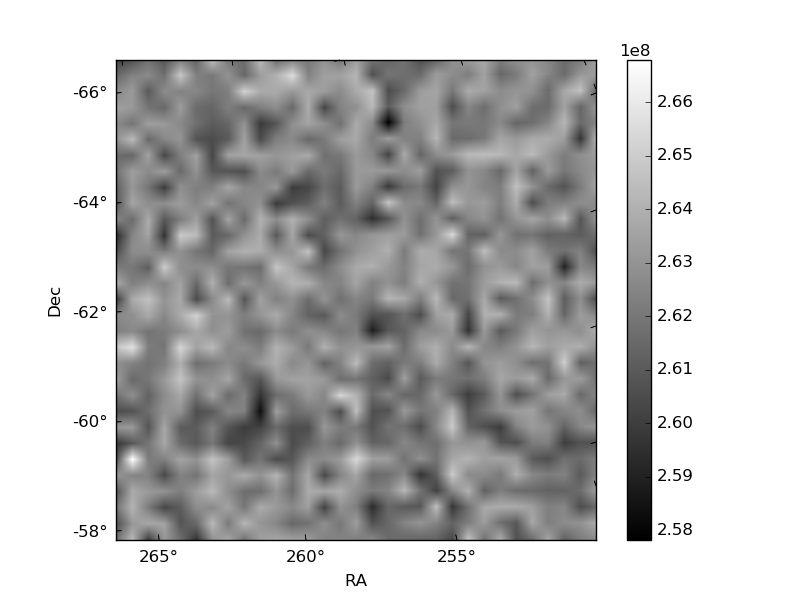
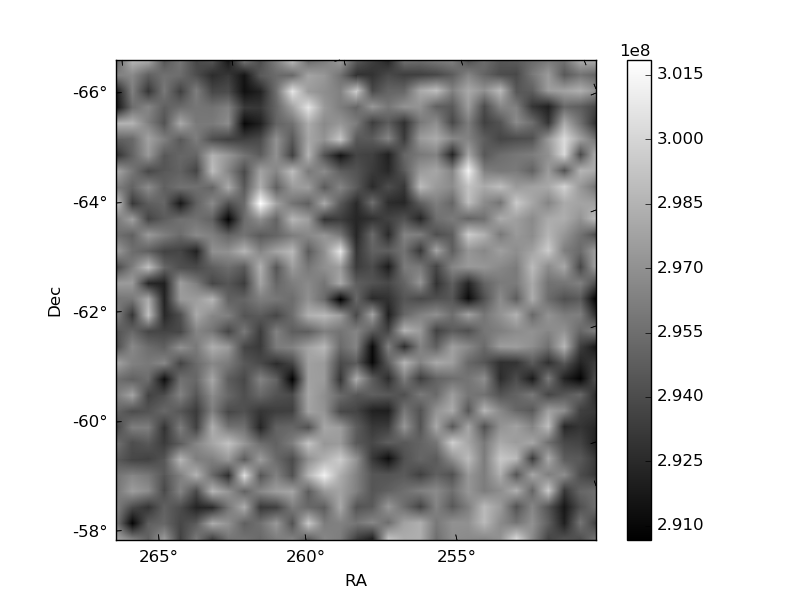
Histogram calculated using DETX and DETY for each event in the final _common_clean file
| Quadrant A | 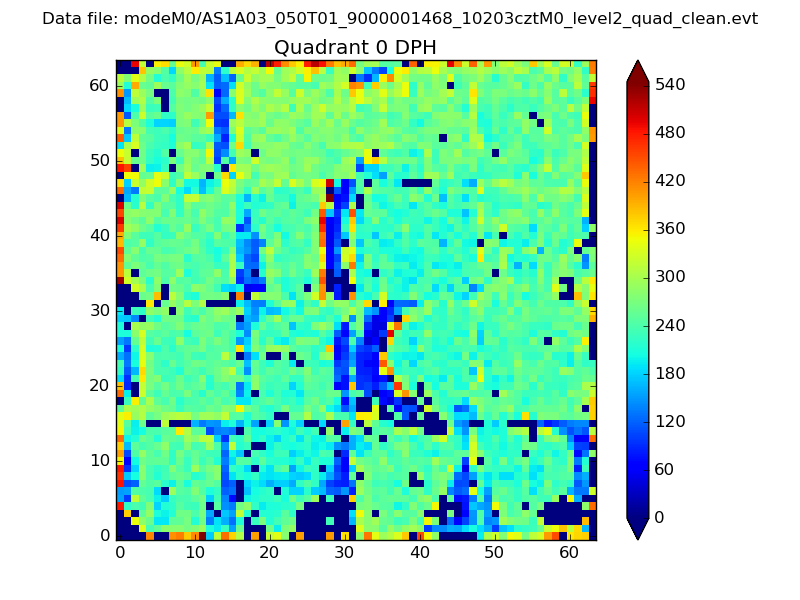 |
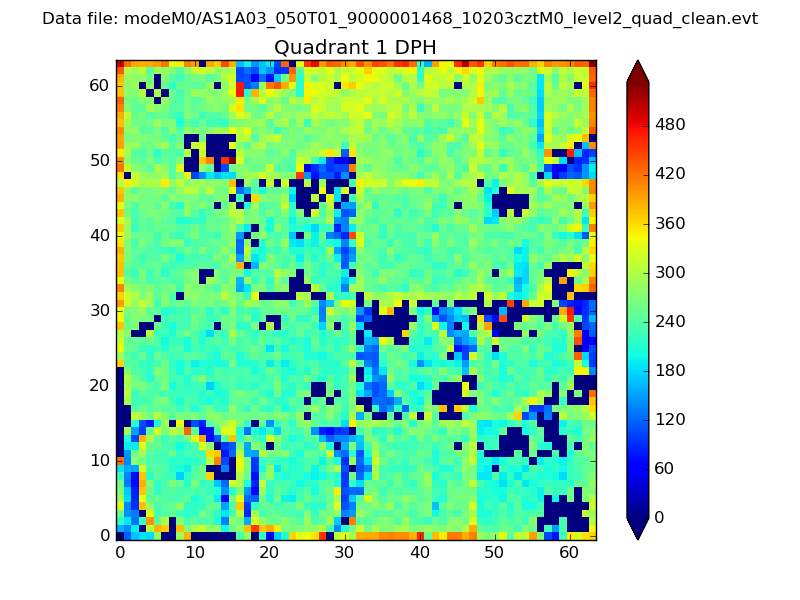 |
Quadrant B |
|---|---|---|---|
| Quadrant D | 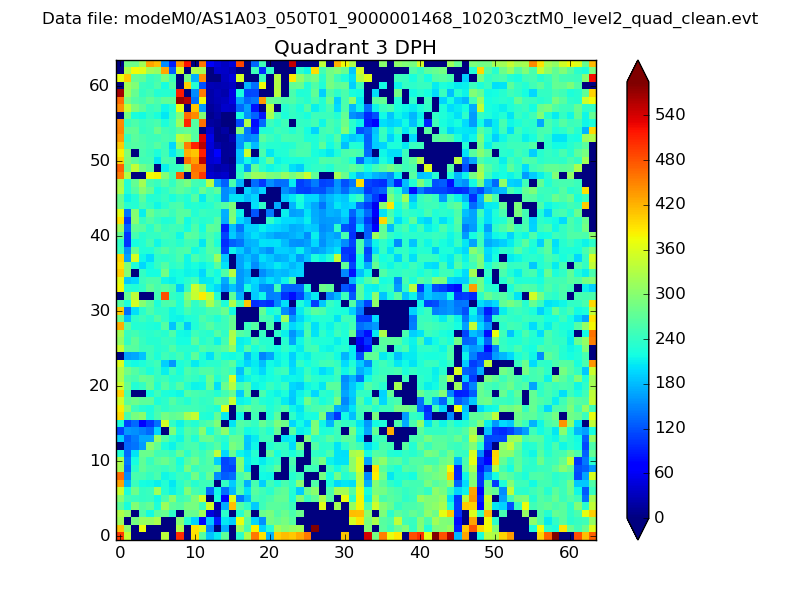 |
 |
Quadrant C |
| Plot type | Count rate plots | Images |
|---|---|---|
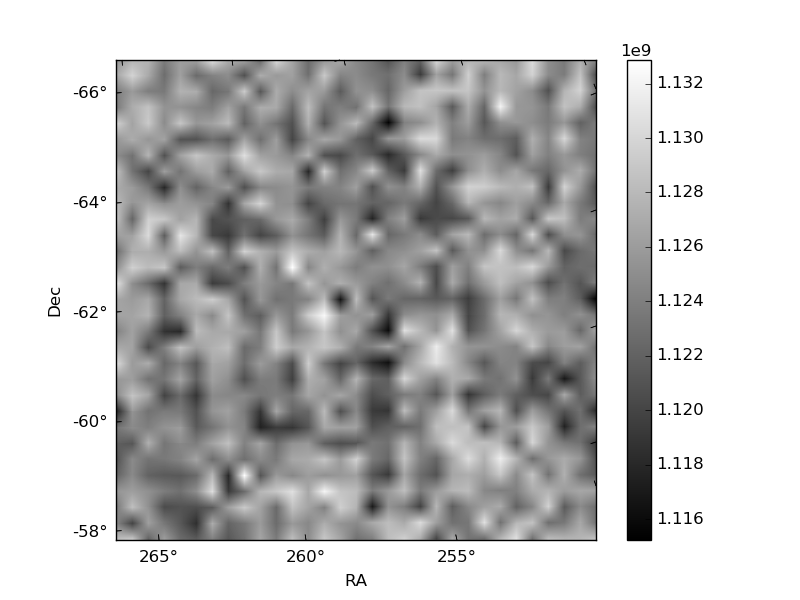
| Comparison with Poisson distribution Blue bars denote a histogram of data divided into 1 sec bins. Red curve is a Poisson curve with rate = median count rate of data. |
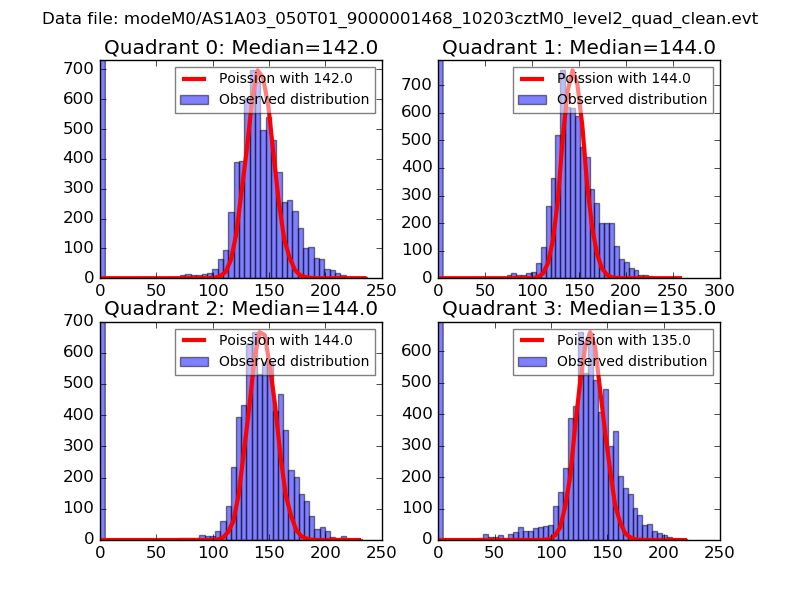 |
 |
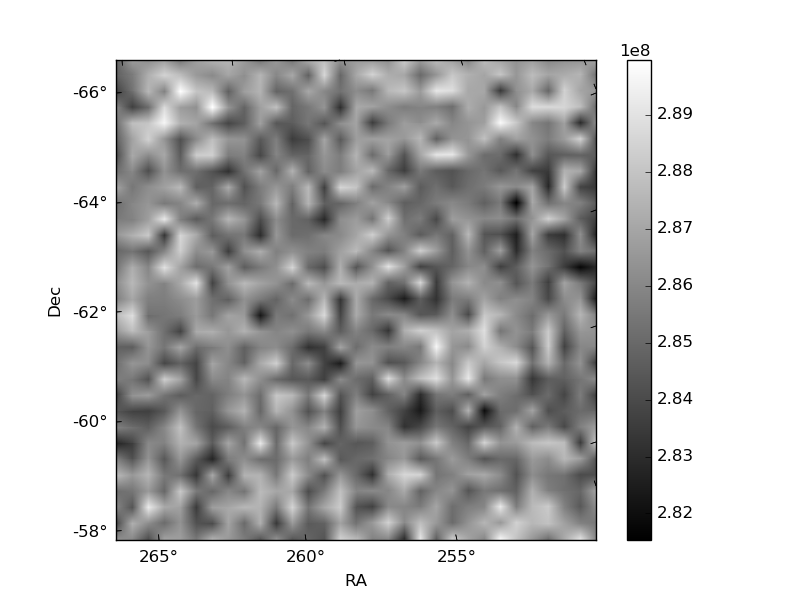
| Quadrant-wise count rates Data is divided into 100 sec bins |
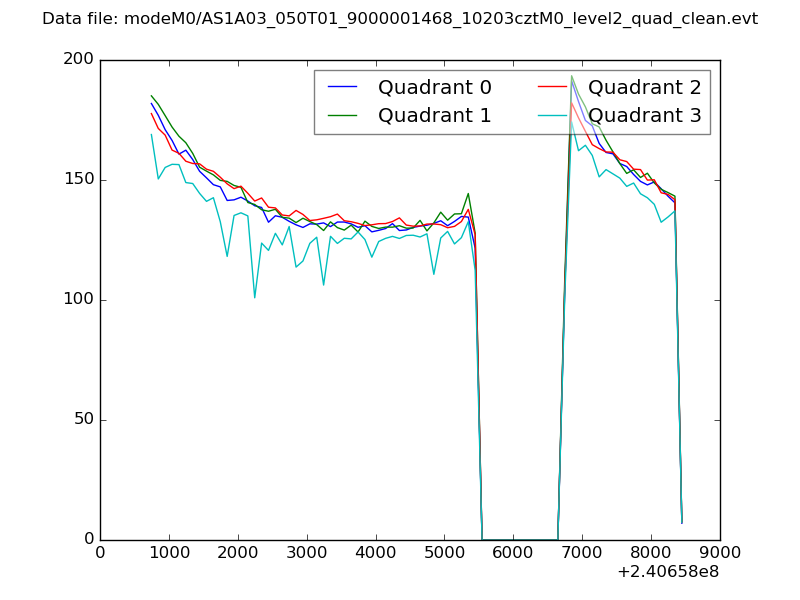 |
|
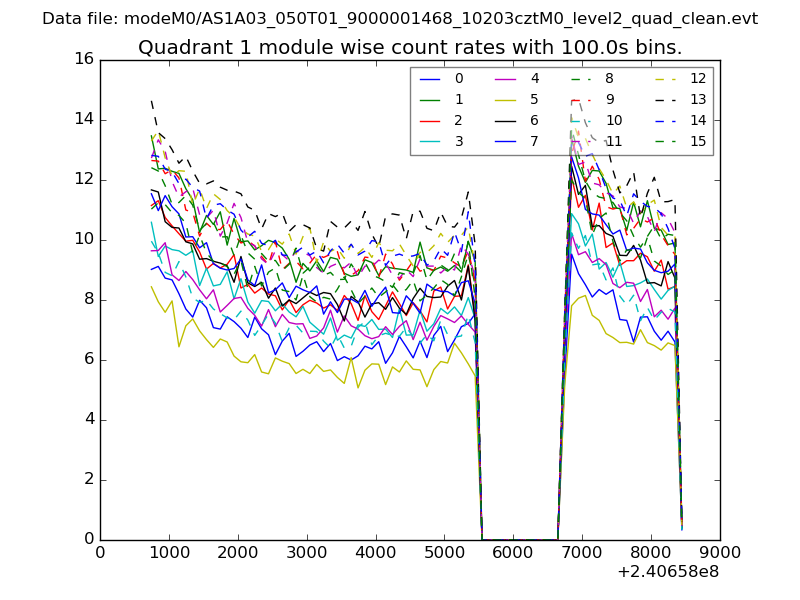
| Module-wise count rates for Quadrant A Data is divided into 100 sec bins |
 |
 |
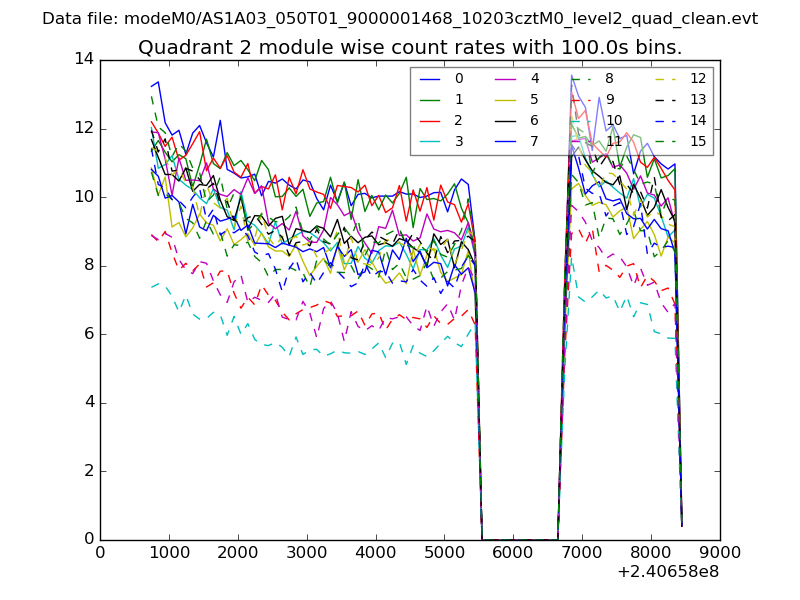
| Module-wise count rates for Quadrant B Data is divided into 100 sec bins |
 |
 |
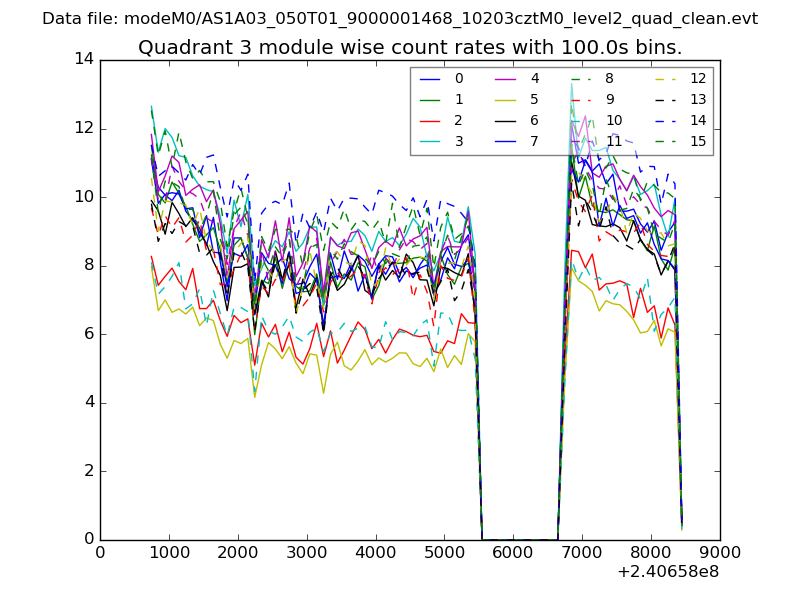
| Module-wise count rates for Quadrant C Data is divided into 100 sec bins |
 |
 |
| Module-wise count rates for Quadrant D Data is divided into 100 sec bins |
 |
 |
| Parameter | Plot |
|---|---|
| CZT HV Monitor | 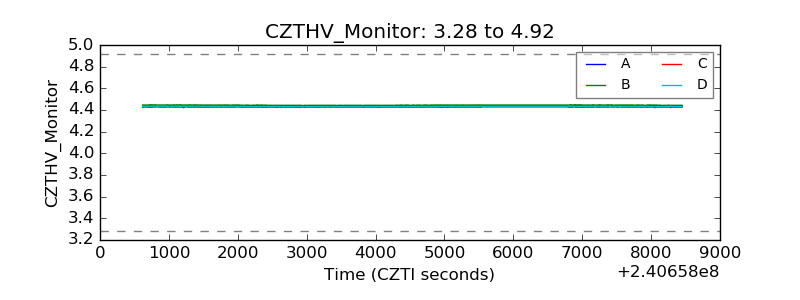 |
| D_VDD | 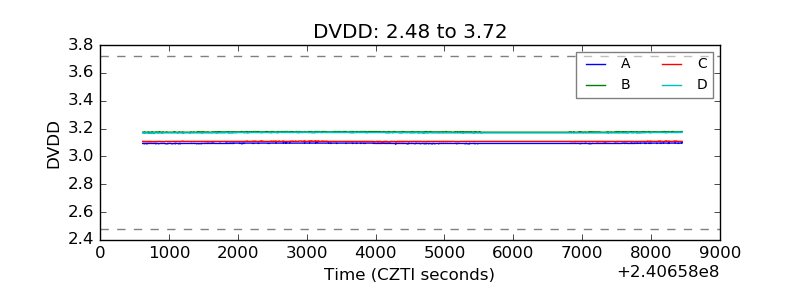 |
| Temperature 1 |  |
| Veto HV Monitor | 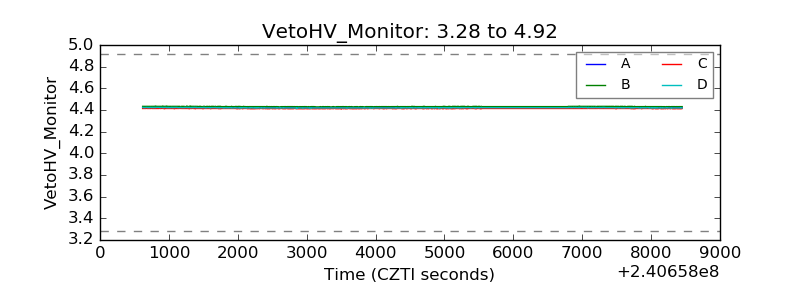 |
| Veto LLD | 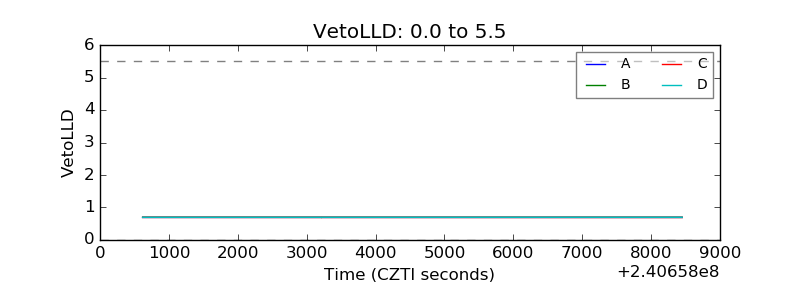 |
| Alpha Counter | 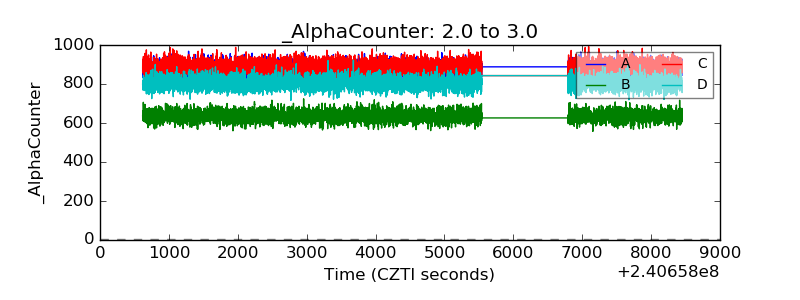 |
| _CPM_Rate | 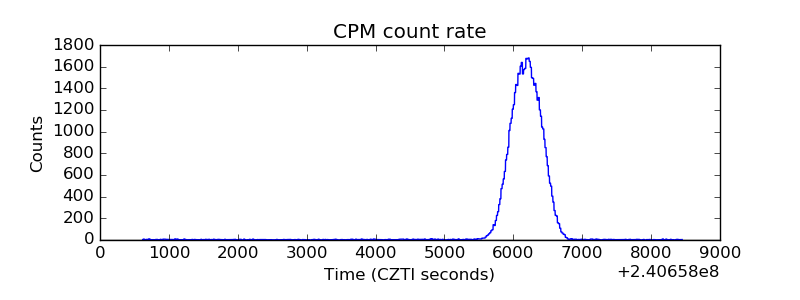 |
| CZT Counter | 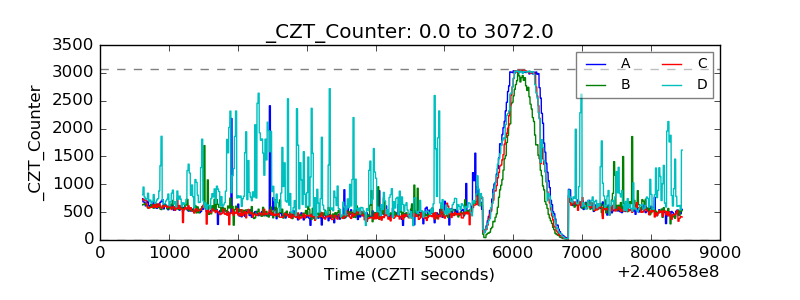 |
| +2.5 Volts monitor |  |
| +5 Volts monitor |  |
| _ROLL_ROT | 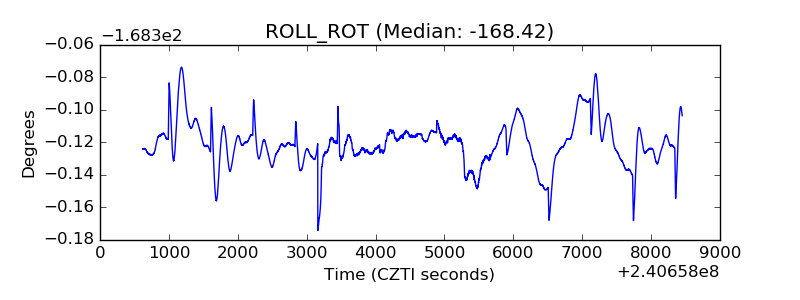 |
| _Roll_DEC |  |
| _Roll_RA | 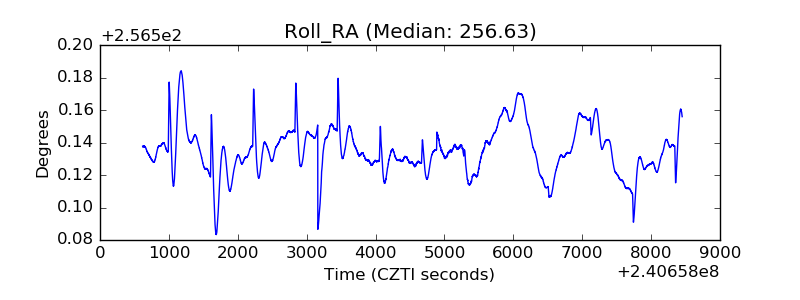 |
| Veto Counter | 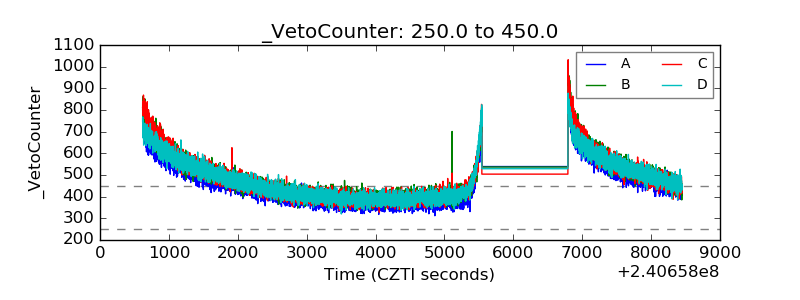 |