| Param | Original file | Final file |
|---|---|---|
| Filename | modeM0/AS1A03_050T01_9000001468_10204cztM0_level2.evt | modeM0/AS1A03_050T01_9000001468_10204cztM0_level2_quad_clean.evt |
| Size (bytes) | 461,257,920 | 112,469,760 |
| Size | 439.9 MB | 107.3 MB |
| Events in quadrant A | 2,827,910 | 764,963 |
| Events in quadrant B | 3,093,320 | 766,611 |
| Events in quadrant C | 2,656,199 | 765,096 |
| Events in quadrant D | 5,005,745 | 712,005 |
| Mode M0 | |||
|---|---|---|---|
| Quadrant | BADHDUFLAG | Total packets | Discarded packets |
| A | 0 | 11958 | 2 |
| B | 0 | 12868 | 1 |
| C | 0 | 11650 | 1 |
| D | 0 | 18787 | 1 |
| Mode M9 | |||
|---|---|---|---|
| Quadrant | BADHDUFLAG | Total packets | Discarded packets |
| A | 0 | 13 | 0 |
| B | 0 | 13 | 0 |
| C | 0 | 13 | 0 |
| D | 0 | 13 | 0 |
| Mode SS | |||
|---|---|---|---|
| Quadrant | BADHDUFLAG | Total packets | Discarded packets |
| A | 0 | 116 | 0 |
| B | 0 | 116 | 0 |
| C | 0 | 116 | 0 |
| D | 0 | 116 | 0 |
| Quadrant | Total seconds | Saturated seconds | Saturation percentage |
|---|---|---|---|
| A | 5686 | 63 | 1.107985% |
| B | 5686 | 74 | 1.301442% |
| C | 5686 | 32 | 0.562786% |
| D | 5686 | 356 | 6.260992% |
Noise dominated data is calculated using 1-second bins in cleaned event files. If a bin has >2000 counts, and if more than 50% of those come from <1% of pixels, then it is considered to be noise-dominated and hence unusable.
| Quadrant | # 1 sec bins | Bins with >0 counts | Bins with >2000 counts | High rate bins dominated by noise | Noise dominated (total time) | Noise dominated (detector-on time) | Marked lightcurve |
|---|---|---|---|---|---|---|---|
| A | 7016 | 5687 | 6 | 6 | 0.09% | 0.11% | 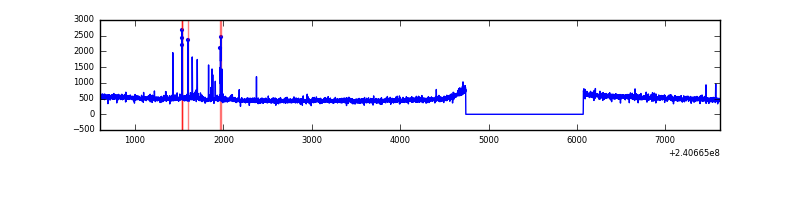 |
| B | 7016 | 5687 | 14 | 14 | 0.20% | 0.25% | 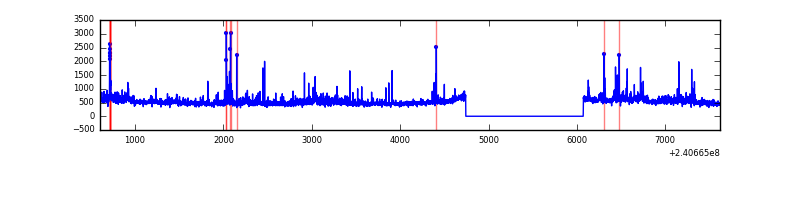 |
| C | 7016 | 5687 | 0 | 0 | 0.00% | 0.00% | 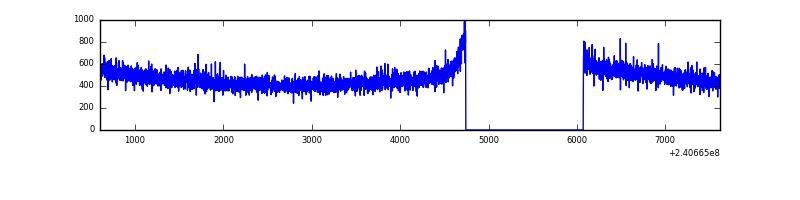 |
| D | 7016 | 5687 | 262 | 262 | 3.73% | 4.61% | 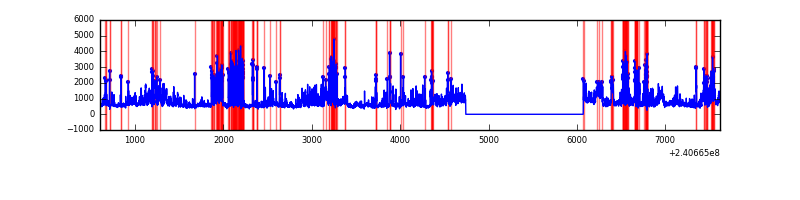 |
Top three noisy pixels from each quadrant. If the there are fewer than three noisy pixels in the level2.evt file, extra rows are filled as -1
| Pixel properties | Quadrant properties | ||||||
|---|---|---|---|---|---|---|---|
| Quadrant | DetID | PixID | Counts | Sigma | Mean | Median | Sigma |
| A | 8 | 15 | 102582 | 712.16 | 707 | 693 | 143.1 |
| A | 0 | 226 | 6748 | 42.32 | 707 | 693 | 143.1 |
| A | 12 | 194 | 6095 | 37.76 | 707 | 693 | 143.1 |
| B | 0 | 214 | 104150 | 796.94 | 700 | 685 | 129.8 |
| B | 11 | 51 | 89403 | 683.35 | 700 | 685 | 129.8 |
| B | 4 | 239 | 81398 | 621.69 | 700 | 685 | 129.8 |
| C | 14 | 67 | 9194 | 55.61 | 676 | 679 | 153.1 |
| C | 4 | 175 | 7132 | 42.14 | 676 | 679 | 153.1 |
| C | 13 | 61 | 5080 | 28.74 | 676 | 679 | 153.1 |
| D | 1 | 52 | 912890 | 5780.87 | 667 | 649 | 157.8 |
| D | 2 | 16 | 778114 | 4926.8 | 667 | 649 | 157.8 |
| D | 13 | 122 | 205045 | 1295.26 | 667 | 649 | 157.8 |
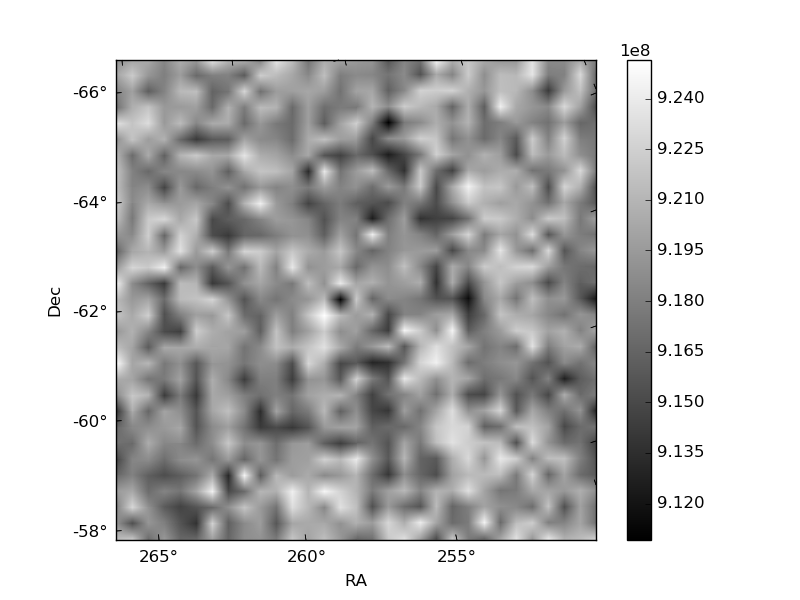
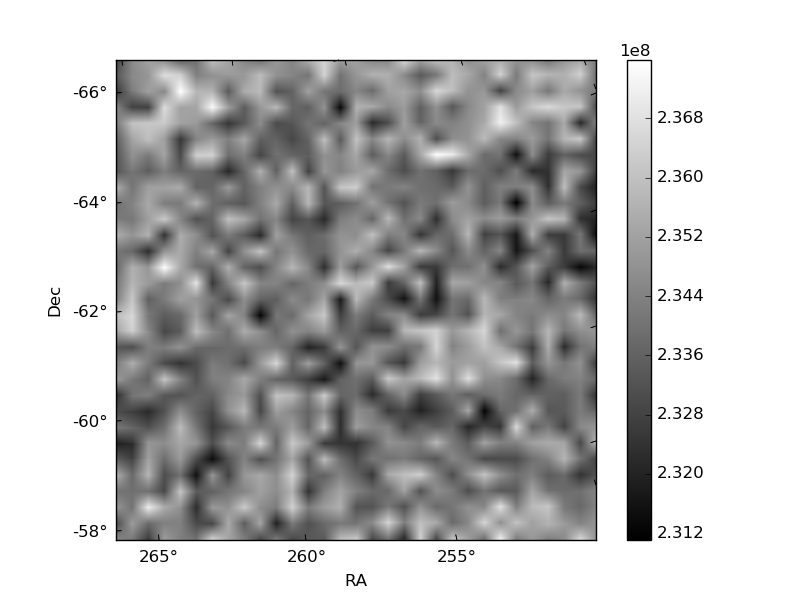
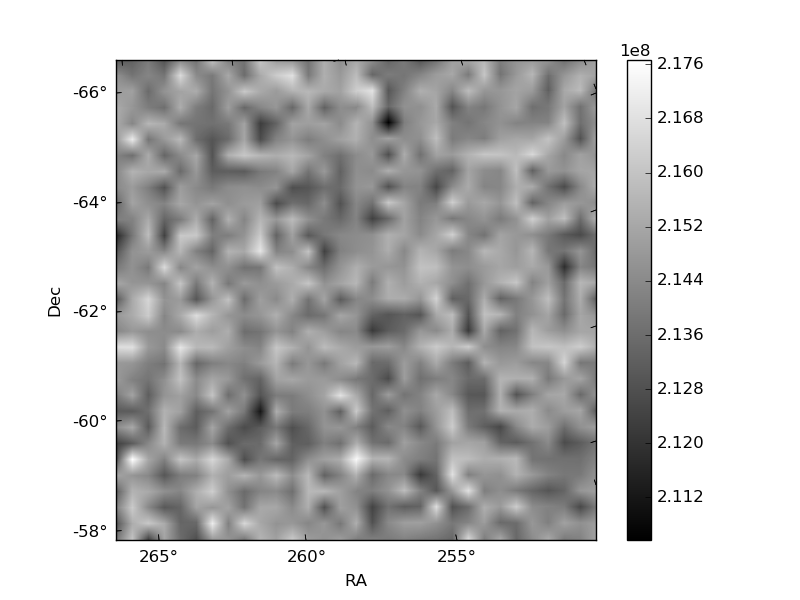
Histogram calculated using DETX and DETY for each event in the final _common_clean file
| Quadrant A | 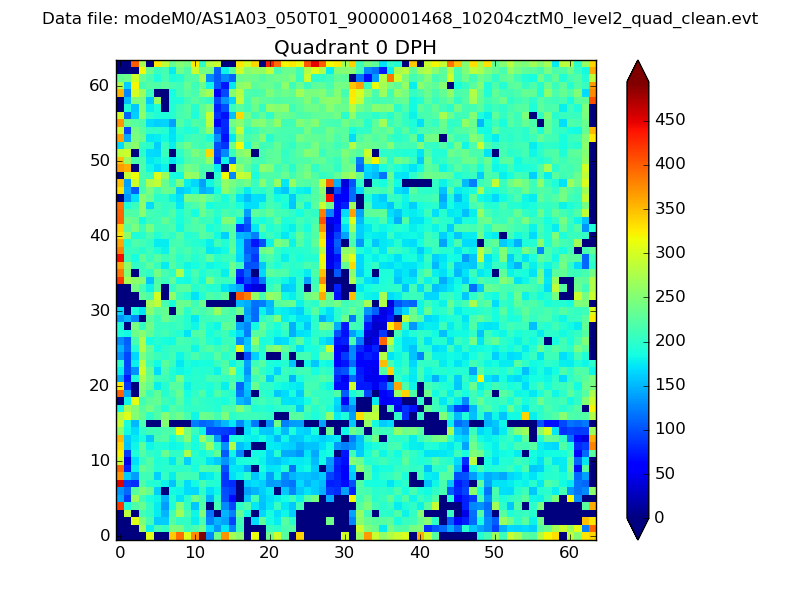 |
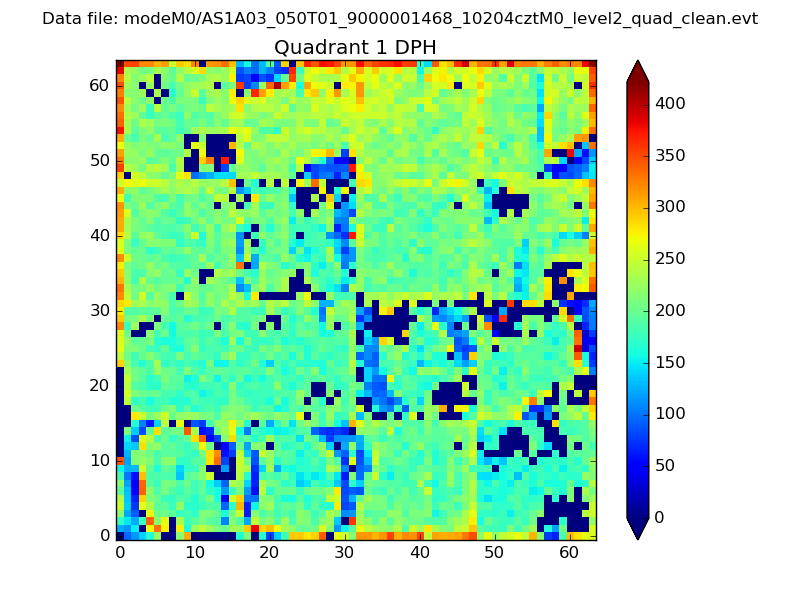 |
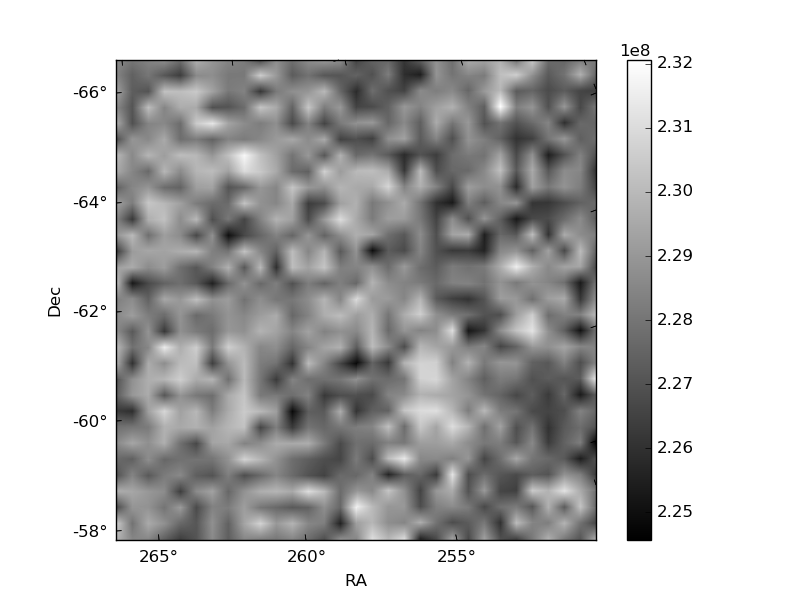
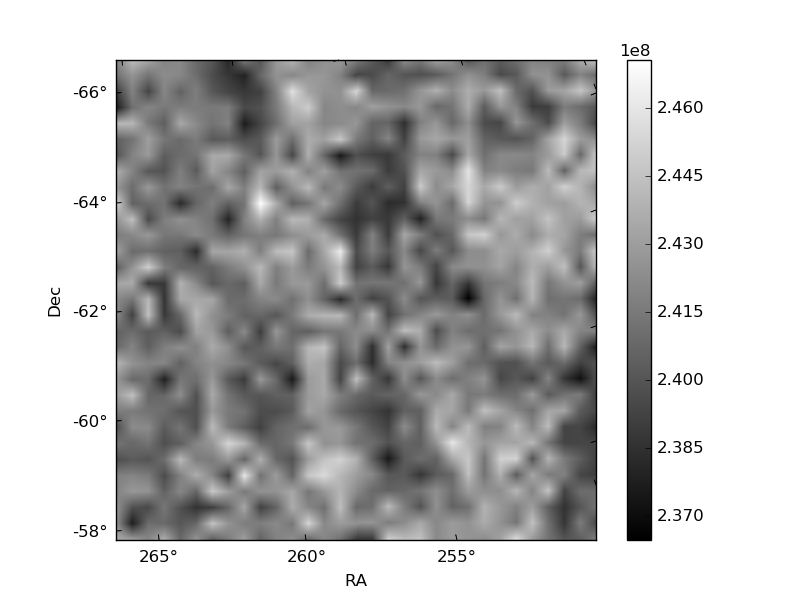
Quadrant B |
|---|---|---|---|
| Quadrant D | 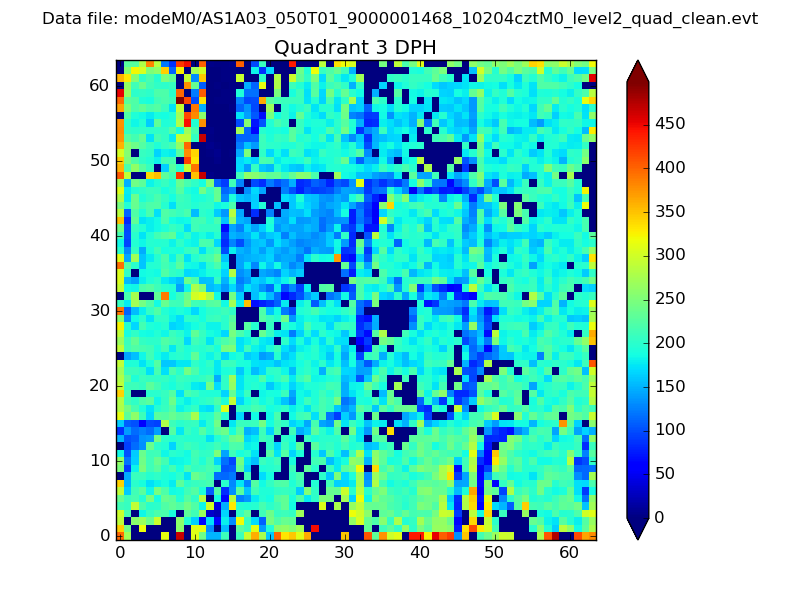 |
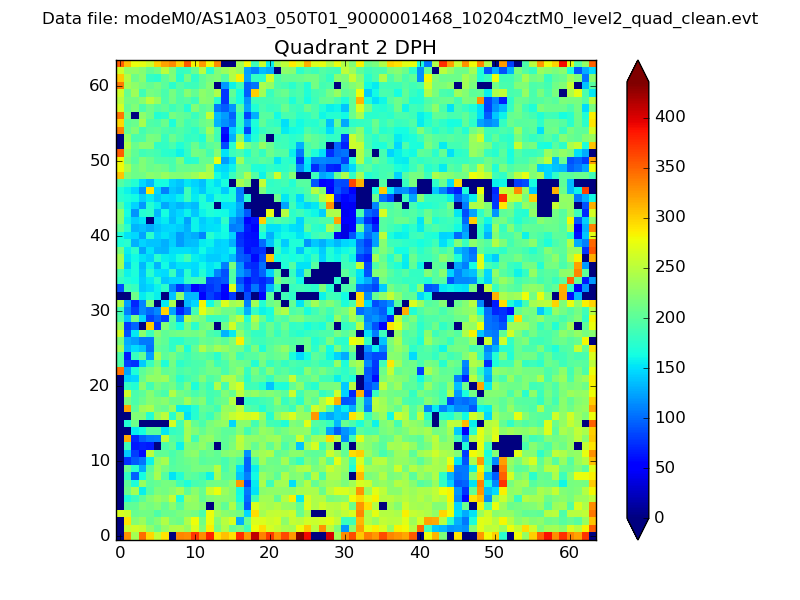 |
Quadrant C |
| Plot type | Count rate plots | Images |
|---|---|---|
| Comparison with Poisson distribution Blue bars denote a histogram of data divided into 1 sec bins. Red curve is a Poisson curve with rate = median count rate of data. |
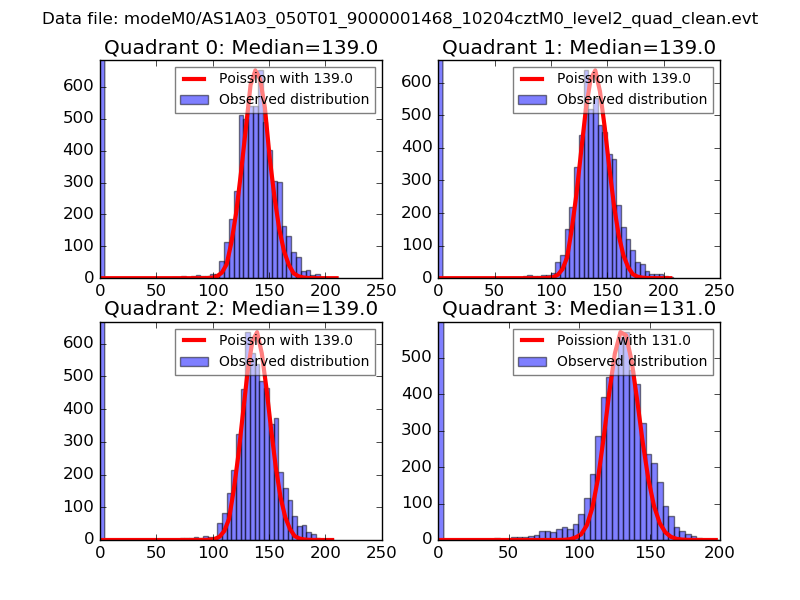 |
 |
| Quadrant-wise count rates Data is divided into 100 sec bins |
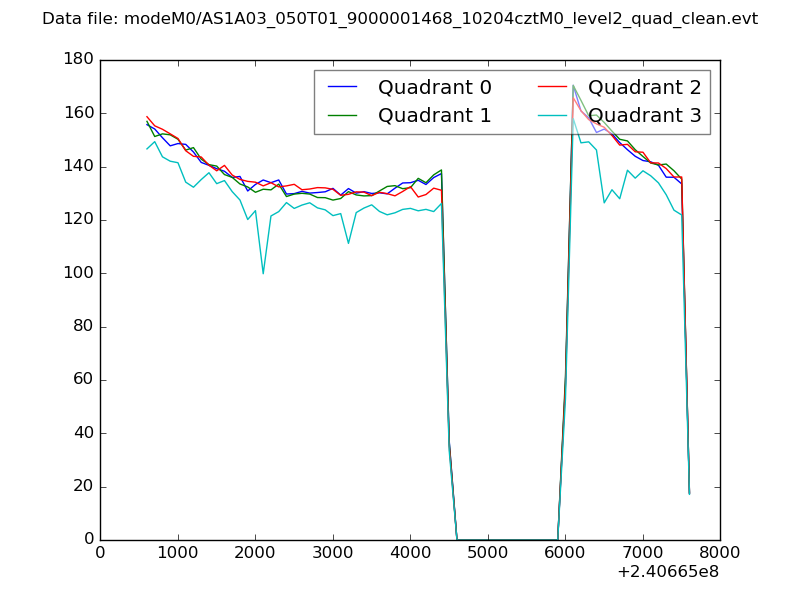 |
|
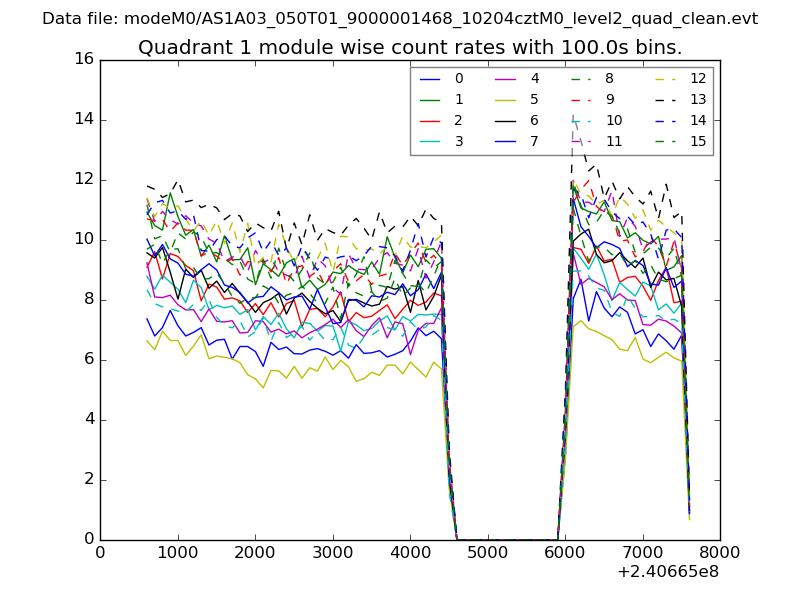
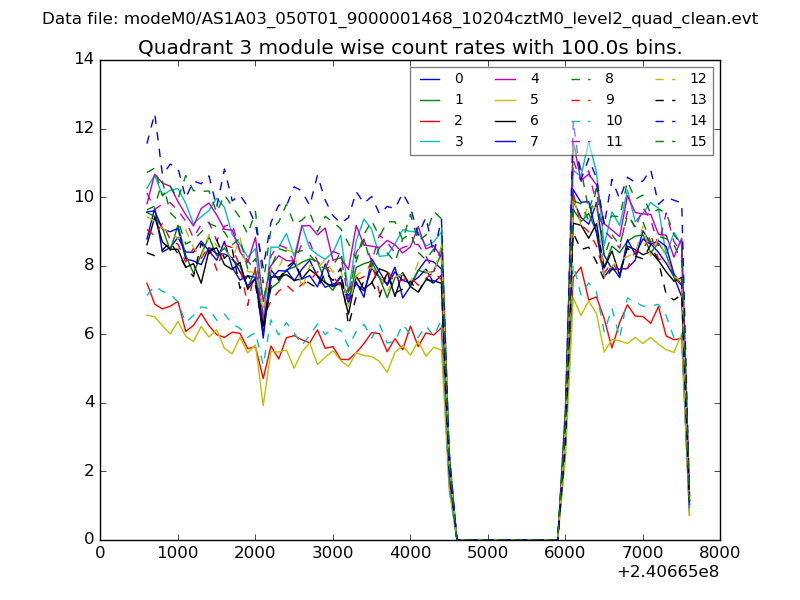
| Module-wise count rates for Quadrant A Data is divided into 100 sec bins |
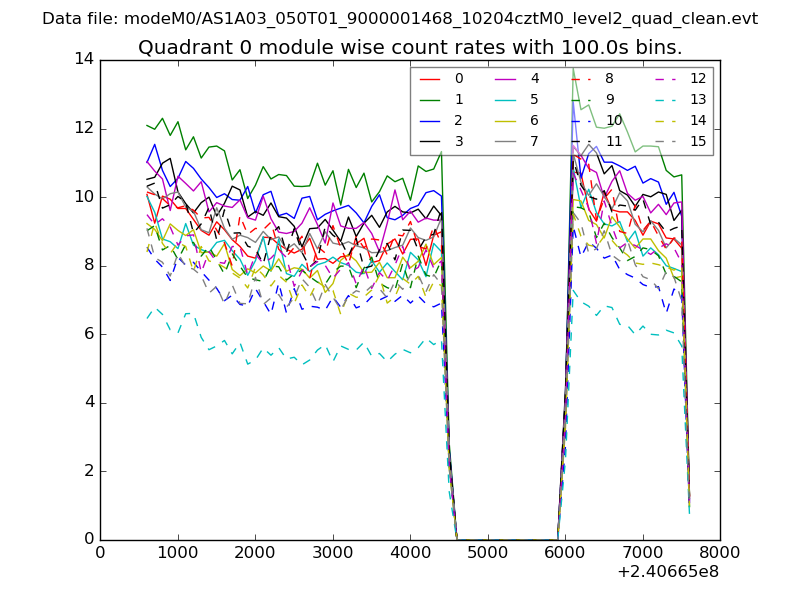 |
 |
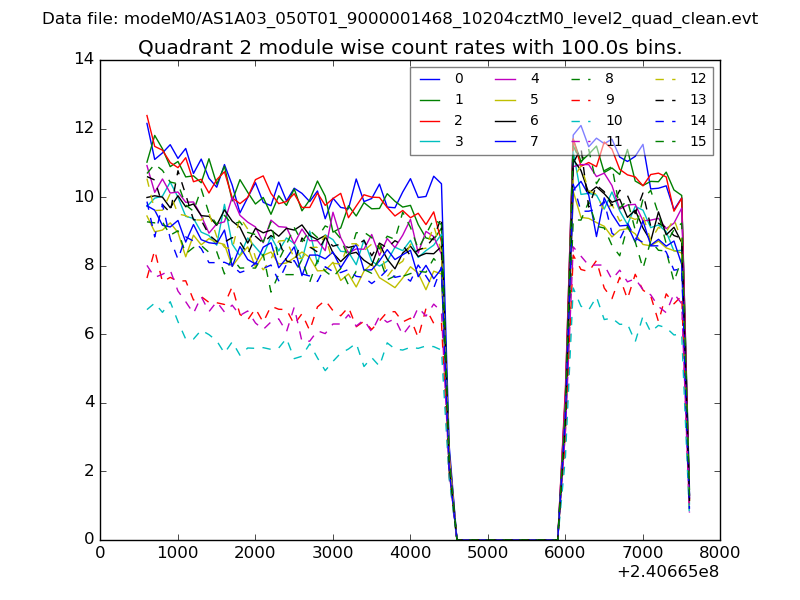
| Module-wise count rates for Quadrant B Data is divided into 100 sec bins |
 |
 |
| Module-wise count rates for Quadrant C Data is divided into 100 sec bins |
 |
 |
| Module-wise count rates for Quadrant D Data is divided into 100 sec bins |
 |
 |
| Parameter | Plot |
|---|---|
| CZT HV Monitor | 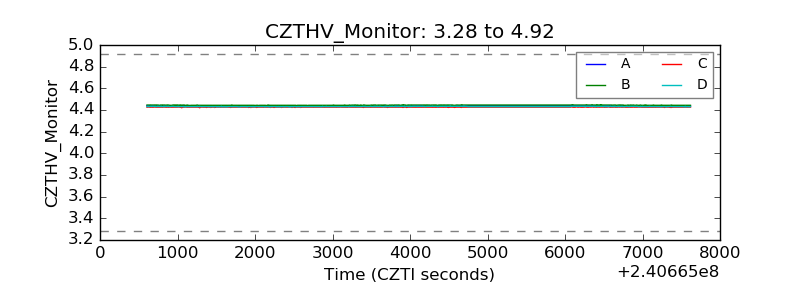 |
| D_VDD | 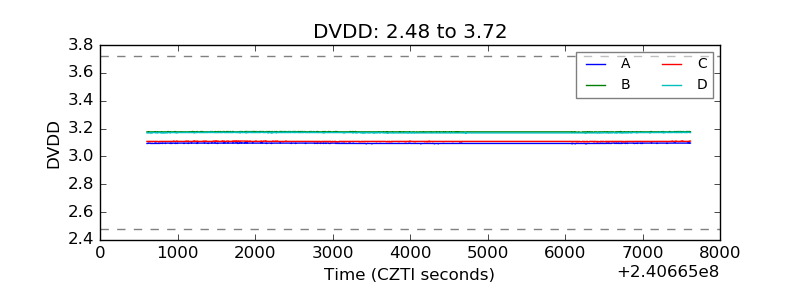 |
| Temperature 1 |  |
| Veto HV Monitor |  |
| Veto LLD | 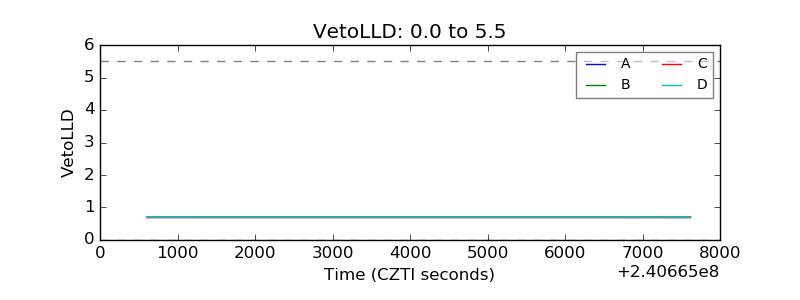 |
| Alpha Counter | 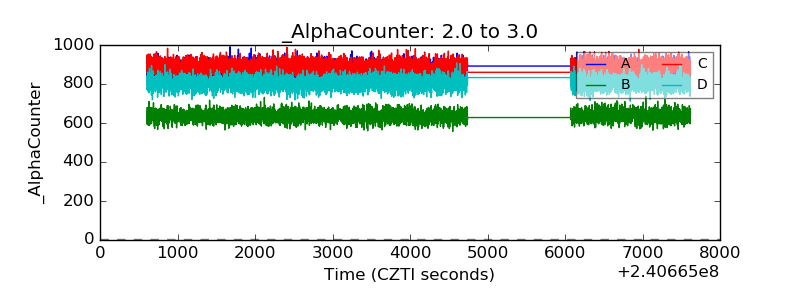 |
| _CPM_Rate | 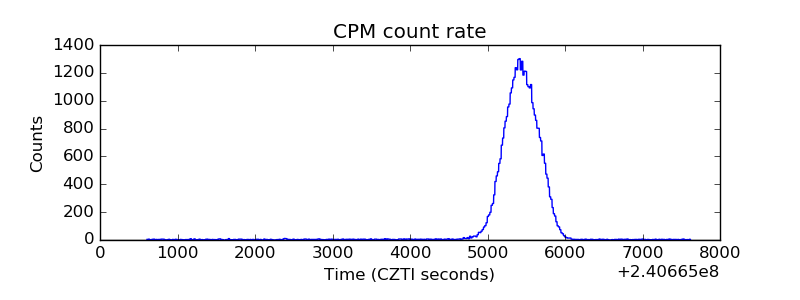 |
| CZT Counter | 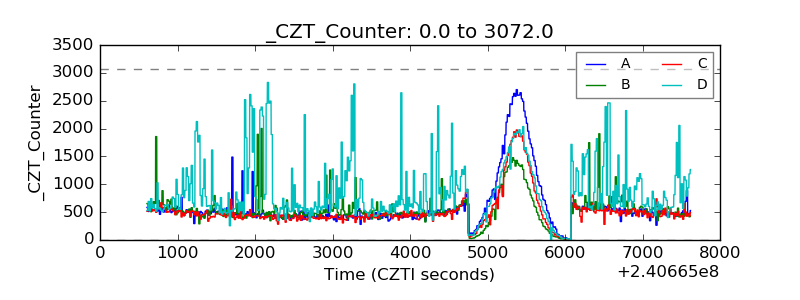 |
| +2.5 Volts monitor |  |
| +5 Volts monitor | 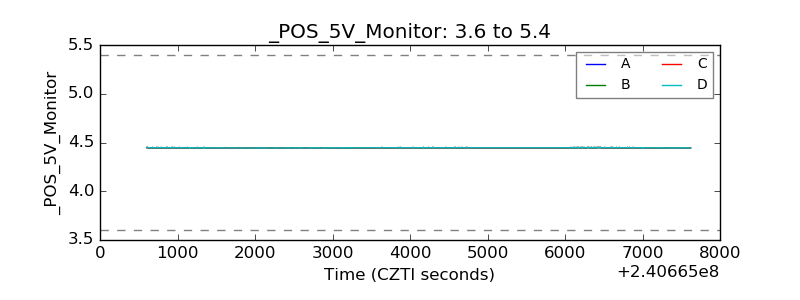 |
| _ROLL_ROT | 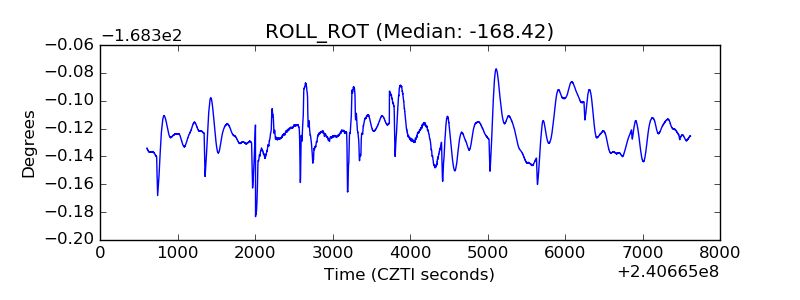 |
| _Roll_DEC | 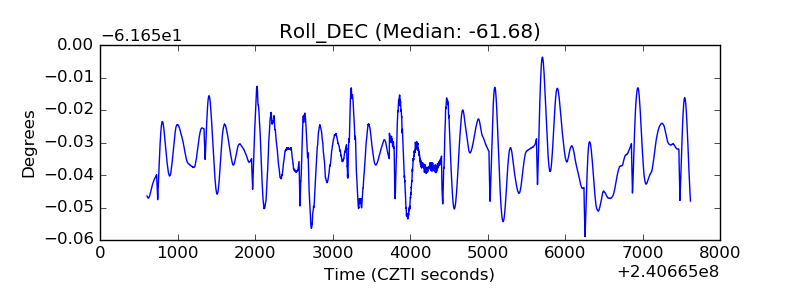 |
| _Roll_RA | 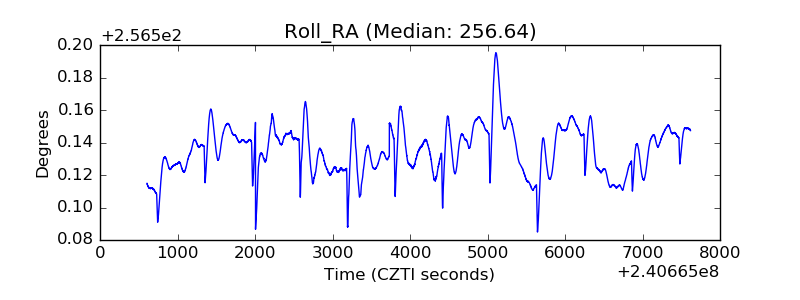 |
| Veto Counter | 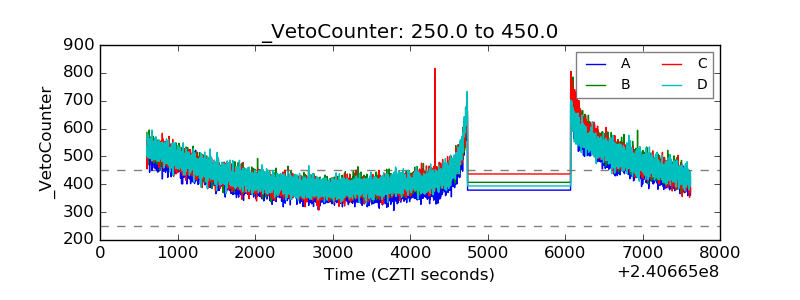 |