| Param | Original file | Final file |
|---|---|---|
| Filename | modeM0/AS1A03_050T01_9000001468_10205cztM0_level2.evt | modeM0/AS1A03_050T01_9000001468_10205cztM0_level2_quad_clean.evt |
| Size (bytes) | 435,398,400 | 101,237,760 |
| Size | 415.2 MB | 96.5 MB |
| Events in quadrant A | 3,155,108 | 663,799 |
| Events in quadrant B | 2,993,572 | 677,963 |
| Events in quadrant C | 2,612,120 | 676,425 |
| Events in quadrant D | 4,030,400 | 641,763 |
| Mode M0 | |||
|---|---|---|---|
| Quadrant | BADHDUFLAG | Total packets | Discarded packets |
| A | 0 | 13204 | 2 |
| B | 0 | 12591 | 1 |
| C | 0 | 11875 | 1 |
| D | 0 | 15882 | 1 |
| Mode M9 | |||
|---|---|---|---|
| Quadrant | BADHDUFLAG | Total packets | Discarded packets |
| A | 0 | 13 | 0 |
| B | 0 | 13 | 0 |
| C | 0 | 13 | 0 |
| D | 0 | 13 | 0 |
| Mode SS | |||
|---|---|---|---|
| Quadrant | BADHDUFLAG | Total packets | Discarded packets |
| A | 0 | 118 | 0 |
| B | 0 | 118 | 0 |
| C | 0 | 118 | 0 |
| D | 0 | 118 | 0 |
| Quadrant | Total seconds | Saturated seconds | Saturation percentage |
|---|---|---|---|
| A | 5810 | 245 | 4.216867% |
| B | 5810 | 74 | 1.273666% |
| C | 5810 | 35 | 0.602410% |
| D | 5810 | 123 | 2.117040% |
Noise dominated data is calculated using 1-second bins in cleaned event files. If a bin has >2000 counts, and if more than 50% of those come from <1% of pixels, then it is considered to be noise-dominated and hence unusable.
| Quadrant | # 1 sec bins | Bins with >0 counts | Bins with >2000 counts | High rate bins dominated by noise | Noise dominated (total time) | Noise dominated (detector-on time) | Marked lightcurve |
|---|---|---|---|---|---|---|---|
| A | 7039 | 5809 | 147 | 147 | 2.09% | 2.53% | 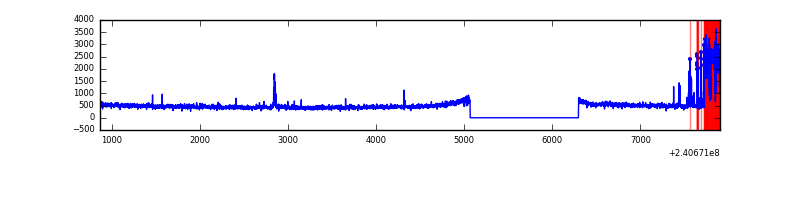 |
| B | 7040 | 5811 | 3 | 3 | 0.04% | 0.05% | 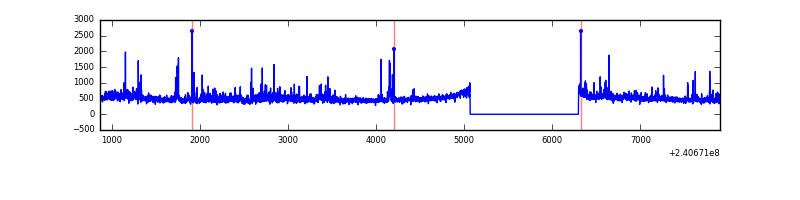 |
| C | 7040 | 5811 | 0 | 0 | 0.00% | 0.00% | 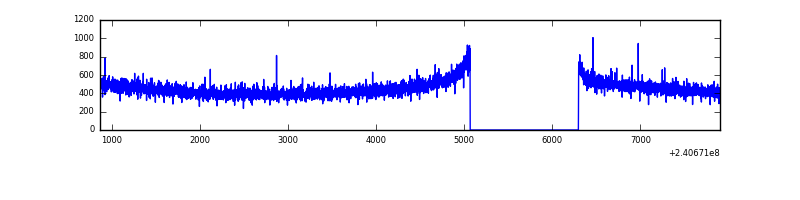 |
| D | 7040 | 5811 | 74 | 74 | 1.05% | 1.27% | 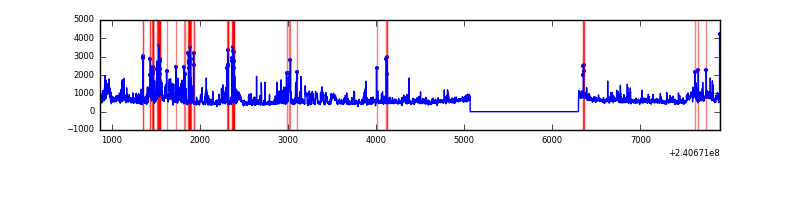 |
Top three noisy pixels from each quadrant. If the there are fewer than three noisy pixels in the level2.evt file, extra rows are filled as -1
| Pixel properties | Quadrant properties | ||||||
|---|---|---|---|---|---|---|---|
| Quadrant | DetID | PixID | Counts | Sigma | Mean | Median | Sigma |
| A | 15 | 223 | 351641 | 2518.33 | 683 | 669 | 139.4 |
| A | 15 | 239 | 72794 | 517.52 | 683 | 669 | 139.4 |
| A | 8 | 15 | 57770 | 409.72 | 683 | 669 | 139.4 |
| B | 11 | 51 | 125693 | 973.64 | 692 | 676 | 128.4 |
| B | 0 | 214 | 64467 | 496.81 | 692 | 676 | 128.4 |
| B | 4 | 239 | 44439 | 340.83 | 692 | 676 | 128.4 |
| C | 0 | 207 | 6454 | 38.25 | 664 | 669 | 151.2 |
| C | 14 | 67 | 6388 | 37.81 | 664 | 669 | 151.2 |
| C | 4 | 175 | 6305 | 37.26 | 664 | 669 | 151.2 |
| D | 2 | 16 | 397298 | 2536.99 | 662 | 644 | 156.3 |
| D | 1 | 52 | 364104 | 2324.68 | 662 | 644 | 156.3 |
| D | 8 | 195 | 261494 | 1668.39 | 662 | 644 | 156.3 |
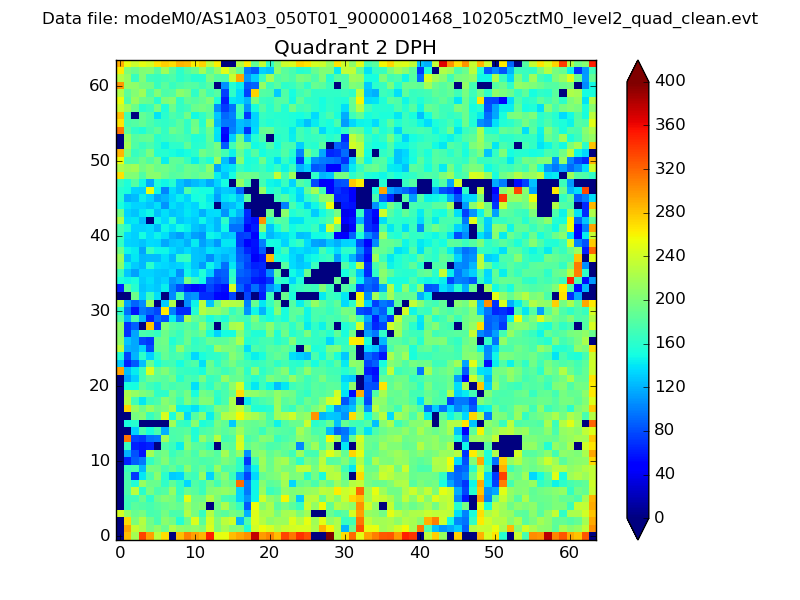
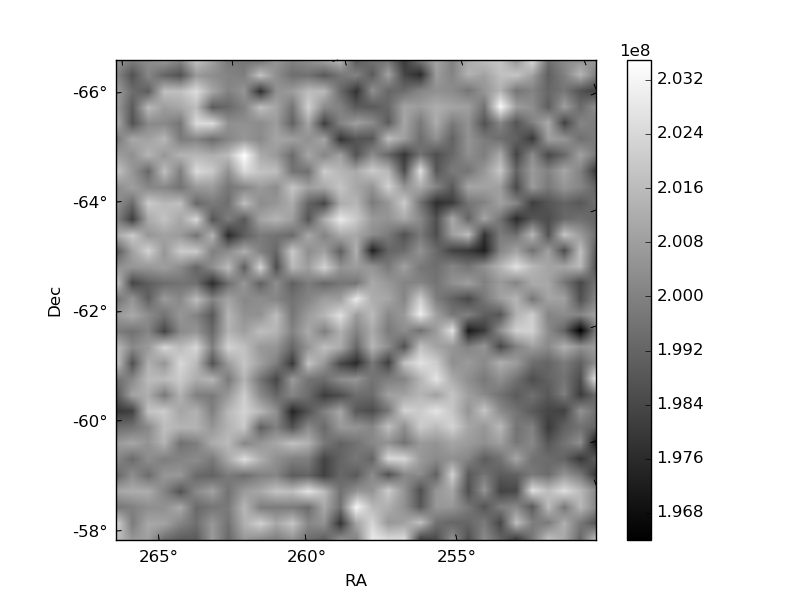
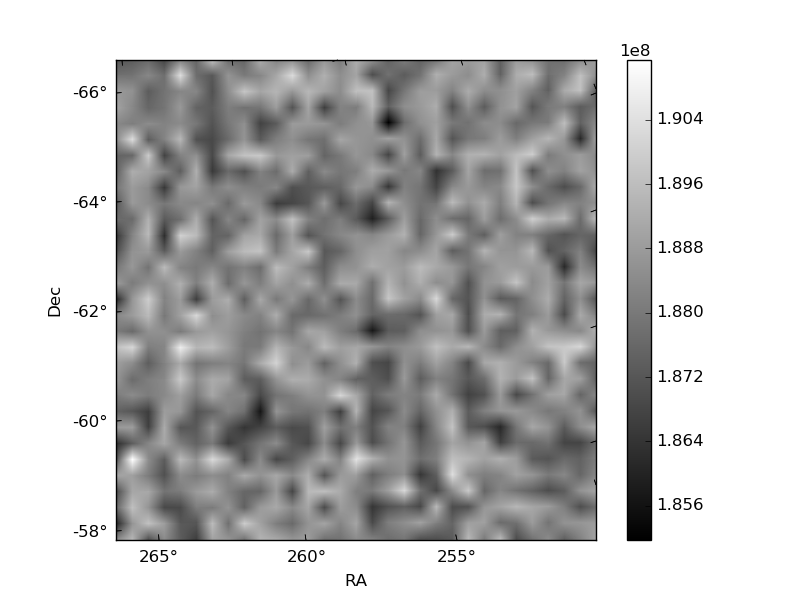
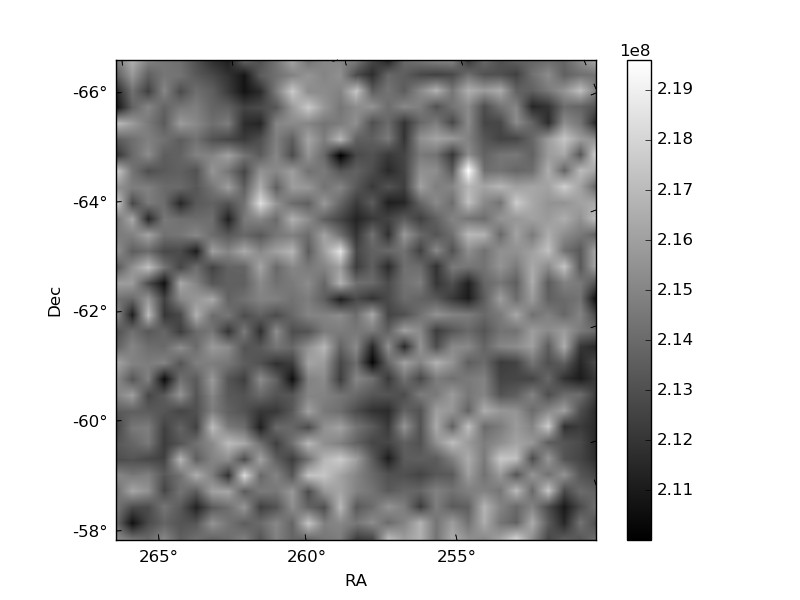
Histogram calculated using DETX and DETY for each event in the final _common_clean file
| Quadrant A | 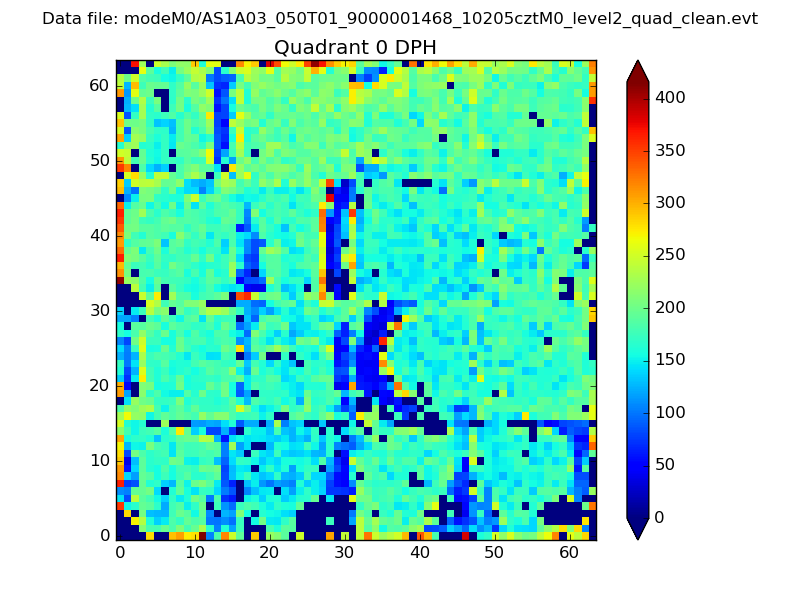 |
 |
Quadrant B |
|---|---|---|---|
| Quadrant D |  |
 |
Quadrant C |
| Plot type | Count rate plots | Images |
|---|---|---|
| Comparison with Poisson distribution Blue bars denote a histogram of data divided into 1 sec bins. Red curve is a Poisson curve with rate = median count rate of data. |
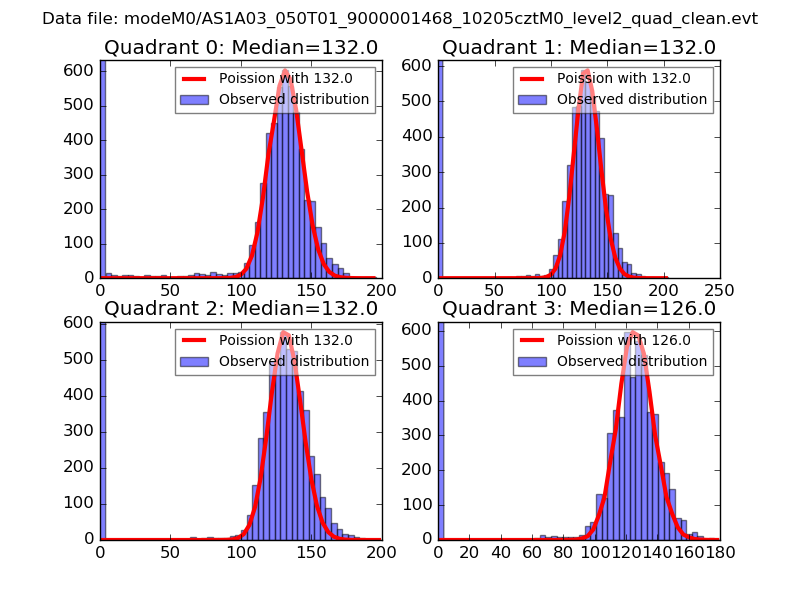 |
 |
| Quadrant-wise count rates Data is divided into 100 sec bins |
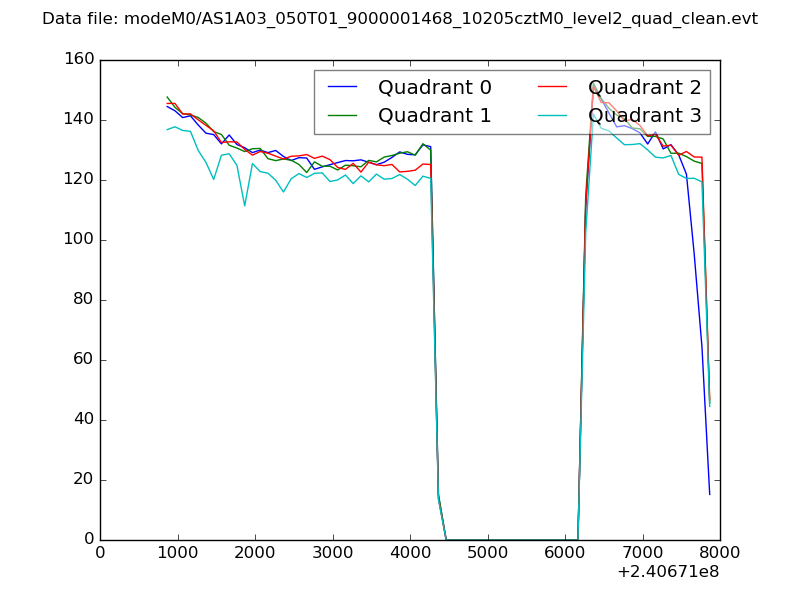 |
|
| Module-wise count rates for Quadrant A Data is divided into 100 sec bins |
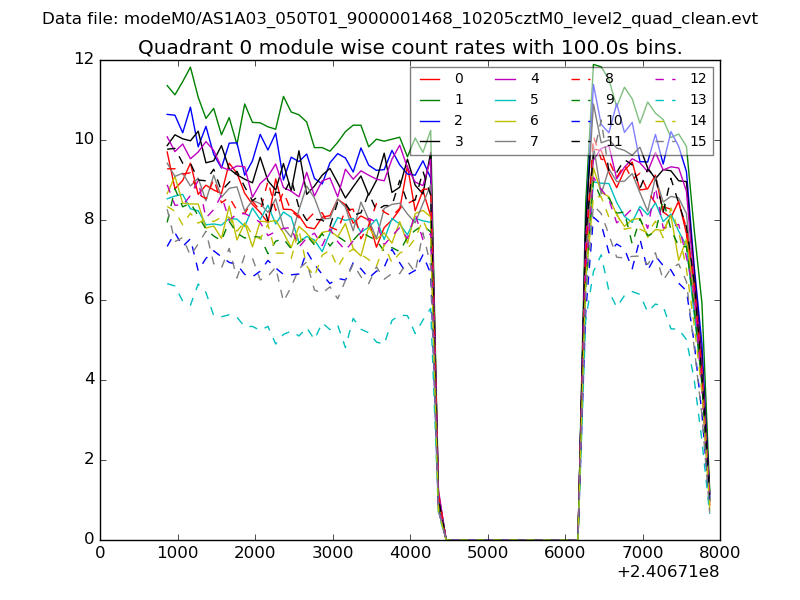 |
 |
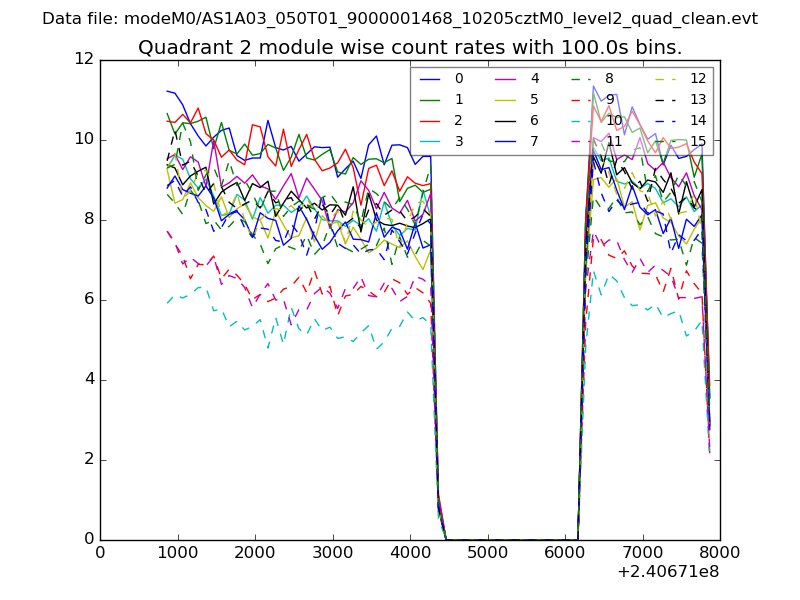
| Module-wise count rates for Quadrant B Data is divided into 100 sec bins |
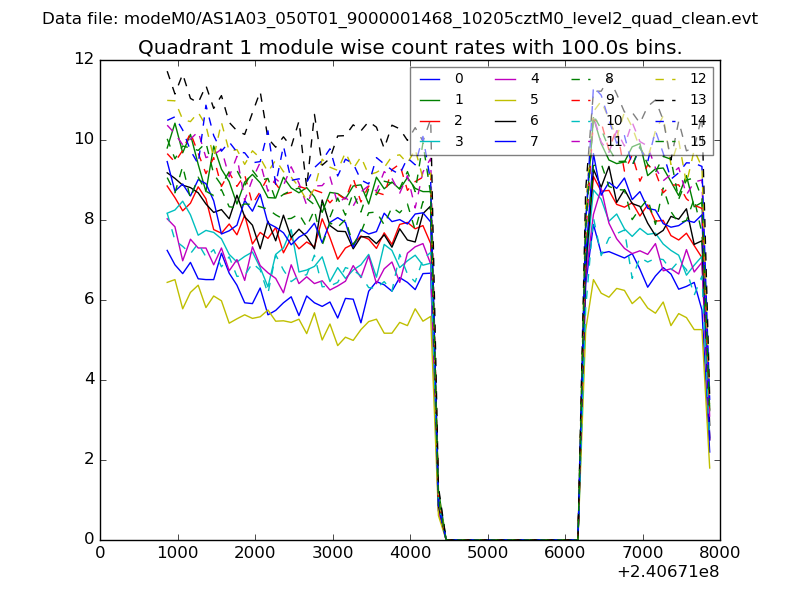 |
 |
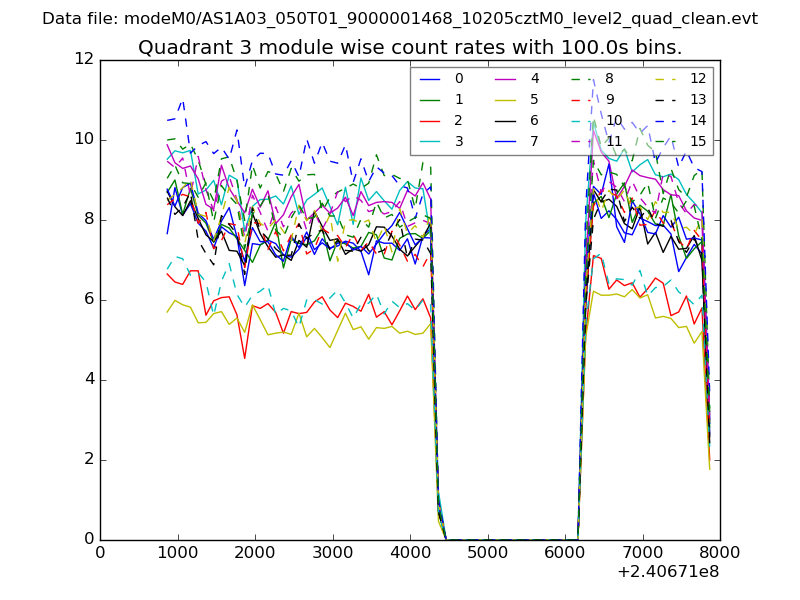
| Module-wise count rates for Quadrant C Data is divided into 100 sec bins |
 |
 |
| Module-wise count rates for Quadrant D Data is divided into 100 sec bins |
 |
 |
| Parameter | Plot |
|---|---|
| CZT HV Monitor | 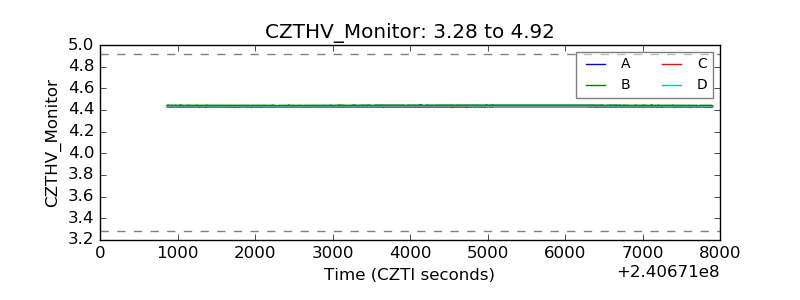 |
| D_VDD | 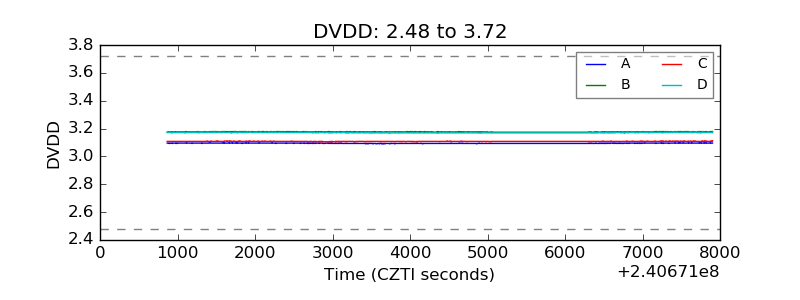 |
| Temperature 1 | 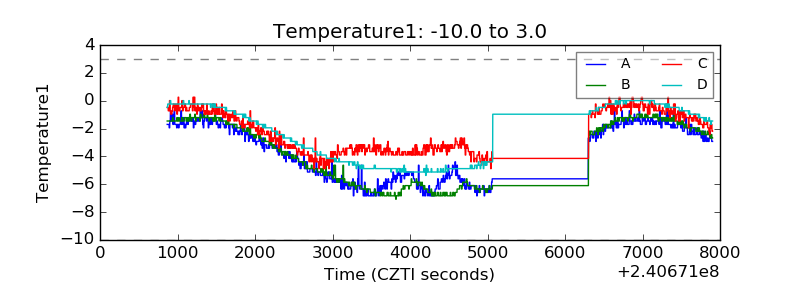 |
| Veto HV Monitor | 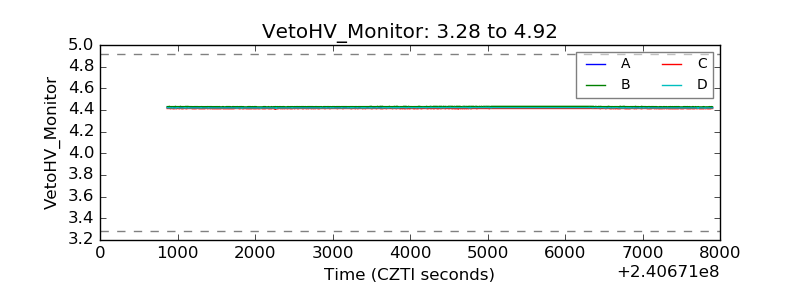 |
| Veto LLD | 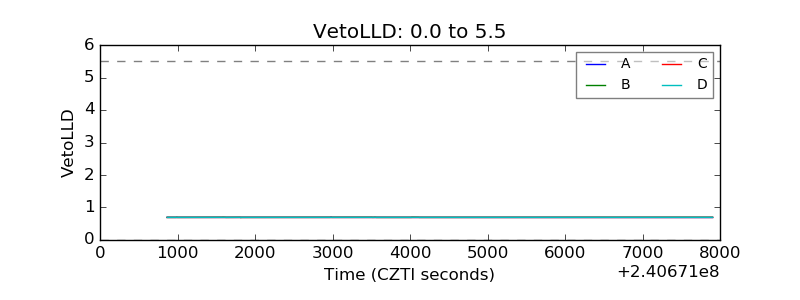 |
| Alpha Counter | 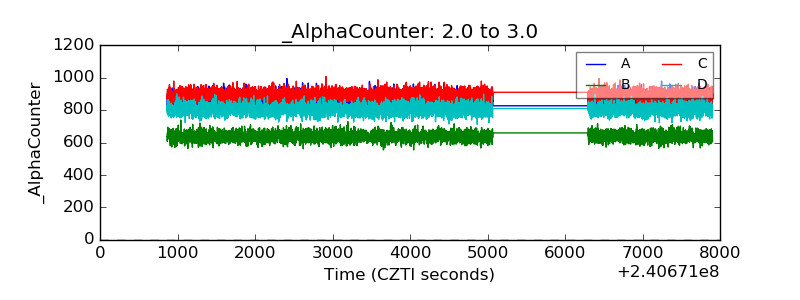 |
| _CPM_Rate | 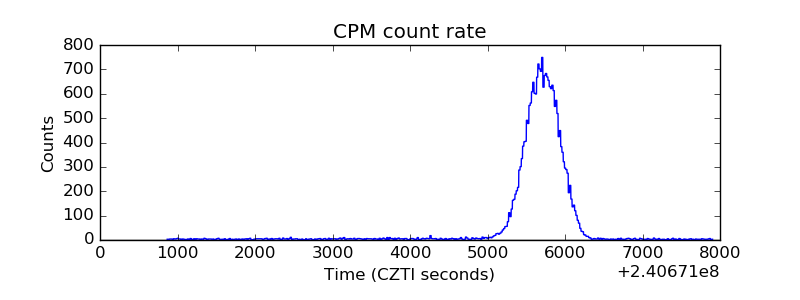 |
| CZT Counter | 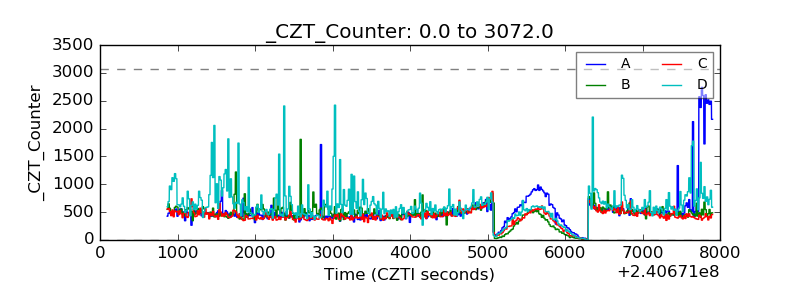 |
| +2.5 Volts monitor |  |
| +5 Volts monitor | 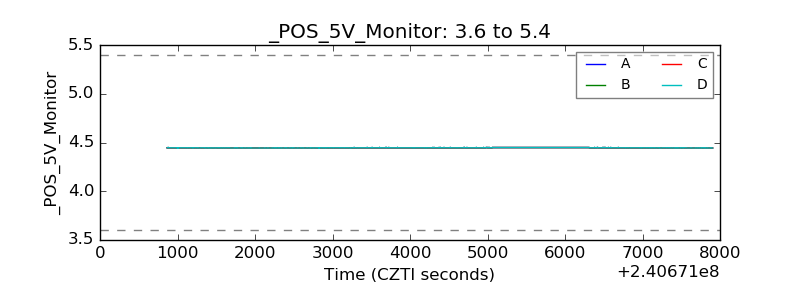 |
| _ROLL_ROT | 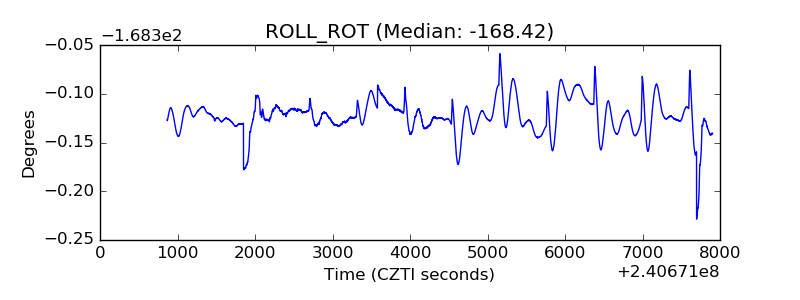 |
| _Roll_DEC | 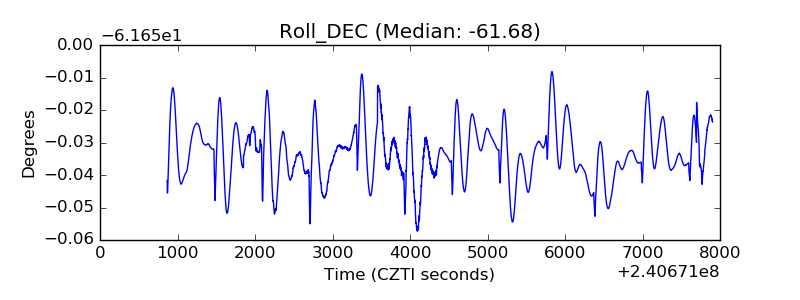 |
| _Roll_RA | 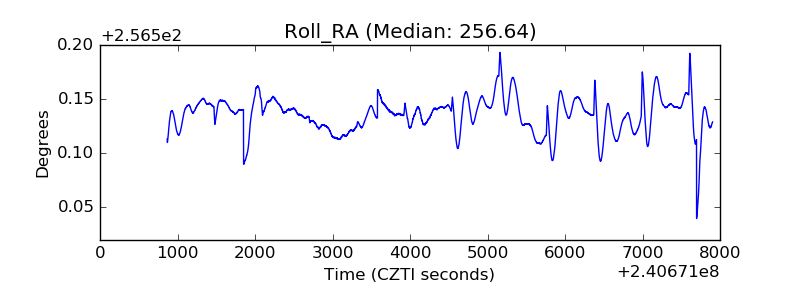 |
| Veto Counter | 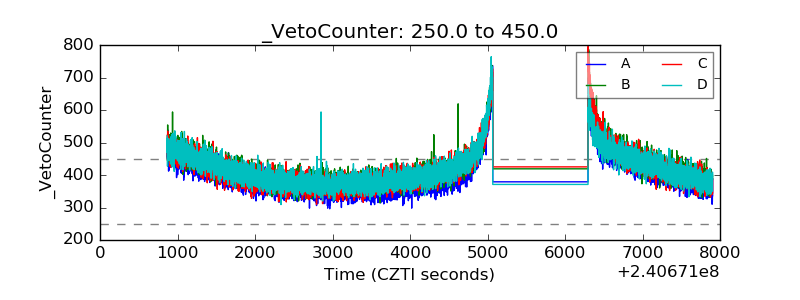 |