| Param | Original file | Final file |
|---|---|---|
| Filename | modeM0/AS1A03_050T01_9000001468_10206cztM0_level2.evt | modeM0/AS1A03_050T01_9000001468_10206cztM0_level2_quad_clean.evt |
| Size (bytes) | 195,298,560 | 46,105,920 |
| Size | 186.3 MB | 44.0 MB |
| Events in quadrant A | 1,698,014 | 296,222 |
| Events in quadrant B | 1,213,782 | 312,734 |
| Events in quadrant C | 1,041,096 | 315,138 |
| Events in quadrant D | 1,795,484 | 298,028 |
| Mode M0 | |||
|---|---|---|---|
| Quadrant | BADHDUFLAG | Total packets | Discarded packets |
| A | 0 | 6578 | 0 |
| B | 0 | 5158 | 0 |
| C | 0 | 4852 | 0 |
| D | 0 | 6981 | 0 |
| Mode SS | |||
|---|---|---|---|
| Quadrant | BADHDUFLAG | Total packets | Discarded packets |
| A | 0 | 48 | 0 |
| B | 0 | 48 | 0 |
| C | 0 | 48 | 0 |
| D | 0 | 48 | 0 |
| Quadrant | Total seconds | Saturated seconds | Saturation percentage |
|---|---|---|---|
| A | 2416 | 217 | 8.981788% |
| B | 2416 | 3 | 0.124172% |
| C | 2416 | 0 | 0.000000% |
| D | 2416 | 45 | 1.862583% |
Noise dominated data is calculated using 1-second bins in cleaned event files. If a bin has >2000 counts, and if more than 50% of those come from <1% of pixels, then it is considered to be noise-dominated and hence unusable.
| Quadrant | # 1 sec bins | Bins with >0 counts | Bins with >2000 counts | High rate bins dominated by noise | Noise dominated (total time) | Noise dominated (detector-on time) | Marked lightcurve |
|---|---|---|---|---|---|---|---|
| A | 2416 | 2416 | 190 | 190 | 7.86% | 7.86% | 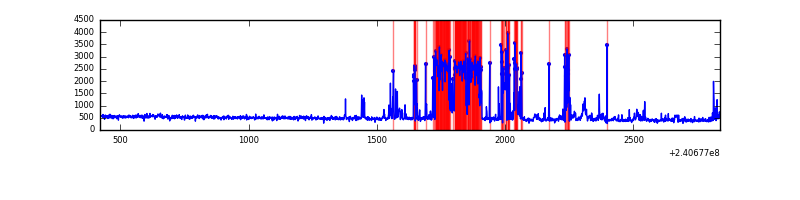 |
| B | 2416 | 2416 | 1 | 1 | 0.04% | 0.04% | 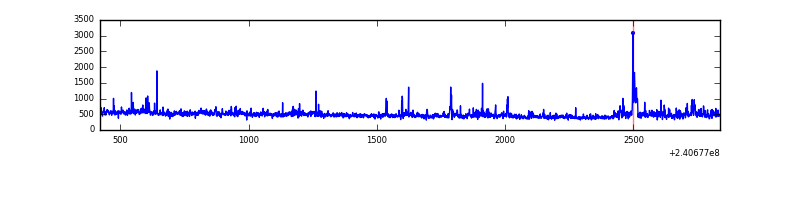 |
| C | 2416 | 2416 | 0 | 0 | 0.00% | 0.00% | 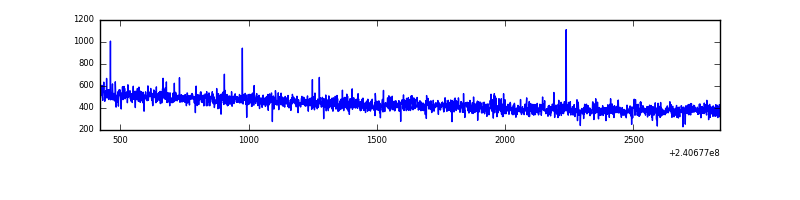 |
| D | 2416 | 2416 | 66 | 66 | 2.73% | 2.73% | 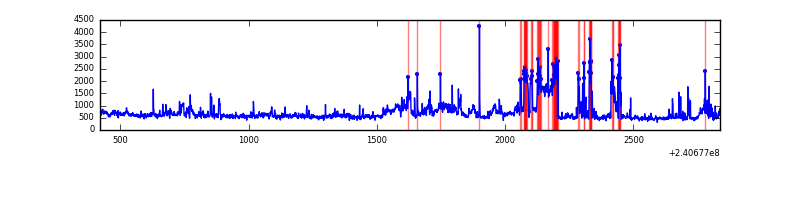 |
Top three noisy pixels from each quadrant. If the there are fewer than three noisy pixels in the level2.evt file, extra rows are filled as -1
| Pixel properties | Quadrant properties | ||||||
|---|---|---|---|---|---|---|---|
| Quadrant | DetID | PixID | Counts | Sigma | Mean | Median | Sigma |
| A | 15 | 223 | 381766 | 6710.67 | 267 | 262 | 56.9 |
| A | 8 | 15 | 123500 | 2167.76 | 267 | 262 | 56.9 |
| A | 15 | 239 | 83899 | 1471.18 | 267 | 262 | 56.9 |
| B | 11 | 51 | 61451 | 1144.28 | 276 | 269 | 53.5 |
| B | 5 | 32 | 20093 | 370.77 | 276 | 269 | 53.5 |
| B | 0 | 219 | 16682 | 306.97 | 276 | 269 | 53.5 |
| C | 0 | 207 | 7366 | 114.84 | 263 | 264 | 61.8 |
| C | 14 | 67 | 2652 | 38.61 | 263 | 264 | 61.8 |
| C | 13 | 61 | 2089 | 29.51 | 263 | 264 | 61.8 |
| D | 13 | 122 | 322161 | 4955.78 | 266 | 258 | 65.0 |
| D | 8 | 195 | 202900 | 3119.73 | 266 | 258 | 65.0 |
| D | 2 | 16 | 107072 | 1644.43 | 266 | 258 | 65.0 |
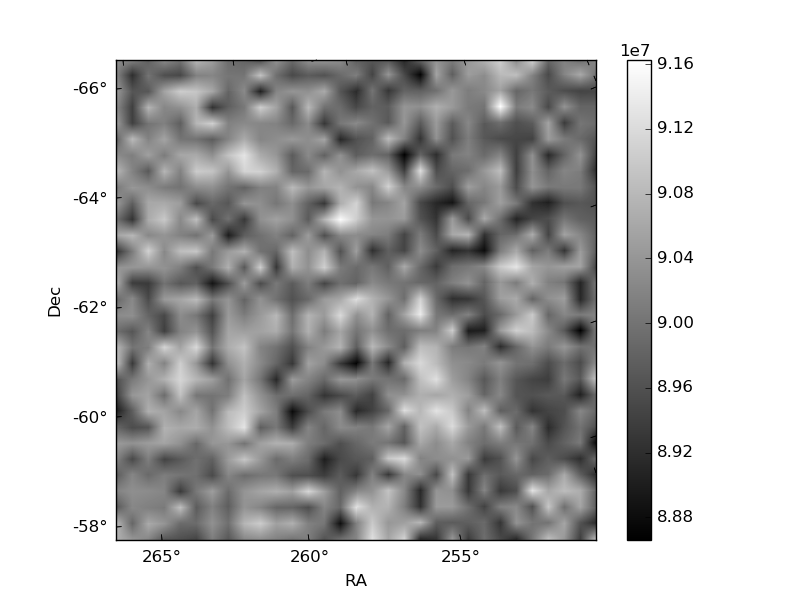
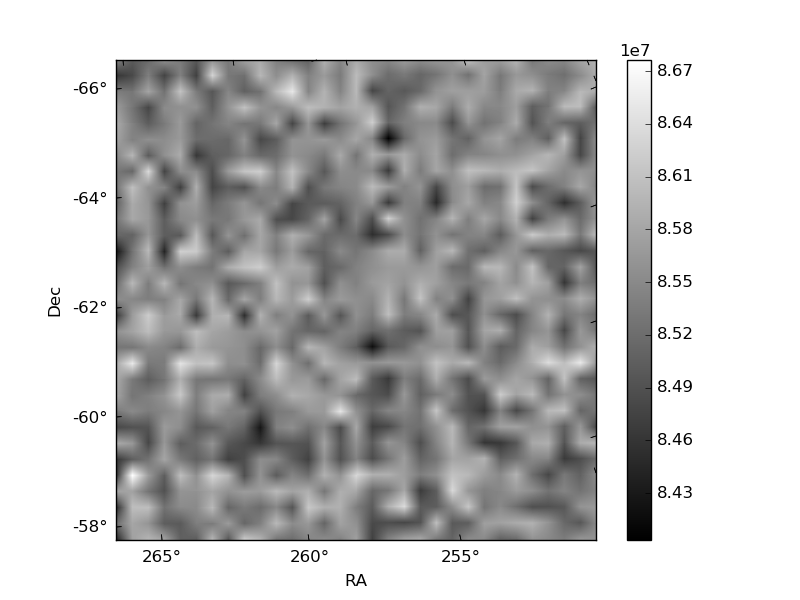
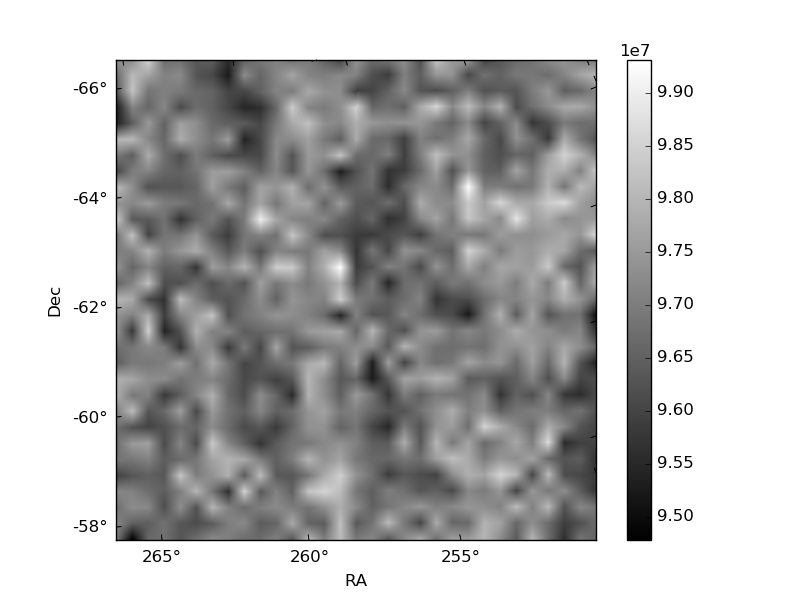
Histogram calculated using DETX and DETY for each event in the final _common_clean file
| Quadrant A | 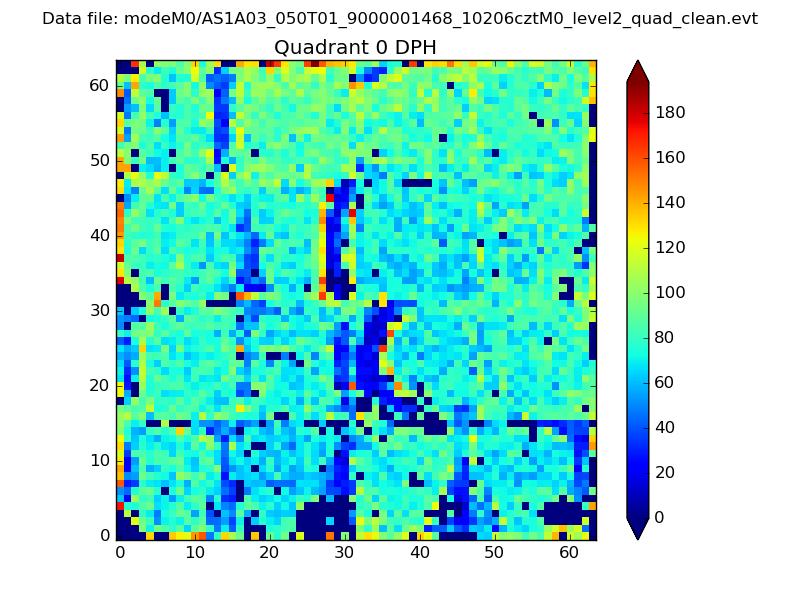 |
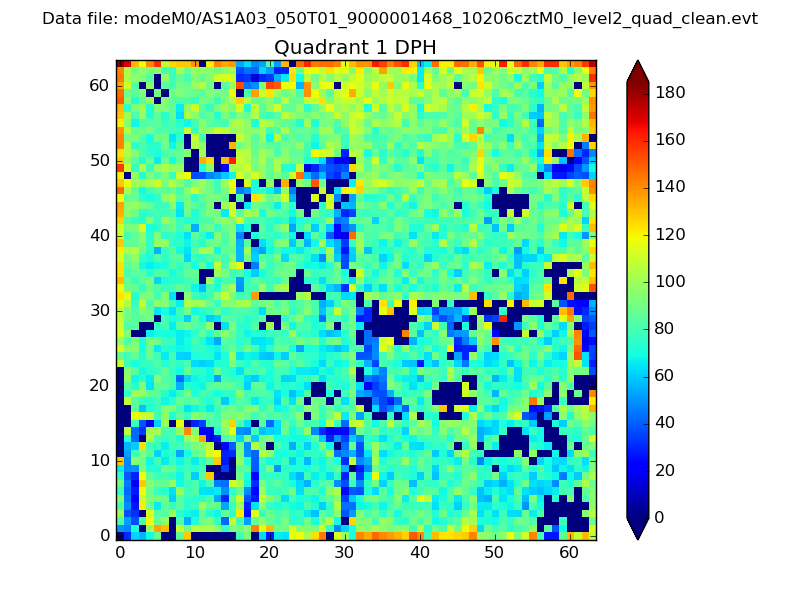 |
Quadrant B |
|---|---|---|---|
| Quadrant D | 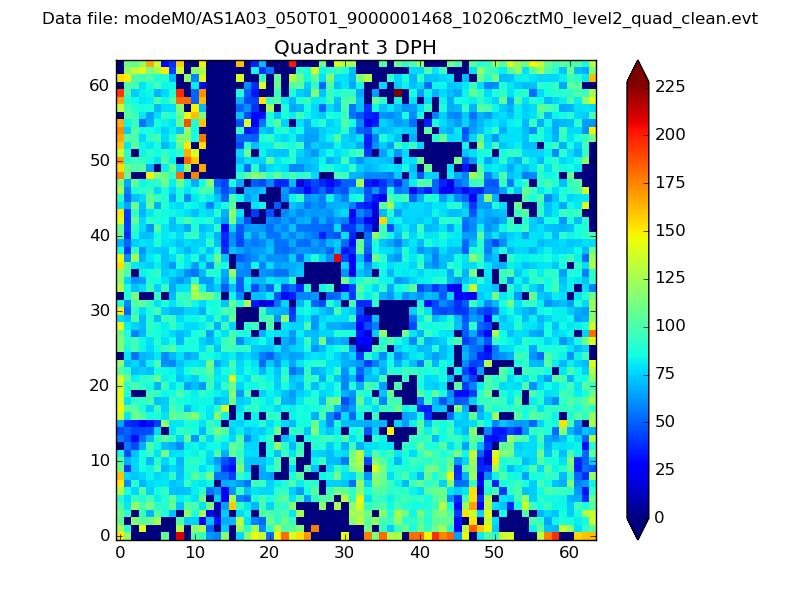 |
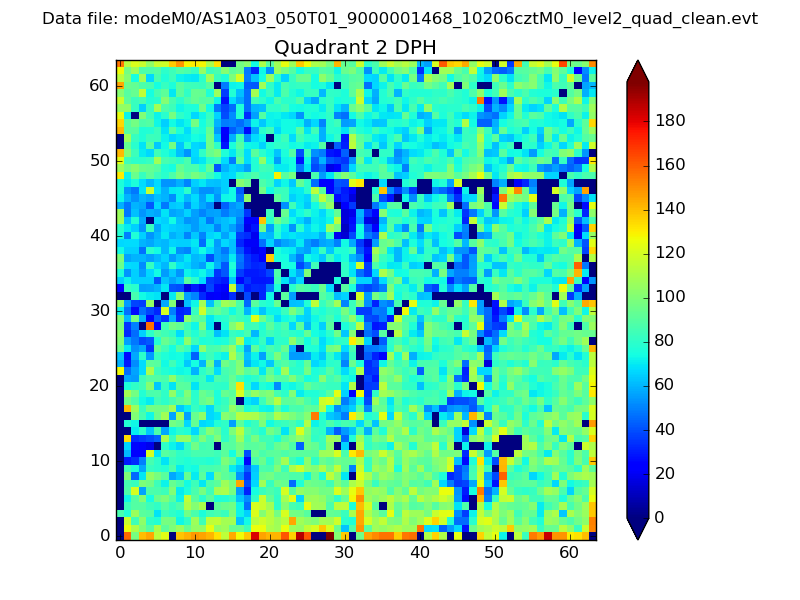 |
Quadrant C |
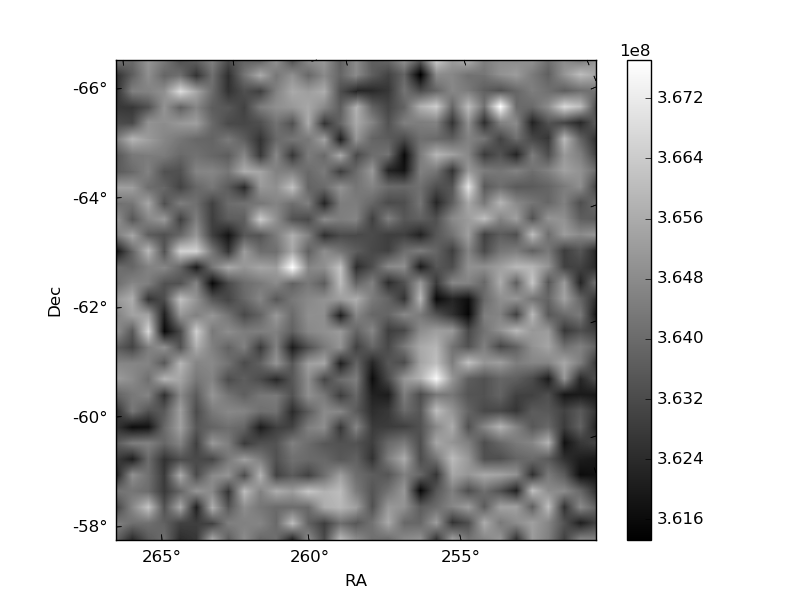
| Plot type | Count rate plots | Images |
|---|---|---|
| Comparison with Poisson distribution Blue bars denote a histogram of data divided into 1 sec bins. Red curve is a Poisson curve with rate = median count rate of data. |
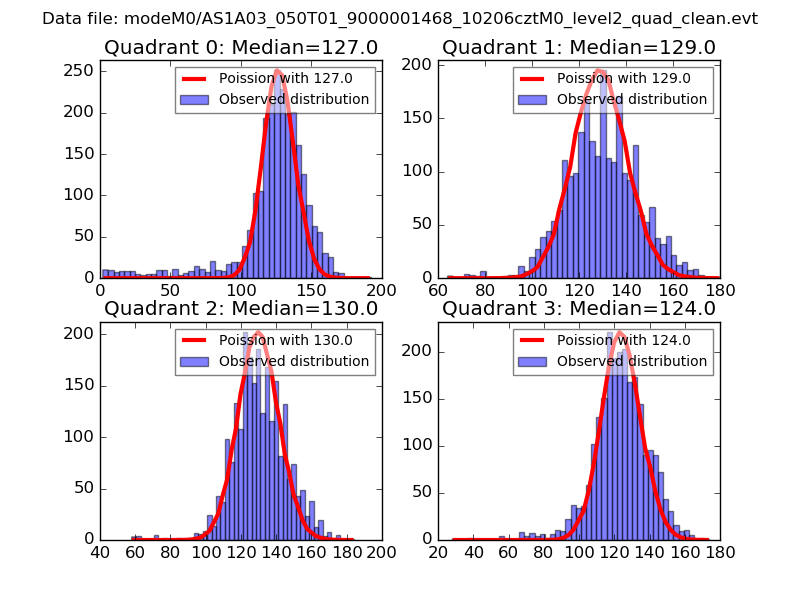 |
 |
| Quadrant-wise count rates Data is divided into 100 sec bins |
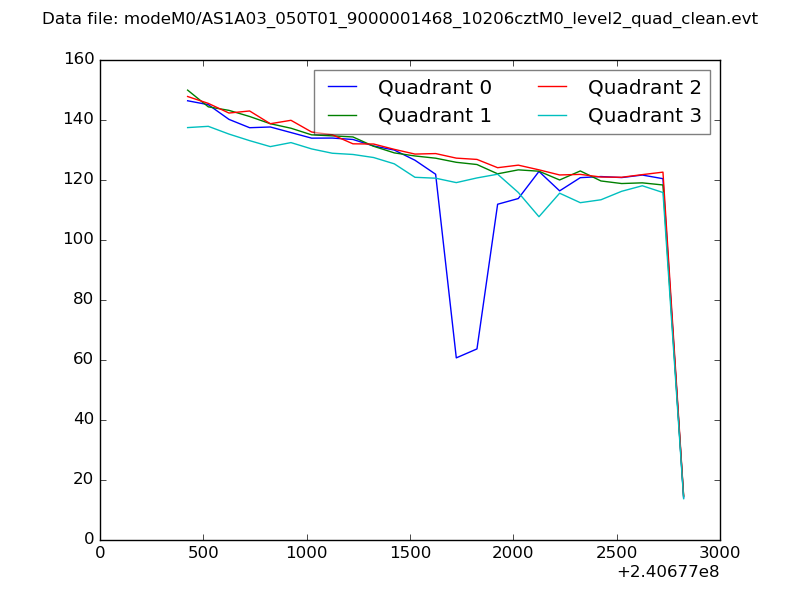 |
|
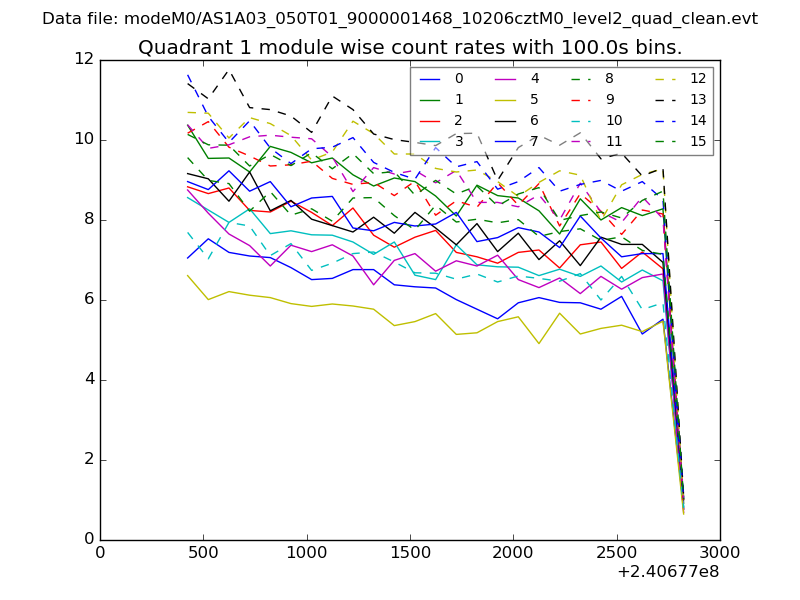
| Module-wise count rates for Quadrant A Data is divided into 100 sec bins |
 |
 |
| Module-wise count rates for Quadrant B Data is divided into 100 sec bins |
 |
 |
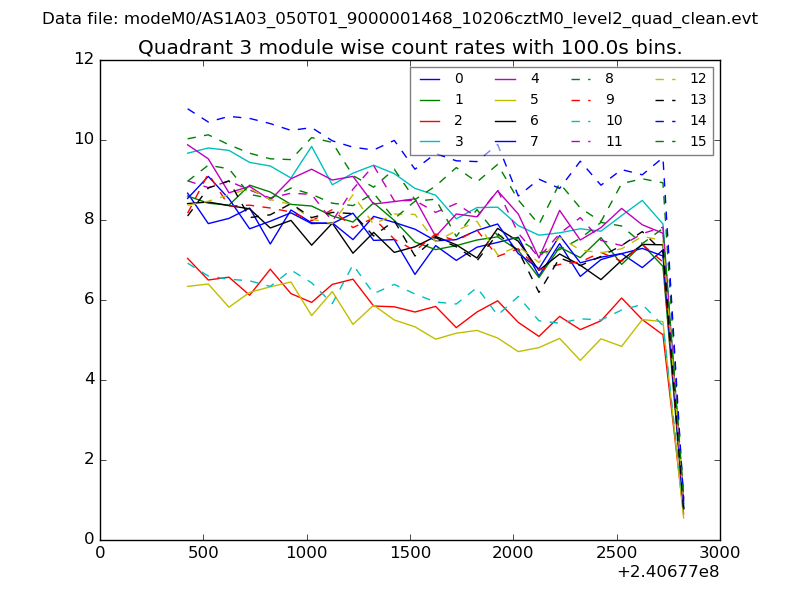
| Module-wise count rates for Quadrant C Data is divided into 100 sec bins |
 |
 |
| Module-wise count rates for Quadrant D Data is divided into 100 sec bins |
 |
 |
| Parameter | Plot |
|---|---|
| CZT HV Monitor | 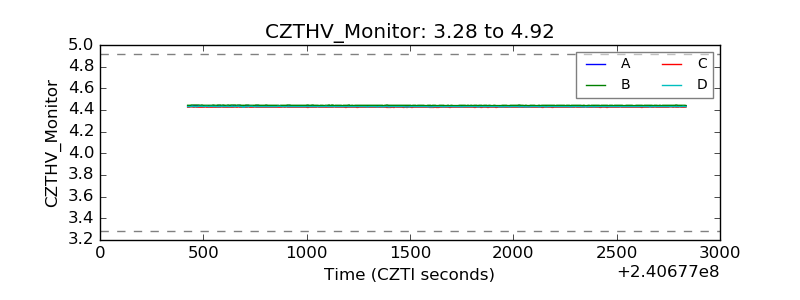 |
| D_VDD | 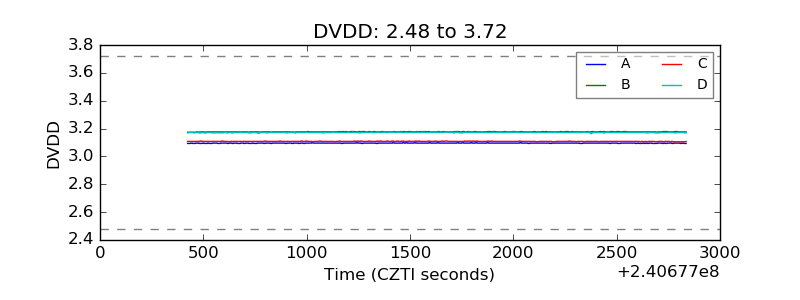 |
| Temperature 1 |  |
| Veto HV Monitor | 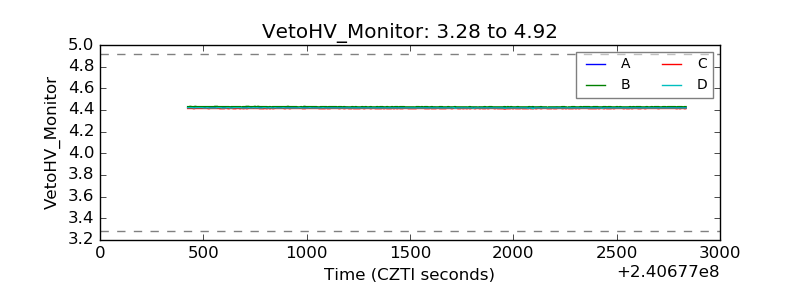 |
| Veto LLD | 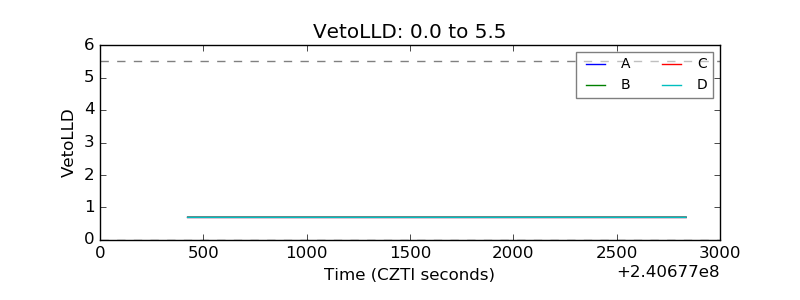 |
| Alpha Counter | 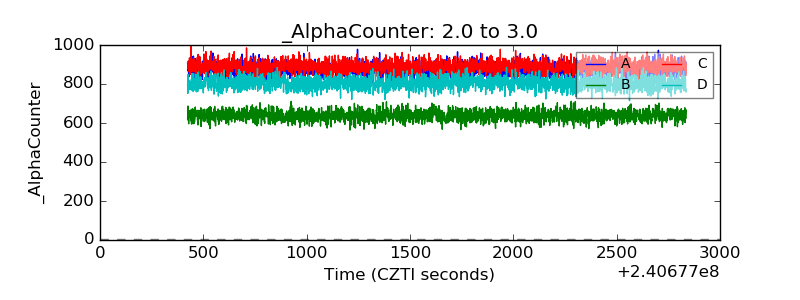 |
| _CPM_Rate | 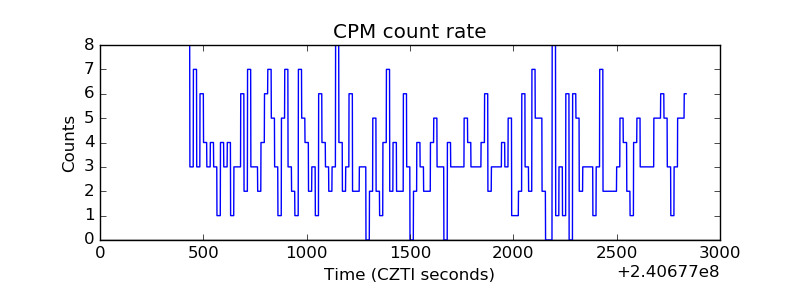 |
| CZT Counter | 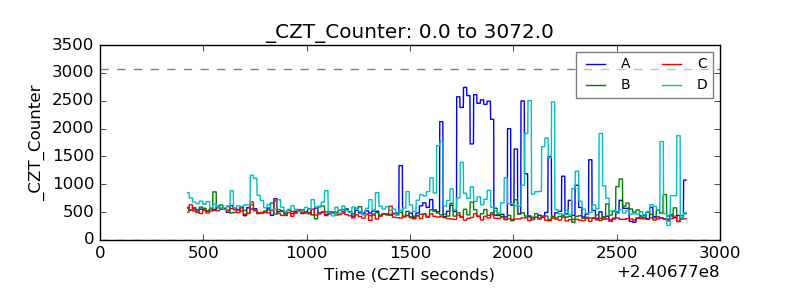 |
| +2.5 Volts monitor |  |
| +5 Volts monitor |  |
| _ROLL_ROT |  |
| _Roll_DEC | 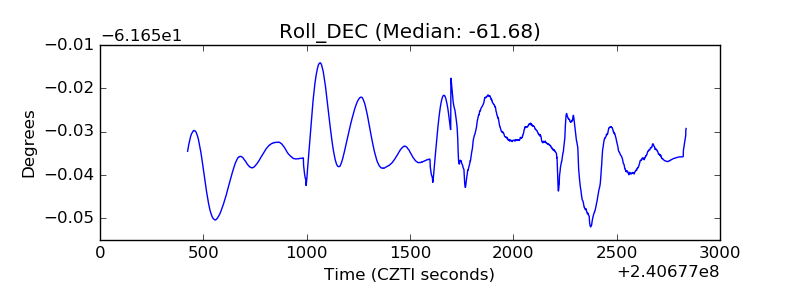 |
| _Roll_RA | 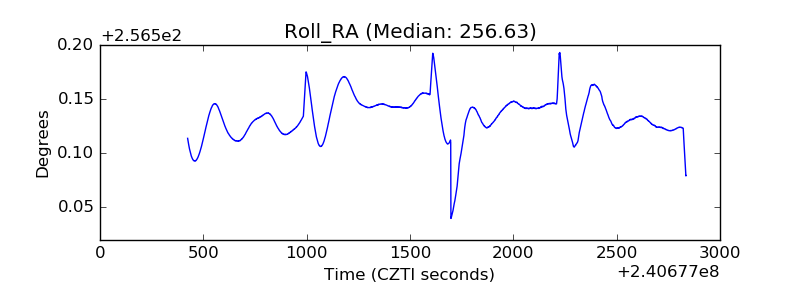 |
| Veto Counter | 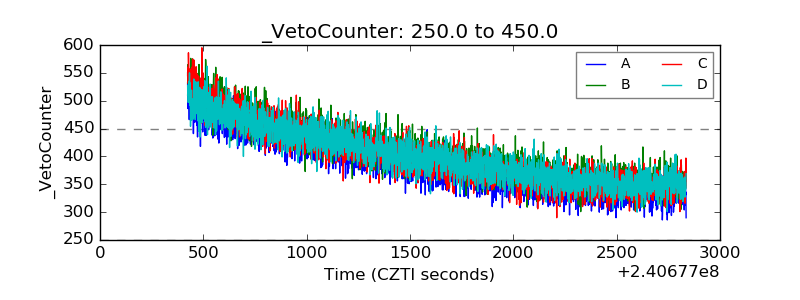 |