| Param | Original file | Final file |
|---|---|---|
| Filename | modeM0/AS1G07_011T04_9000001466cztM0_level2.fits | modeM0/AS1G07_011T04_9000001466cztM0_level2_quad_clean.evt |
| Size (bytes) | 153,060,480 | 133,306,560 |
| Size | 146.0 MB | 127.1 MB |
| Events in quadrant A | 958,888 | 794,458 |
| Events in quadrant B | 899,040 | 804,025 |
| Events in quadrant C | 949,320 | 747,905 |
| Events in quadrant D | 833,200 | 695,149 |
| Mode M0 | |||
|---|---|---|---|
| Quadrant | BADHDUFLAG | Total packets | Discarded packets |
| A | 0 | 30111 | 0 |
| B | 0 | 29652 | 0 |
| C | 0 | 30106 | 0 |
| D | 0 | 32854 | 0 |
| Mode M9 | |||
|---|---|---|---|
| Quadrant | BADHDUFLAG | Total packets | Discarded packets |
| A | 0 | 37 | 0 |
| B | 0 | 37 | 0 |
| C | 0 | 37 | 0 |
| D | 0 | 37 | 0 |
| Mode SS | |||
|---|---|---|---|
| Quadrant | BADHDUFLAG | Total packets | Discarded packets |
| A | 0 | 309 | 0 |
| B | 0 | 305 | 0 |
| C | 0 | 308 | 0 |
| D | 0 | 308 | 0 |
| Quadrant | Total seconds | Saturated seconds | Saturation percentage |
|---|---|---|---|
| A | 14427 | 141 | 0.977334% |
| B | 14028 | 159 | 1.133447% |
| C | 14509 | 98 | 0.675443% |
| D | 14535 | 131 | 0.901273% |
Noise dominated data is calculated using 1-second bins in cleaned event files. If a bin has >2000 counts, and if more than 50% of those come from <1% of pixels, then it is considered to be noise-dominated and hence unusable.
| Quadrant | # 1 sec bins | Bins with >0 counts | Bins with >2000 counts | High rate bins dominated by noise | Noise dominated (total time) | Noise dominated (detector-on time) | Marked lightcurve |
|---|---|---|---|---|---|---|---|
| A | 19051 | 14883 | 0 | 0 | 0.00% | 0.00% |  |
| B | 19051 | 14510 | 0 | 0 | 0.00% | 0.00% |  |
| C | 19051 | 14953 | 0 | 0 | 0.00% | 0.00% |  |
| D | 19051 | 14802 | 0 | 0 | 0.00% | 0.00% |  |
Top three noisy pixels from each quadrant. If the there are fewer than three noisy pixels in the level2.evt file, extra rows are filled as -1
| Pixel properties | Quadrant properties | ||||||
|---|---|---|---|---|---|---|---|
| Quadrant | DetID | PixID | Counts | Sigma | Mean | Median | Sigma |
| A | 0 | 29 | 935 | 11.1 | 249 | 235 | 63.1 |
| A | 7 | 110 | 762 | 8.35 | 249 | 235 | 63.1 |
| A | 0 | 30 | 712 | 7.56 | 249 | 235 | 63.1 |
| B | 2 | 9 | 729 | 10.54 | 237 | 227 | 47.6 |
| B | 5 | 128 | 612 | 8.08 | 237 | 227 | 47.6 |
| B | 3 | 17 | 600 | 7.83 | 237 | 227 | 47.6 |
| C | 1 | 81 | 673 | 6.55 | 250 | 235 | 66.9 |
| C | 1 | 80 | 665 | 6.43 | 250 | 235 | 66.9 |
| C | 9 | 188 | 663 | 6.4 | 250 | 235 | 66.9 |
| D | 3 | 14 | 588 | 5.9 | 237 | 217 | 62.9 |
| D | 6 | 67 | 583 | 5.82 | 237 | 217 | 62.9 |
| D | 6 | 44 | 582 | 5.8 | 237 | 217 | 62.9 |
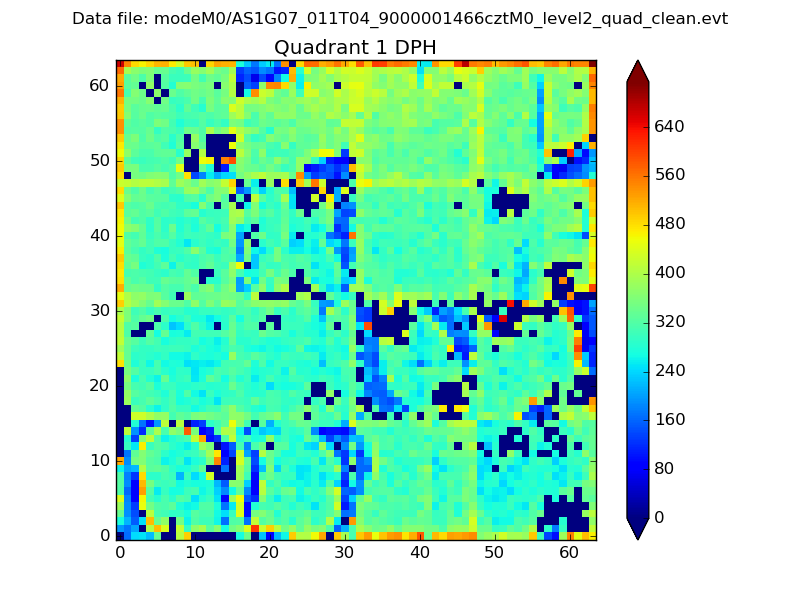
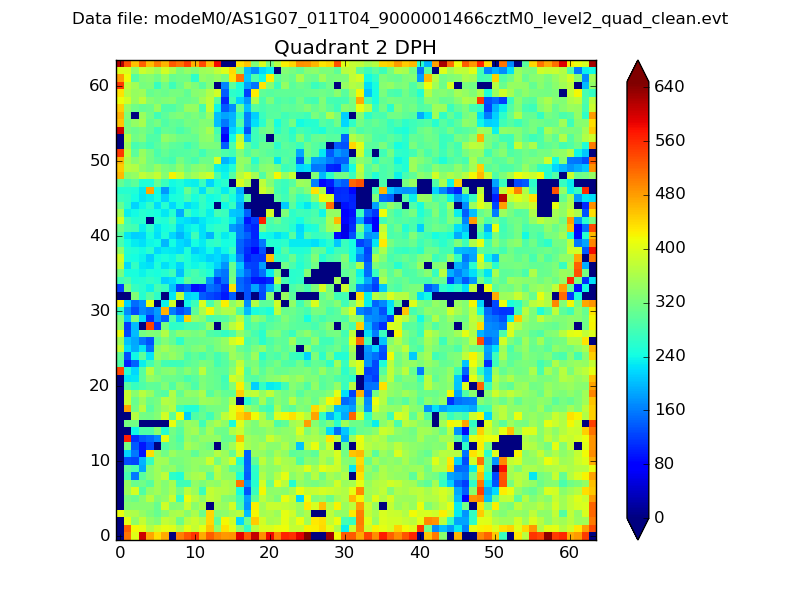
Histogram calculated using DETX and DETY for each event in the final _common_clean file
| Quadrant A |  |
 |
Quadrant B |
|---|---|---|---|
| Quadrant D | 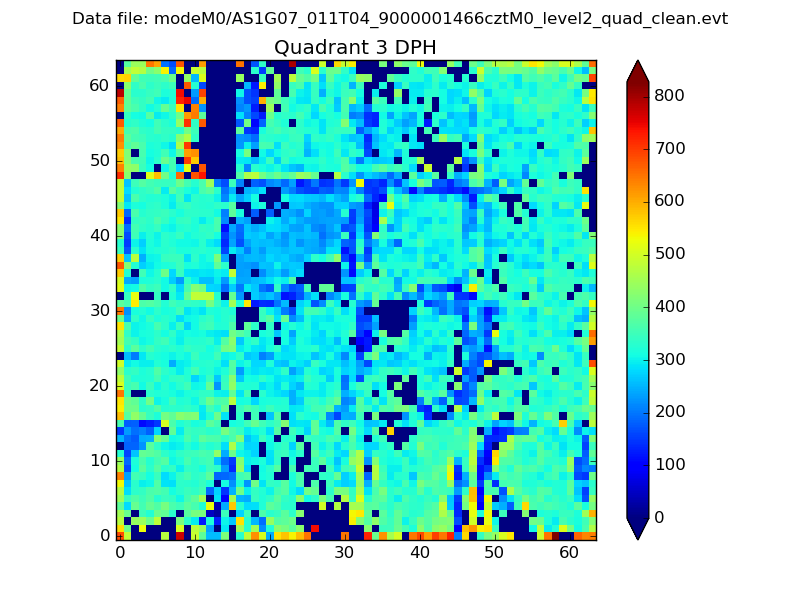 |
 |
Quadrant C |
| Plot type | Count rate plots | Images |
|---|---|---|
| Comparison with Poisson distribution Blue bars denote a histogram of data divided into 1 sec bins. Red curve is a Poisson curve with rate = median count rate of data. |
 |
 |
| Quadrant-wise count rates Data is divided into 100 sec bins |
 |
|
| Module-wise count rates for Quadrant A Data is divided into 100 sec bins |
 |
 |
| Module-wise count rates for Quadrant B Data is divided into 100 sec bins |
 |
 |
| Module-wise count rates for Quadrant C Data is divided into 100 sec bins |
 |
 |
| Module-wise count rates for Quadrant D Data is divided into 100 sec bins |
 |
 |
| Parameter | Plot |
|---|---|
| CZT HV Monitor |  |
| D_VDD |  |
| Temperature 1 |  |
| Veto HV Monitor |  |
| Veto LLD |  |
| Alpha Counter |  |
| _CPM_Rate |  |
| CZT Counter |  |
| +2.5 Volts monitor |  |
| +5 Volts monitor |  |
| _ROLL_ROT |  |
| _Roll_DEC | 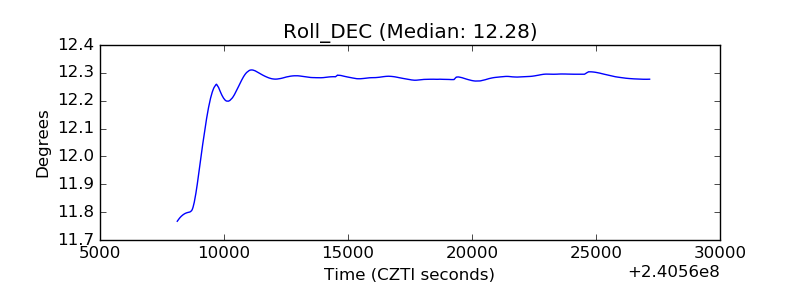 |
| _Roll_RA |  |
| Veto Counter |  |