| Param | Original file | Final file |
|---|---|---|
| Filename | modeM0/AS1G07_011T04_9000001466_10187cztM0_level2.evt | modeM0/AS1G07_011T04_9000001466_10187cztM0_level2_quad_clean.evt |
| Size (bytes) | 135,567,360 | 23,034,240 |
| Size | 129.3 MB | 22.0 MB |
| Events in quadrant A | 982,275 | 150,608 |
| Events in quadrant B | 842,781 | 106,449 |
| Events in quadrant C | 1,045,645 | 146,551 |
| Events in quadrant D | 1,094,308 | 146,415 |
| Mode M0 | |||
|---|---|---|---|
| Quadrant | BADHDUFLAG | Total packets | Discarded packets |
| A | 0 | 12025 | 7954 |
| B | 0 | 14096 | 10827 |
| C | 0 | 12436 | 8201 |
| D | 0 | 14116 | 9722 |
| Mode M9 | |||
|---|---|---|---|
| Quadrant | BADHDUFLAG | Total packets | Discarded packets |
| A | 0 | 18 | 7 |
| B | 0 | 22 | 11 |
| C | 0 | 22 | 11 |
| D | 0 | 18 | 7 |
| Mode SS | |||
|---|---|---|---|
| Quadrant | BADHDUFLAG | Total packets | Discarded packets |
| A | 0 | 120 | 63 |
| B | 0 | 120 | 67 |
| C | 0 | 120 | 62 |
| D | 0 | 118 | 62 |
| Quadrant | Total seconds | Saturated seconds | Saturation percentage |
|---|---|---|---|
| A | 2036 | 2 | 0.098232% |
| B | 1635 | 3 | 0.183486% |
| C | 2118 | 1 | 0.047214% |
| D | 2147 | 6 | 0.279460% |
Noise dominated data is calculated using 1-second bins in cleaned event files. If a bin has >2000 counts, and if more than 50% of those come from <1% of pixels, then it is considered to be noise-dominated and hence unusable.
| Quadrant | # 1 sec bins | Bins with >0 counts | Bins with >2000 counts | High rate bins dominated by noise | Noise dominated (total time) | Noise dominated (detector-on time) | Marked lightcurve |
|---|---|---|---|---|---|---|---|
| A | 4055 | 2490 | 0 | 0 | 0.00% | 0.00% | 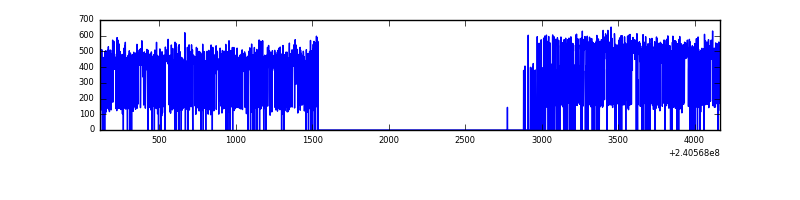 |
| B | 4055 | 2118 | 0 | 0 | 0.00% | 0.00% | 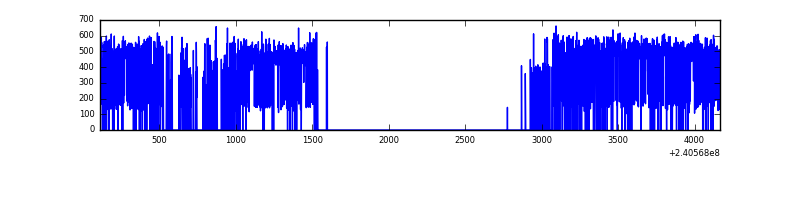 |
| C | 4055 | 2560 | 0 | 0 | 0.00% | 0.00% | 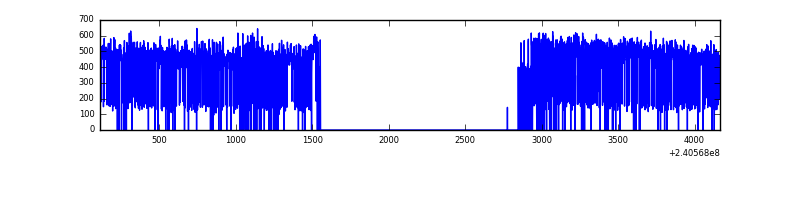 |
| D | 4055 | 2409 | 0 | 0 | 0.00% | 0.00% | 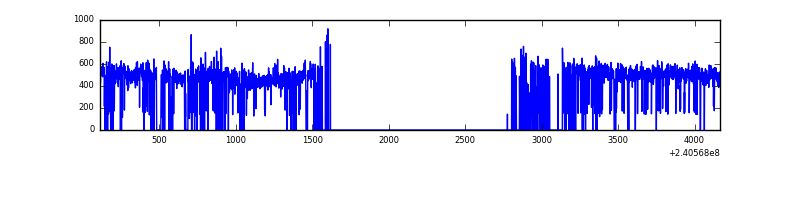 |
Top three noisy pixels from each quadrant. If the there are fewer than three noisy pixels in the level2.evt file, extra rows are filled as -1
| Pixel properties | Quadrant properties | ||||||
|---|---|---|---|---|---|---|---|
| Quadrant | DetID | PixID | Counts | Sigma | Mean | Median | Sigma |
| A | 0 | 226 | 2309 | 38.68 | 255 | 250 | 53.2 |
| A | 12 | 194 | 2114 | 35.02 | 255 | 250 | 53.2 |
| A | 3 | 137 | 1079 | 15.57 | 255 | 250 | 53.2 |
| B | 0 | 219 | 13131 | 313.87 | 207 | 202 | 41.2 |
| B | 11 | 51 | 9906 | 235.58 | 207 | 202 | 41.2 |
| B | 0 | 214 | 5645 | 132.14 | 207 | 202 | 41.2 |
| C | 14 | 67 | 26139 | 420.75 | 261 | 262 | 61.5 |
| C | 13 | 61 | 1988 | 28.06 | 261 | 262 | 61.5 |
| C | 14 | 234 | 1095 | 13.54 | 261 | 262 | 61.5 |
| D | 8 | 195 | 46317 | 723.2 | 263 | 257 | 63.7 |
| D | 1 | 52 | 14076 | 216.98 | 263 | 257 | 63.7 |
| D | 4 | 95 | 10009 | 153.12 | 263 | 257 | 63.7 |
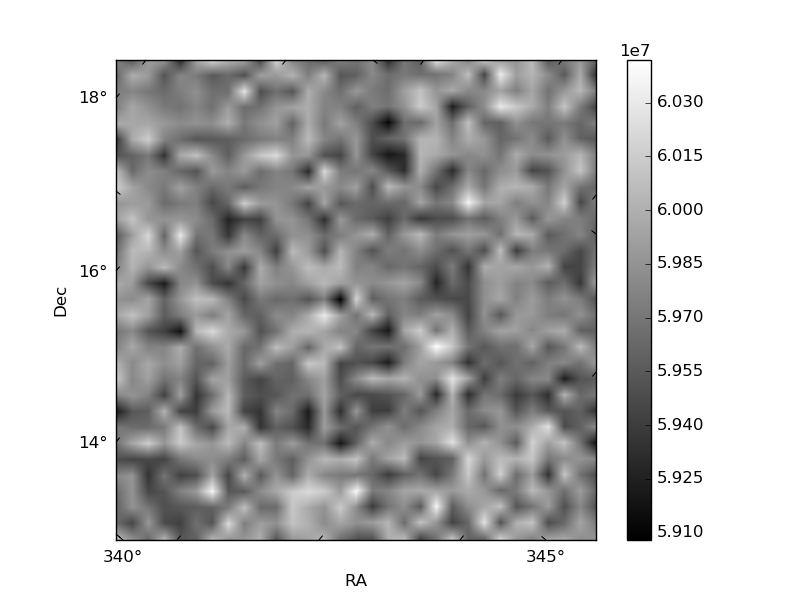
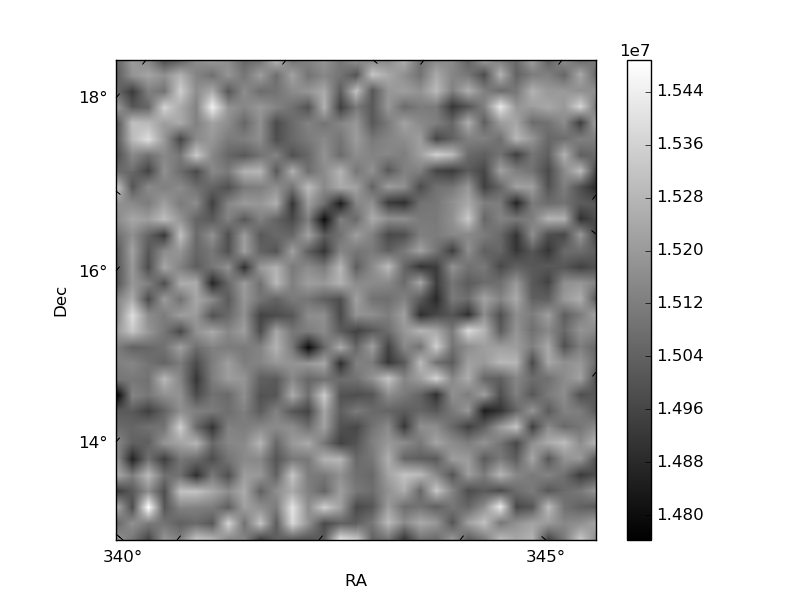
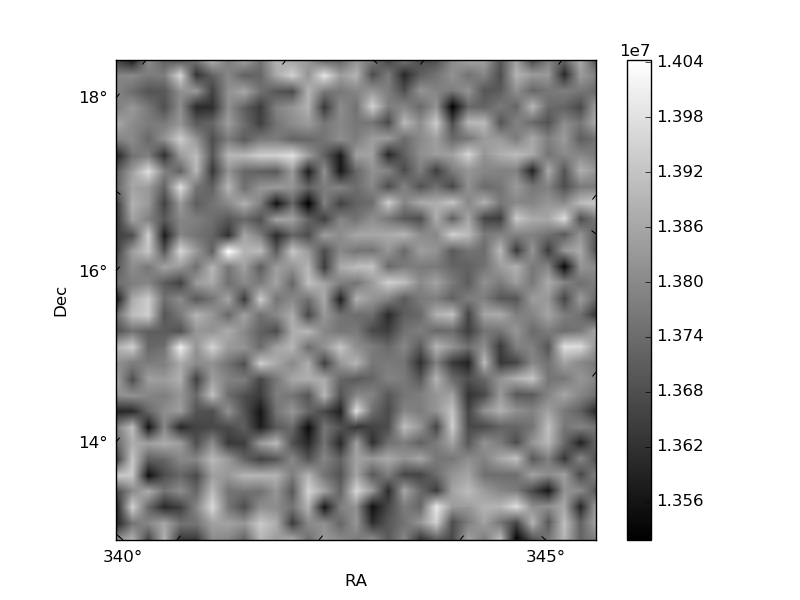
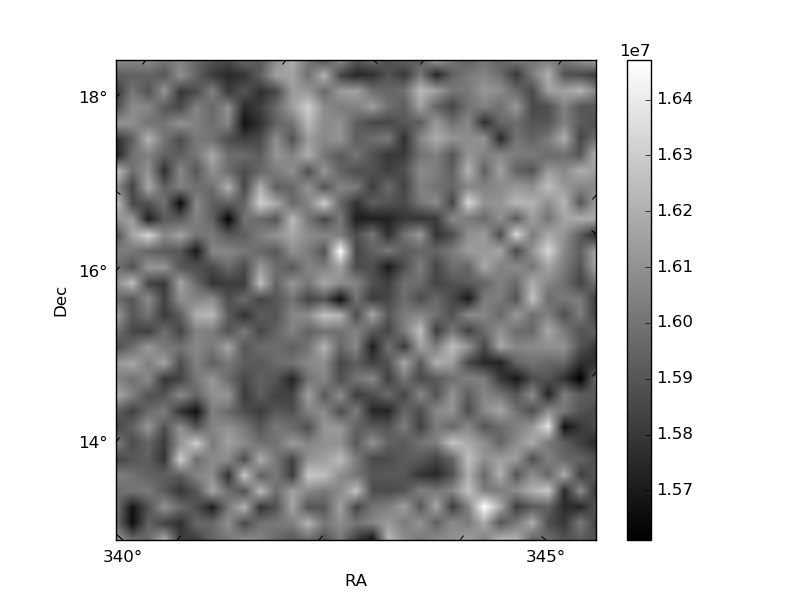
Histogram calculated using DETX and DETY for each event in the final _common_clean file
| Quadrant A | 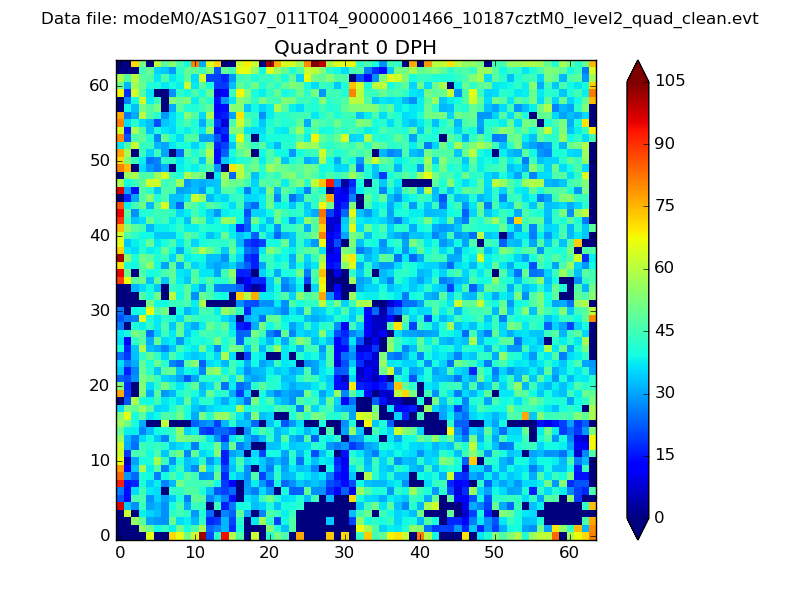 |
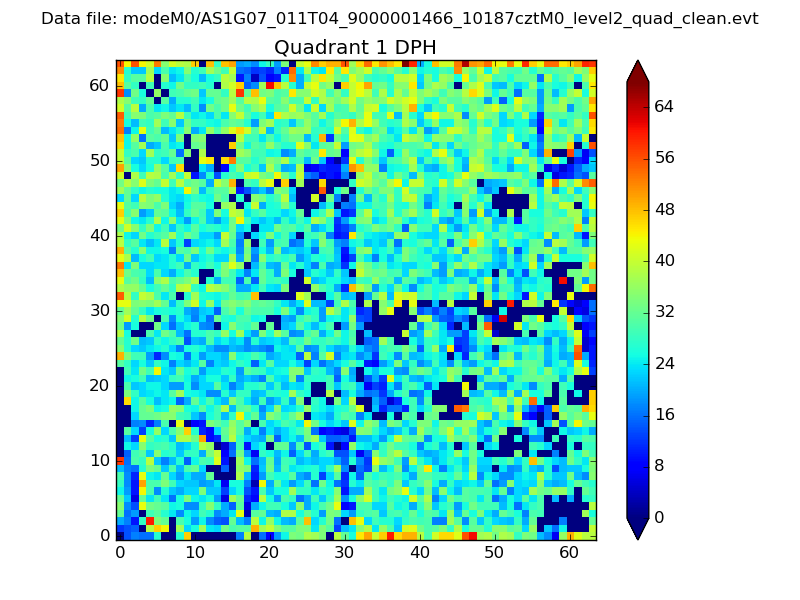 |
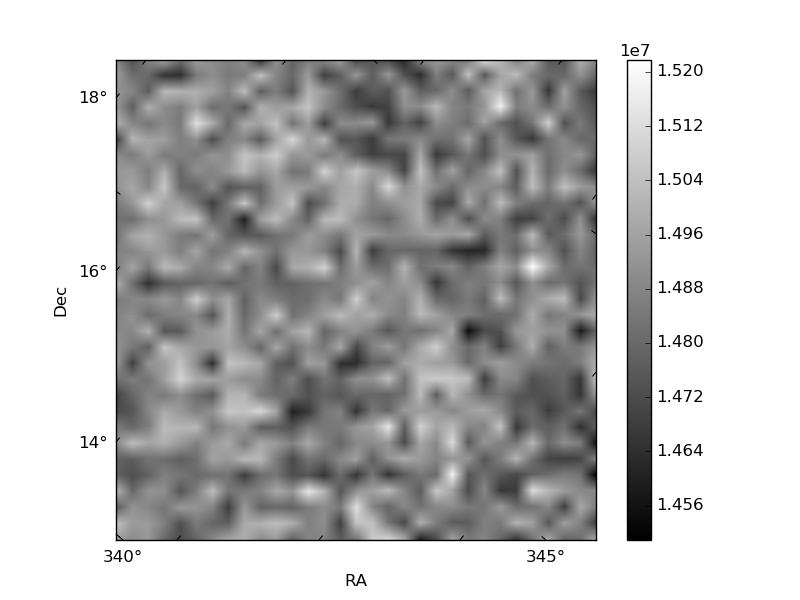
Quadrant B |
|---|---|---|---|
| Quadrant D | 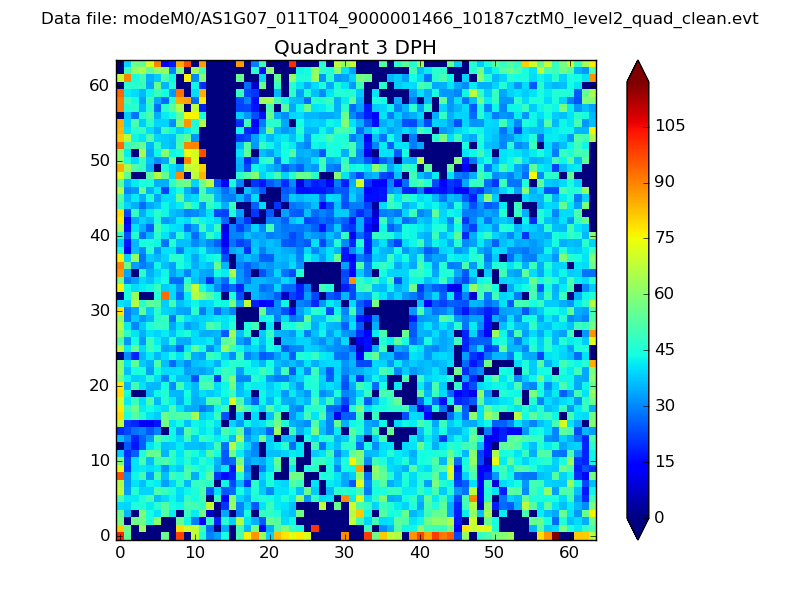 |
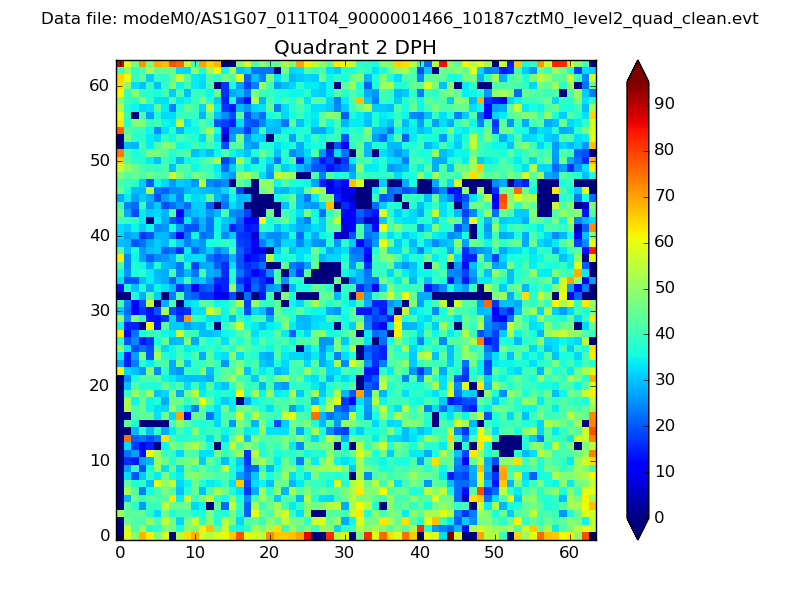 |
Quadrant C |
| Plot type | Count rate plots | Images |
|---|---|---|
| Comparison with Poisson distribution Blue bars denote a histogram of data divided into 1 sec bins. Red curve is a Poisson curve with rate = median count rate of data. |
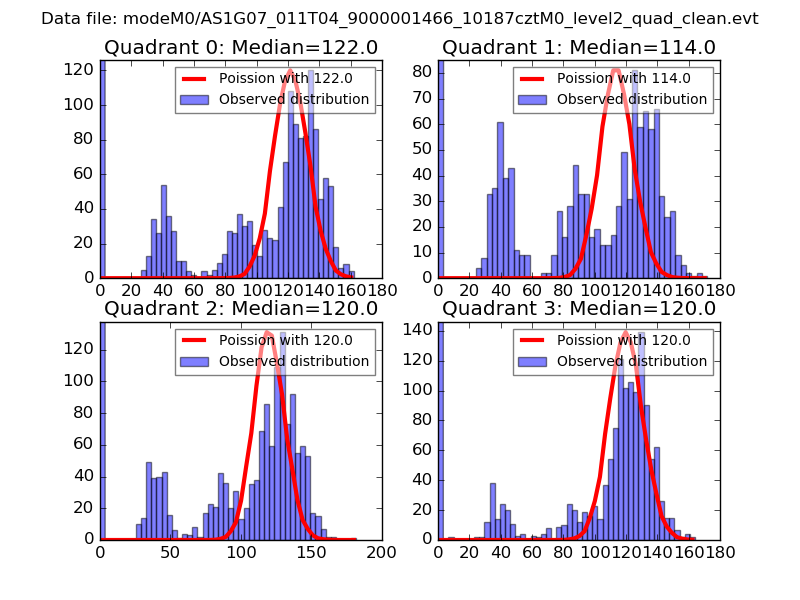 |
 |
| Quadrant-wise count rates Data is divided into 100 sec bins |
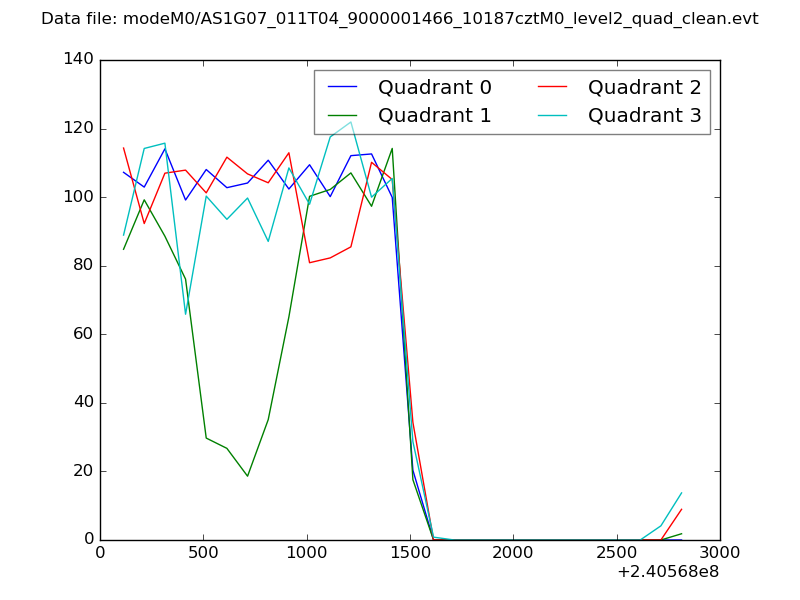 |
|
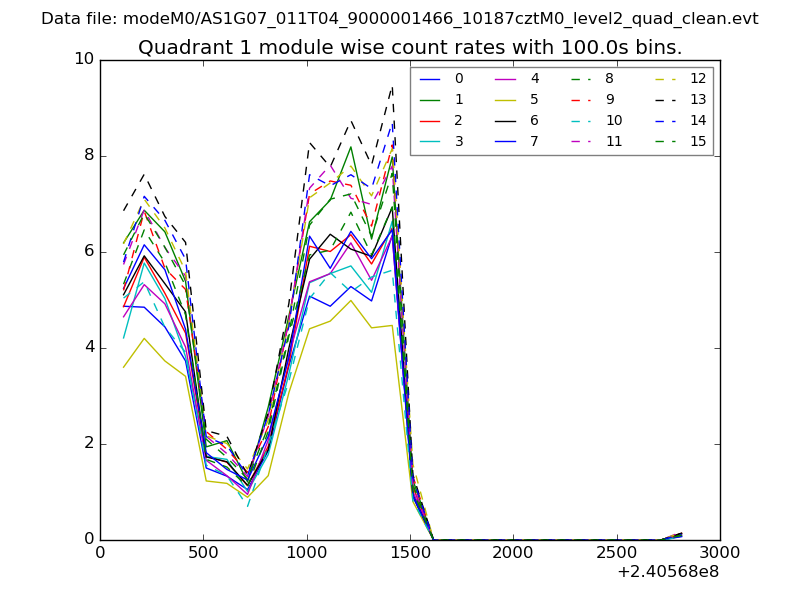
| Module-wise count rates for Quadrant A Data is divided into 100 sec bins |
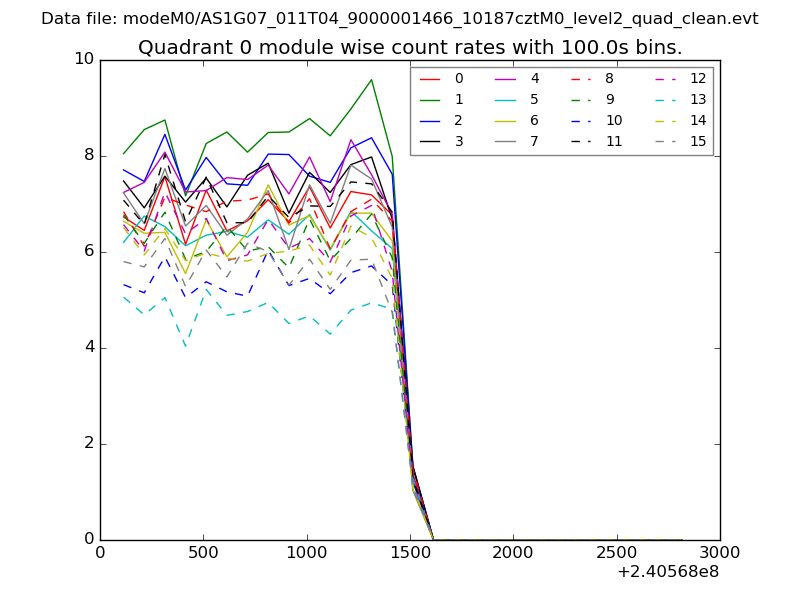 |
 |
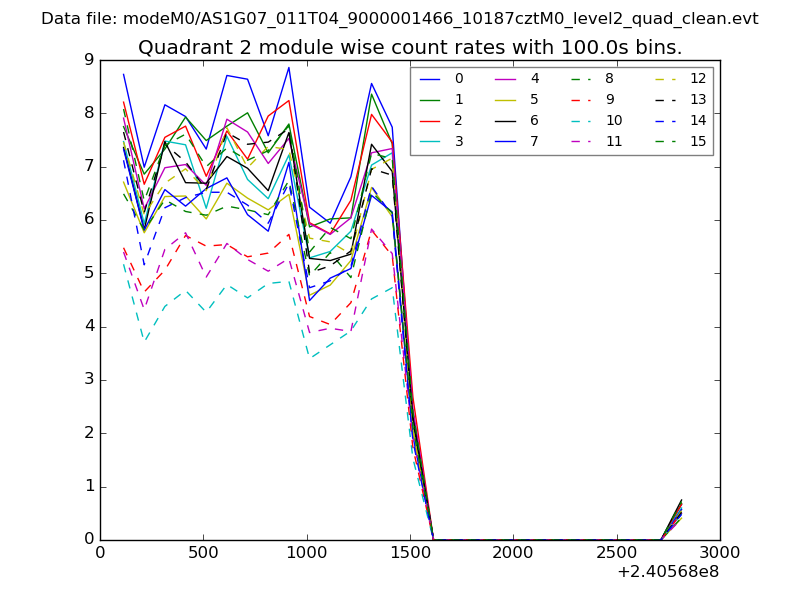
| Module-wise count rates for Quadrant B Data is divided into 100 sec bins |
 |
 |
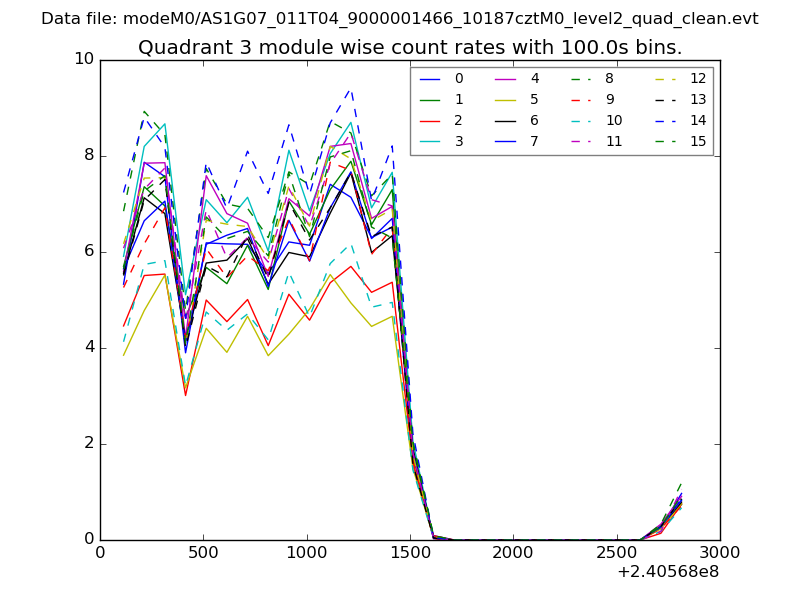
| Module-wise count rates for Quadrant C Data is divided into 100 sec bins |
 |
 |
| Module-wise count rates for Quadrant D Data is divided into 100 sec bins |
 |
 |
| Parameter | Plot |
|---|---|
| CZT HV Monitor | 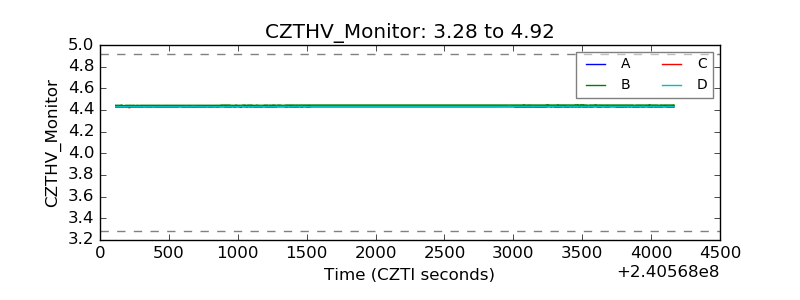 |
| D_VDD | 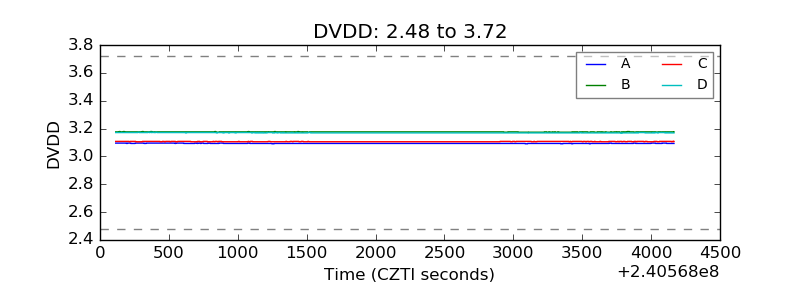 |
| Temperature 1 | 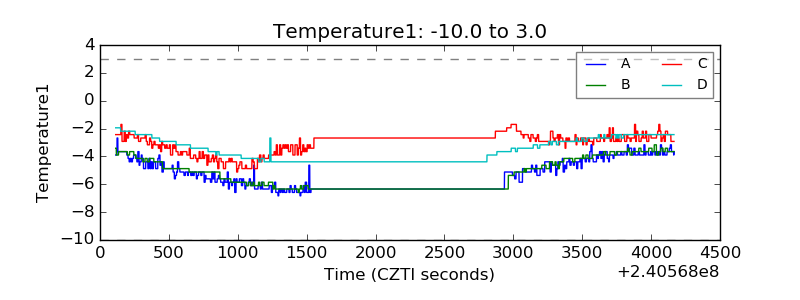 |
| Veto HV Monitor | 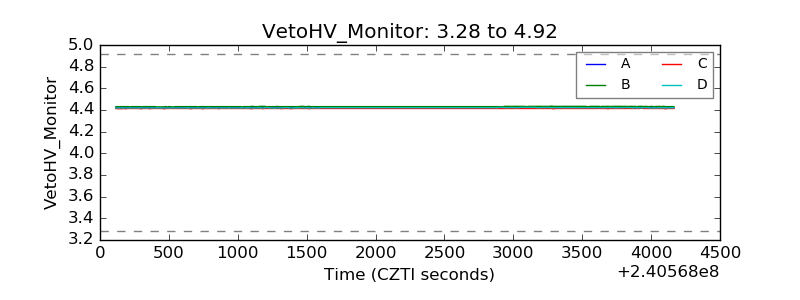 |
| Veto LLD | 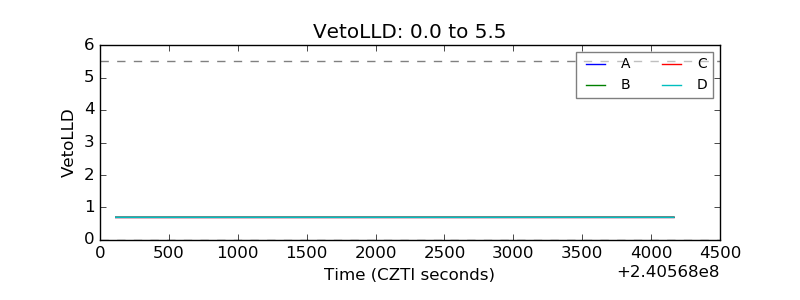 |
| Alpha Counter | 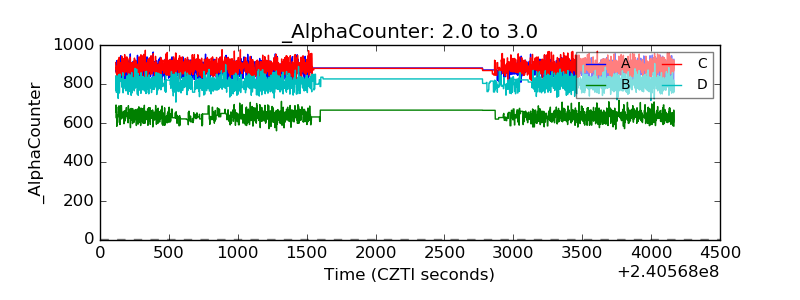 |
| _CPM_Rate | 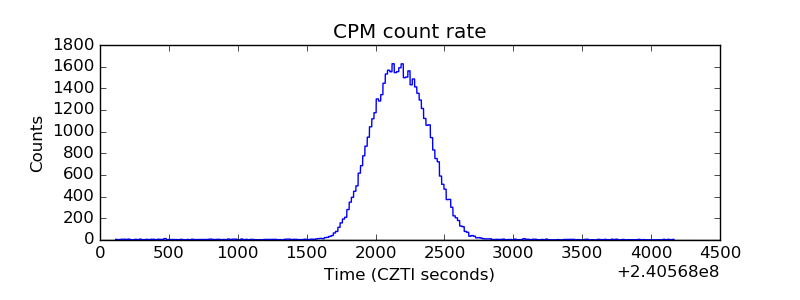 |
| CZT Counter | 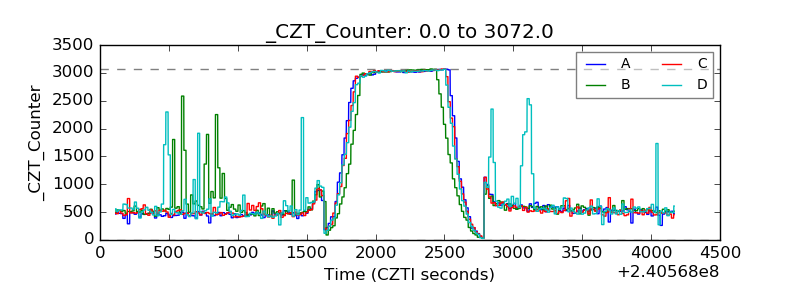 |
| +2.5 Volts monitor |  |
| +5 Volts monitor | 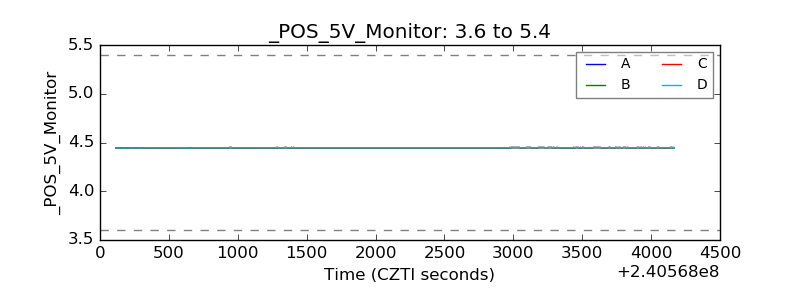 |
| _ROLL_ROT | 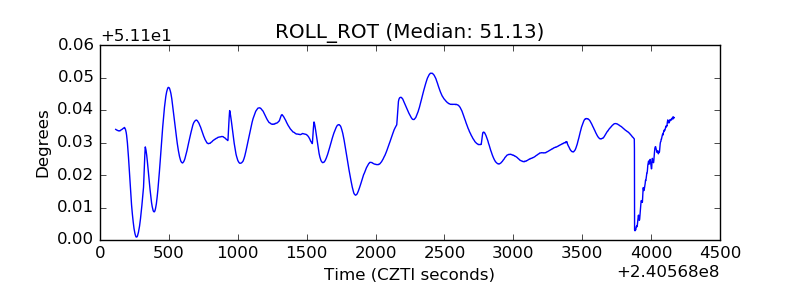 |
| _Roll_DEC | 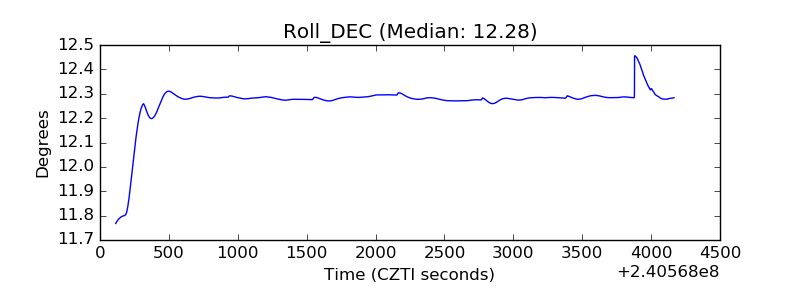 |
| _Roll_RA | 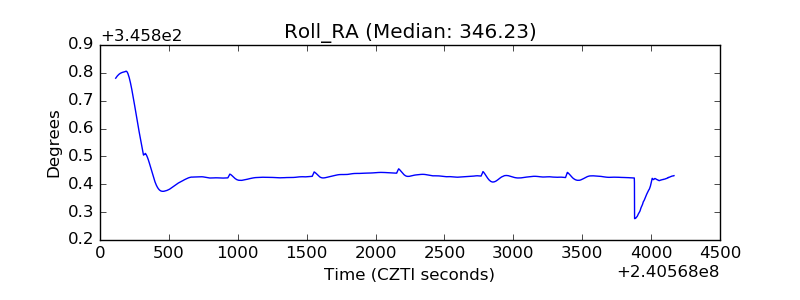 |
| Veto Counter | 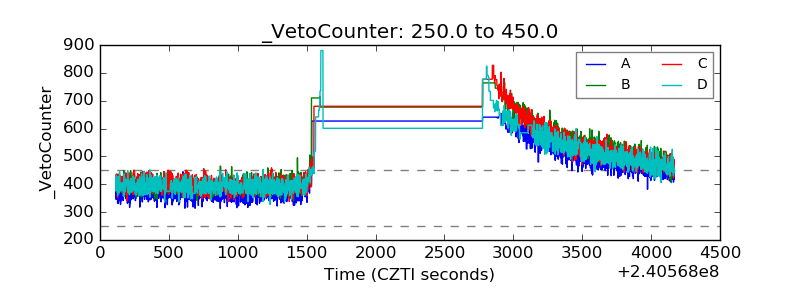 |