| Param | Original file | Final file |
|---|---|---|
| Filename | modeM0/AS1G07_011T04_9000001466_10190cztM0_level2.evt | modeM0/AS1G07_011T04_9000001466_10190cztM0_level2_quad_clean.evt |
| Size (bytes) | 271,152,000 | 50,912,640 |
| Size | 258.6 MB | 48.6 MB |
| Events in quadrant A | 1,931,652 | 319,889 |
| Events in quadrant B | 1,970,055 | 327,725 |
| Events in quadrant C | 1,922,410 | 315,663 |
| Events in quadrant D | 2,122,763 | 304,270 |
| Mode M0 | |||
|---|---|---|---|
| Quadrant | BADHDUFLAG | Total packets | Discarded packets |
| A | 0 | 8164 | 1 |
| B | 0 | 8247 | 1 |
| C | 0 | 8059 | 1 |
| D | 0 | 8747 | 1 |
| Mode M9 | |||
|---|---|---|---|
| Quadrant | BADHDUFLAG | Total packets | Discarded packets |
| A | 0 | 9 | 0 |
| B | 0 | 9 | 0 |
| C | 0 | 9 | 0 |
| D | 0 | 10 | 0 |
| Mode SS | |||
|---|---|---|---|
| Quadrant | BADHDUFLAG | Total packets | Discarded packets |
| A | 0 | 78 | 0 |
| B | 0 | 78 | 0 |
| C | 0 | 78 | 0 |
| D | 0 | 78 | 0 |
| Quadrant | Total seconds | Saturated seconds | Saturation percentage |
|---|---|---|---|
| A | 3876 | 8 | 0.206398% |
| B | 3876 | 11 | 0.283798% |
| C | 3876 | 5 | 0.128999% |
| D | 3876 | 5 | 0.128999% |
Noise dominated data is calculated using 1-second bins in cleaned event files. If a bin has >2000 counts, and if more than 50% of those come from <1% of pixels, then it is considered to be noise-dominated and hence unusable.
| Quadrant | # 1 sec bins | Bins with >0 counts | Bins with >2000 counts | High rate bins dominated by noise | Noise dominated (total time) | Noise dominated (detector-on time) | Marked lightcurve |
|---|---|---|---|---|---|---|---|
| A | 3876 | 3876 | 0 | 0 | 0.00% | 0.00% | 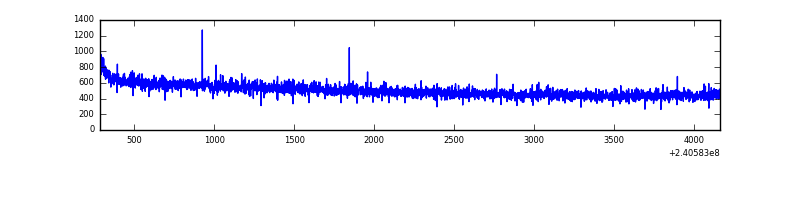 |
| B | 3876 | 3876 | 0 | 0 | 0.00% | 0.00% | 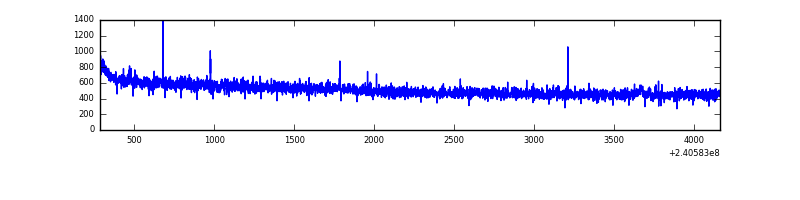 |
| C | 3876 | 3876 | 0 | 0 | 0.00% | 0.00% | 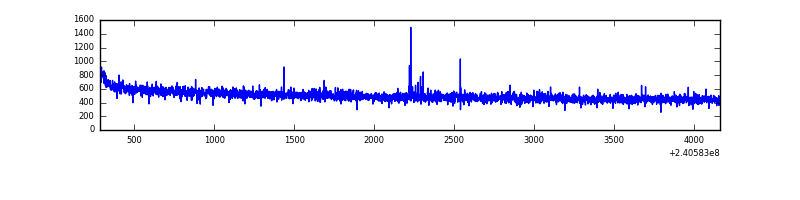 |
| D | 3876 | 3876 | 3 | 3 | 0.08% | 0.08% | 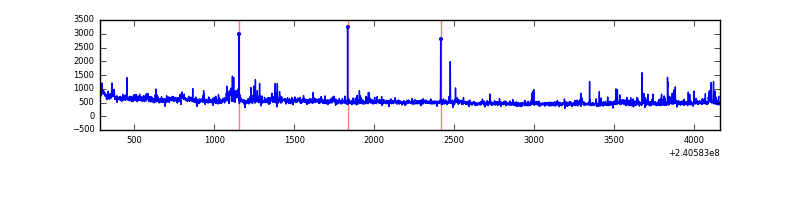 |
Top three noisy pixels from each quadrant. If the there are fewer than three noisy pixels in the level2.evt file, extra rows are filled as -1
| Pixel properties | Quadrant properties | ||||||
|---|---|---|---|---|---|---|---|
| Quadrant | DetID | PixID | Counts | Sigma | Mean | Median | Sigma |
| A | 13 | 253 | 5128 | 45.96 | 500 | 492 | 100.9 |
| A | 0 | 226 | 4476 | 39.49 | 500 | 492 | 100.9 |
| A | 12 | 194 | 3913 | 33.91 | 500 | 492 | 100.9 |
| B | 12 | 111 | 10254 | 103.1 | 504 | 494 | 94.7 |
| B | 11 | 111 | 8435 | 83.88 | 504 | 494 | 94.7 |
| B | 0 | 219 | 7137 | 70.17 | 504 | 494 | 94.7 |
| C | 14 | 234 | 6361 | 51.93 | 490 | 495 | 113.0 |
| C | 13 | 61 | 3632 | 27.77 | 490 | 495 | 113.0 |
| C | 14 | 128 | 2917 | 21.44 | 490 | 495 | 113.0 |
| D | 1 | 52 | 129556 | 1102.79 | 487 | 476 | 117.0 |
| D | 8 | 195 | 108678 | 924.42 | 487 | 476 | 117.0 |
| D | 2 | 14 | 16406 | 136.1 | 487 | 476 | 117.0 |
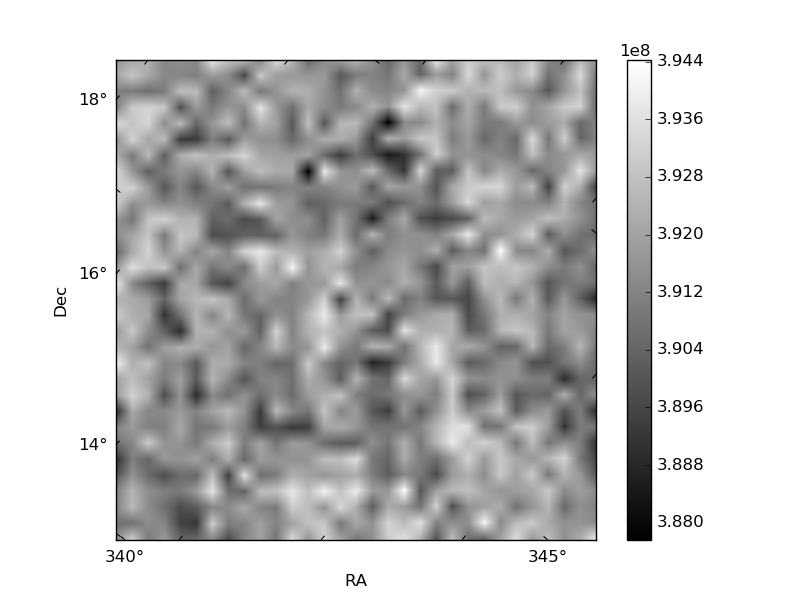
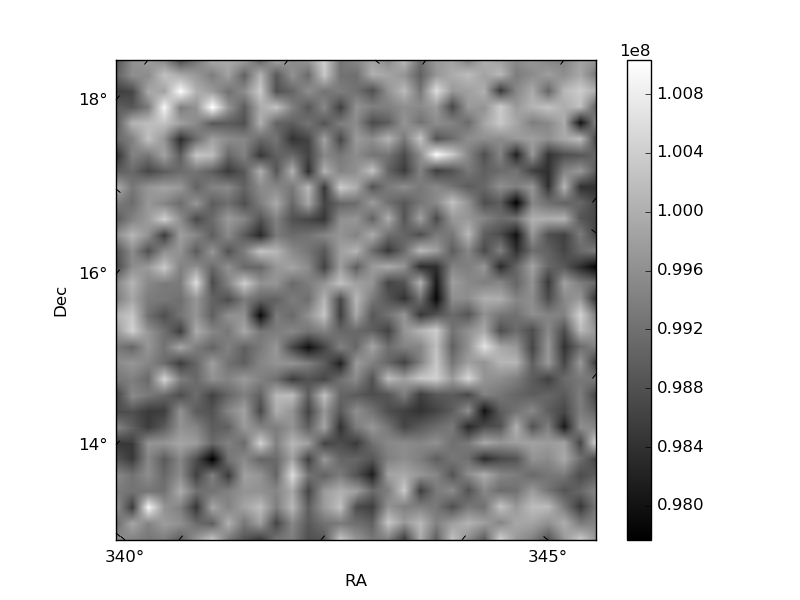
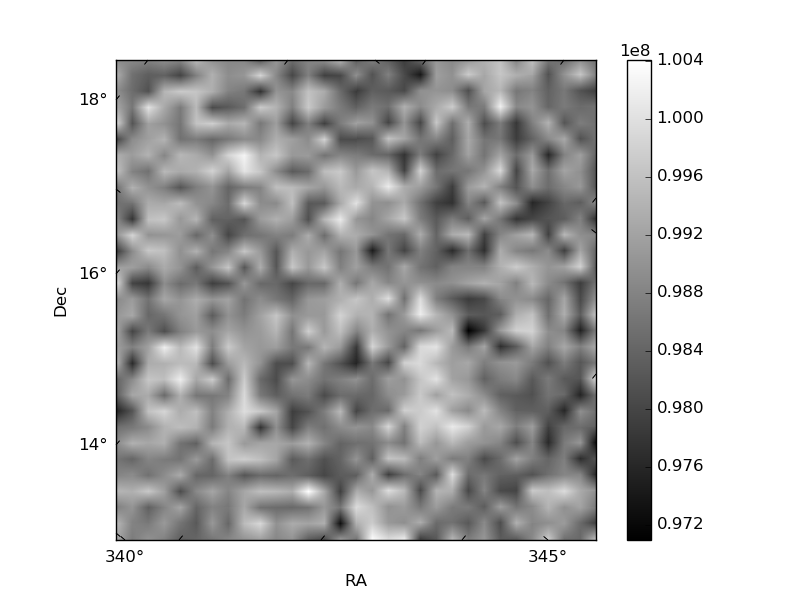
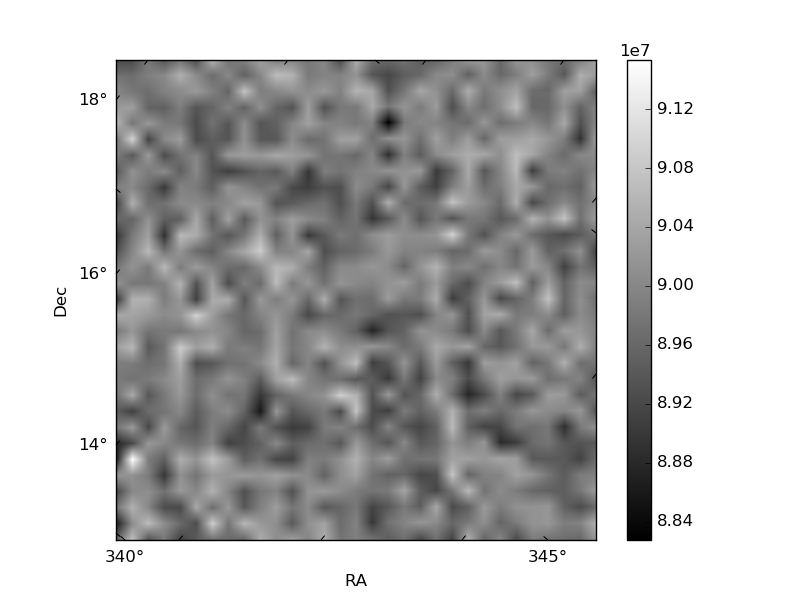
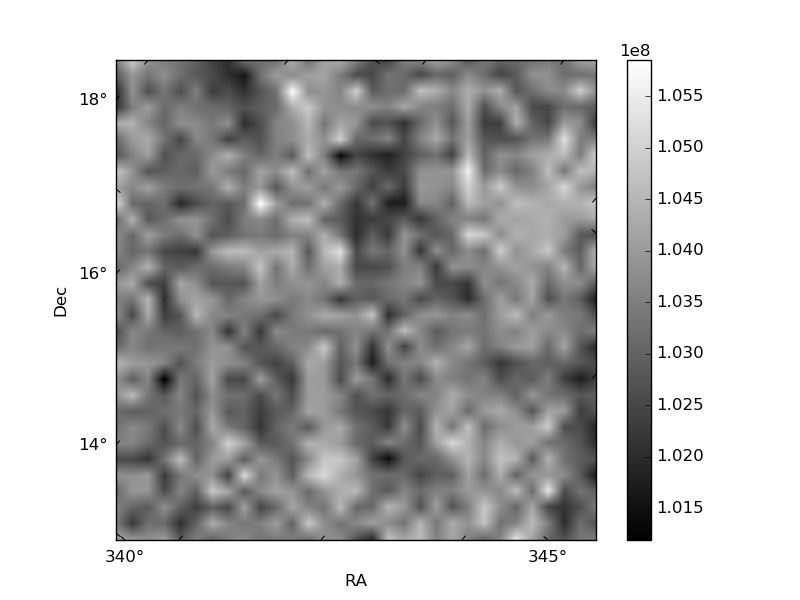
Histogram calculated using DETX and DETY for each event in the final _common_clean file
| Quadrant A | 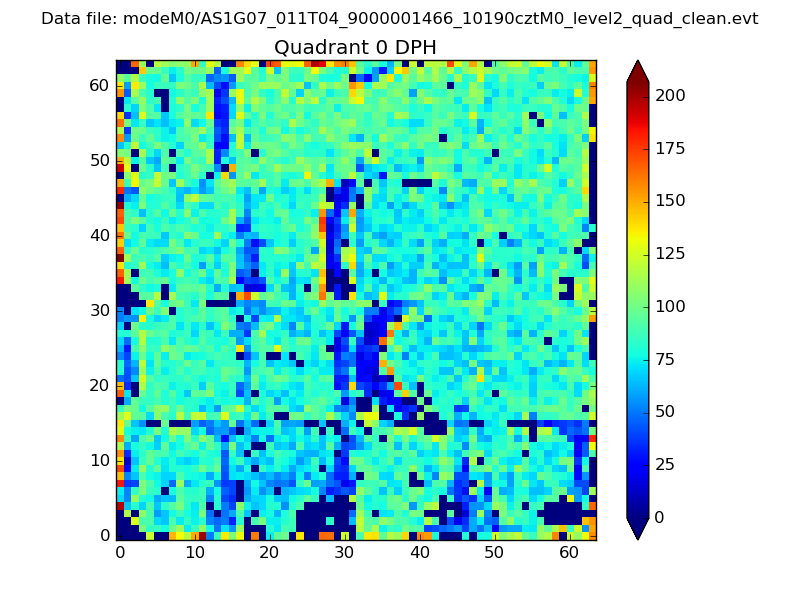 |
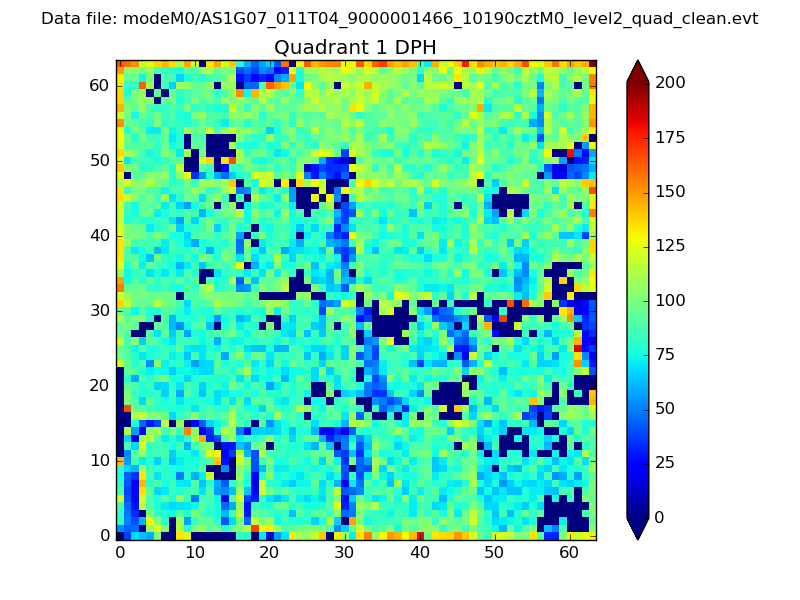 |
Quadrant B |
|---|---|---|---|
| Quadrant D | 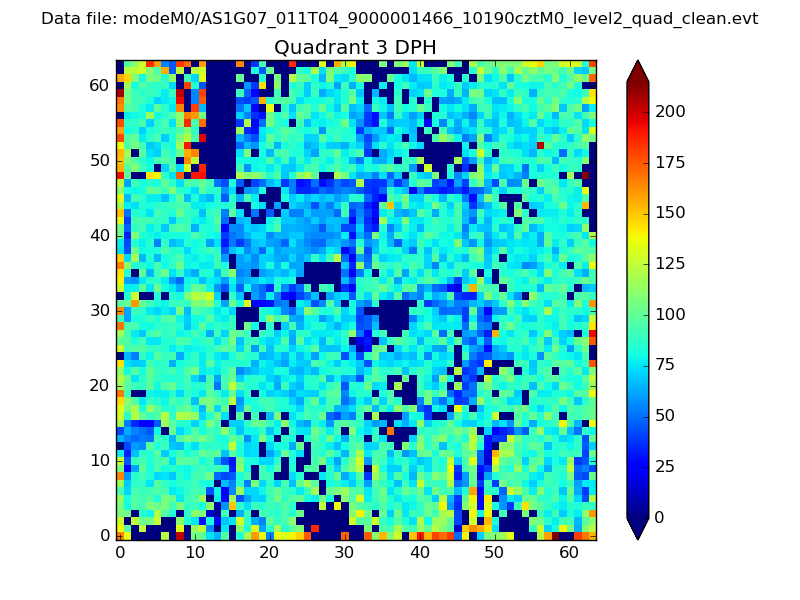 |
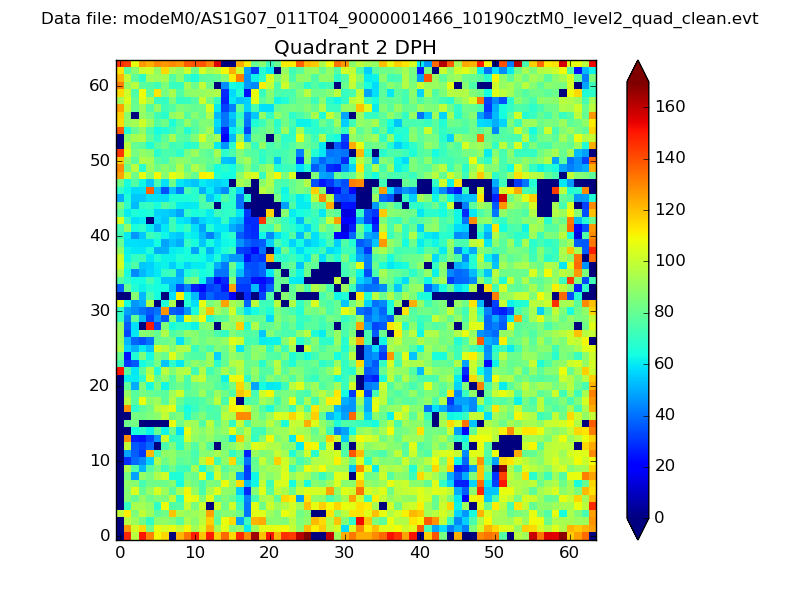 |
Quadrant C |
| Plot type | Count rate plots | Images |
|---|---|---|
| Comparison with Poisson distribution Blue bars denote a histogram of data divided into 1 sec bins. Red curve is a Poisson curve with rate = median count rate of data. |
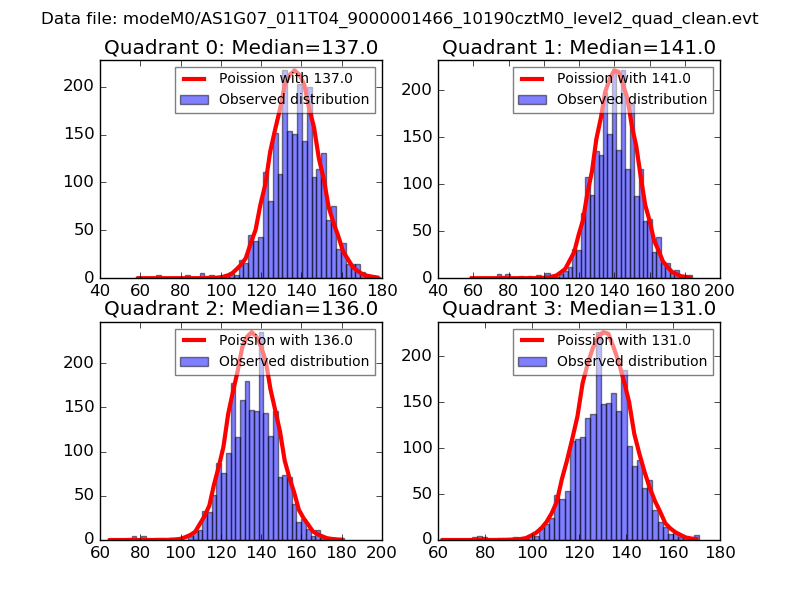 |
 |
| Quadrant-wise count rates Data is divided into 100 sec bins |
 |
|
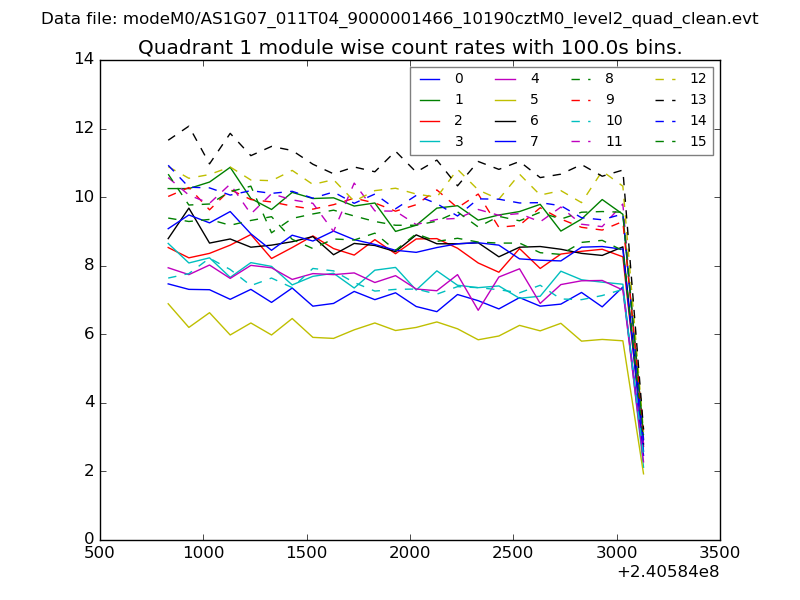
| Module-wise count rates for Quadrant A Data is divided into 100 sec bins |
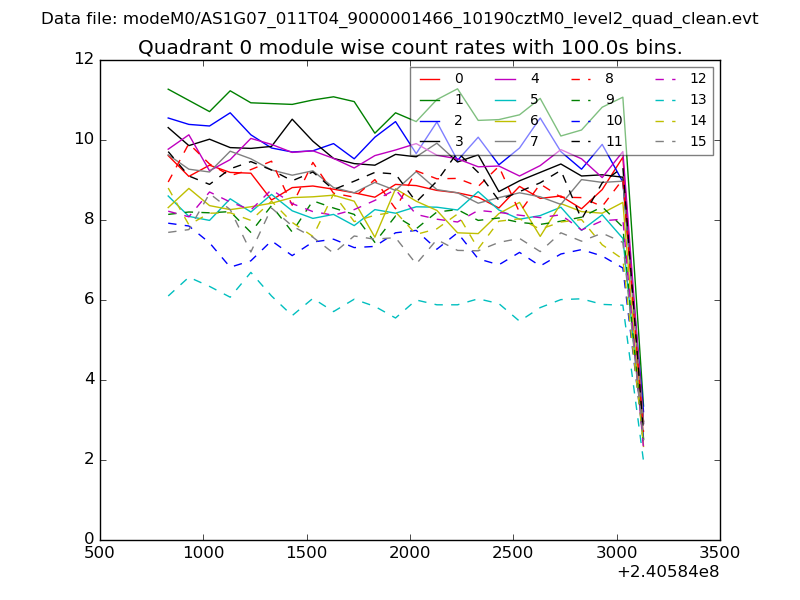 |
 |
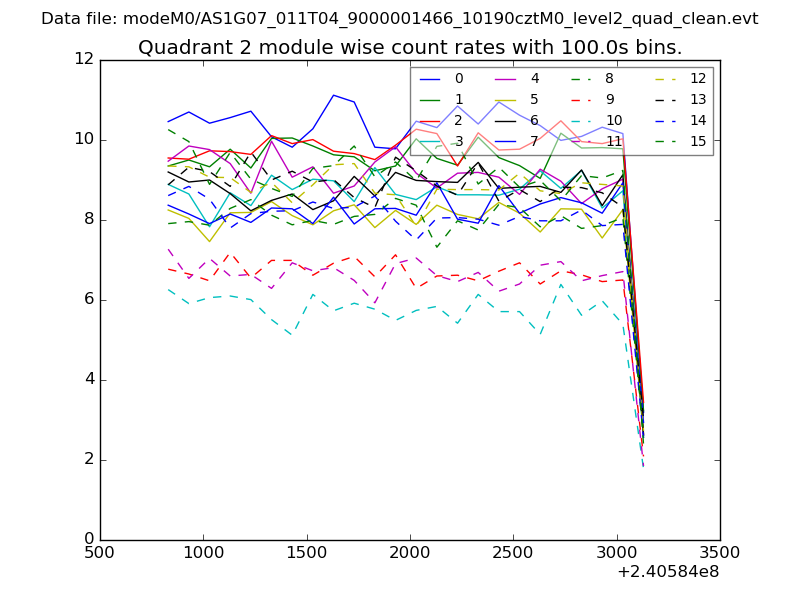
| Module-wise count rates for Quadrant B Data is divided into 100 sec bins |
 |
 |
| Module-wise count rates for Quadrant C Data is divided into 100 sec bins |
 |
 |
| Module-wise count rates for Quadrant D Data is divided into 100 sec bins |
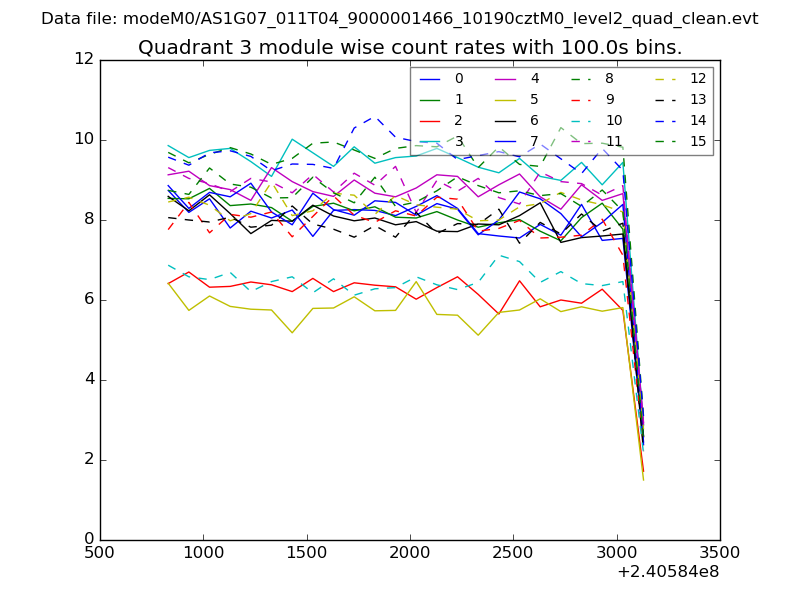 |
 |
| Parameter | Plot |
|---|---|
| CZT HV Monitor | 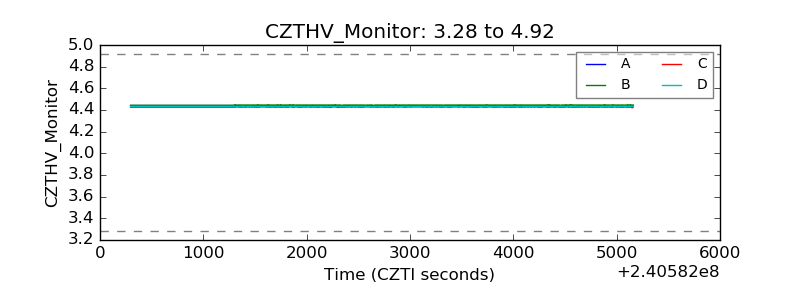 |
| D_VDD | 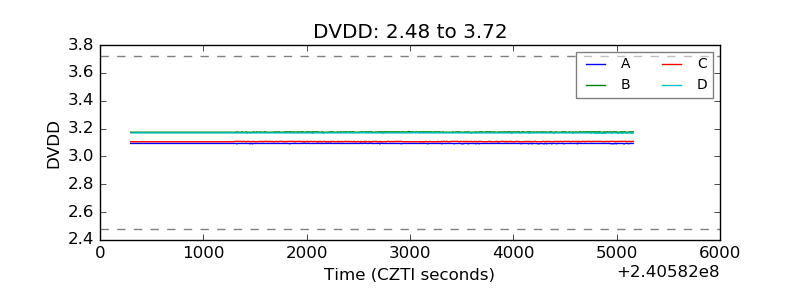 |
| Temperature 1 | 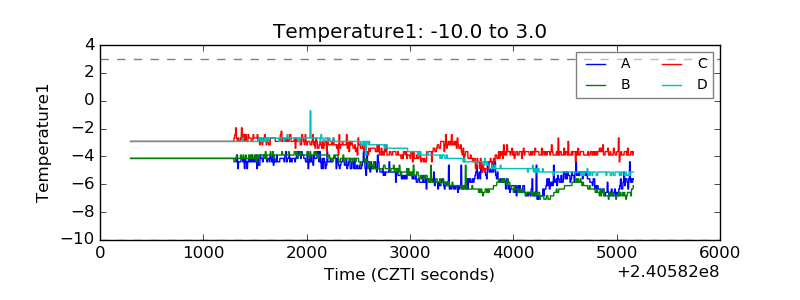 |
| Veto HV Monitor |  |
| Veto LLD | 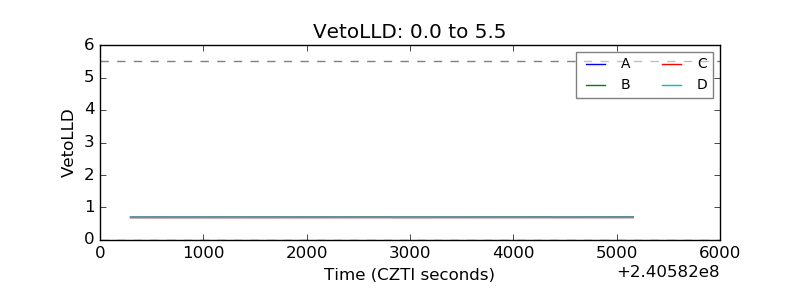 |
| Alpha Counter |  |
| _CPM_Rate | 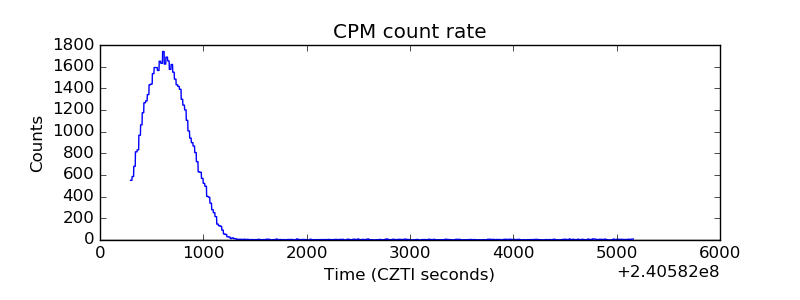 |
| CZT Counter | 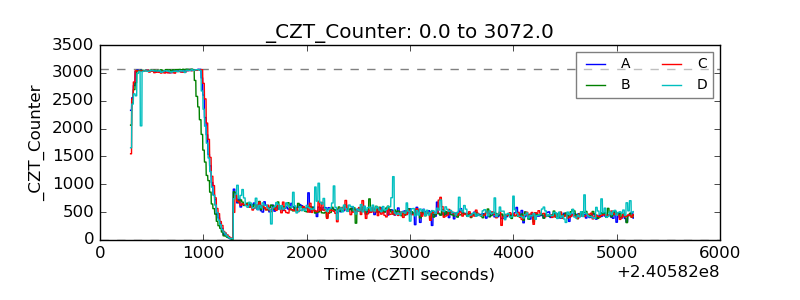 |
| +2.5 Volts monitor |  |
| +5 Volts monitor |  |
| _ROLL_ROT | 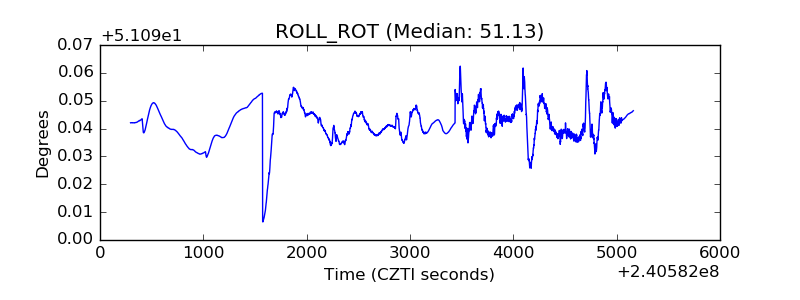 |
| _Roll_DEC | 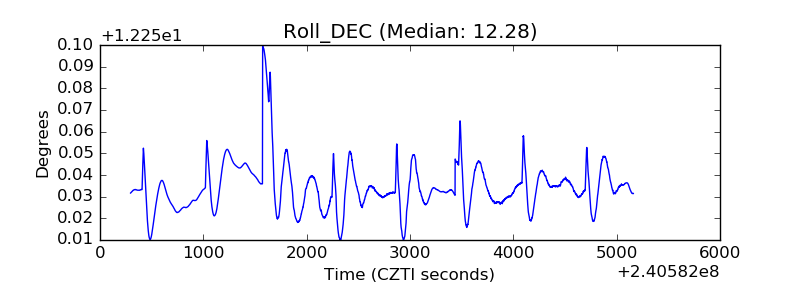 |
| _Roll_RA | 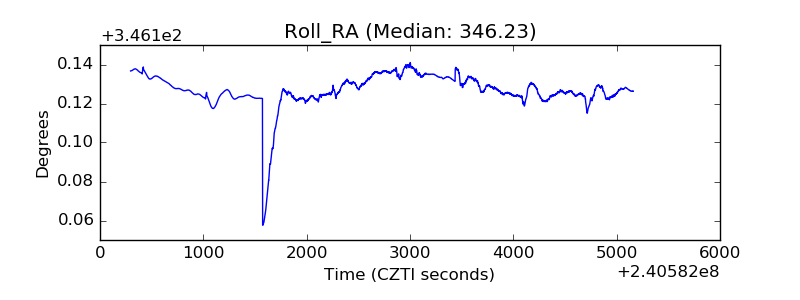 |
| Veto Counter | 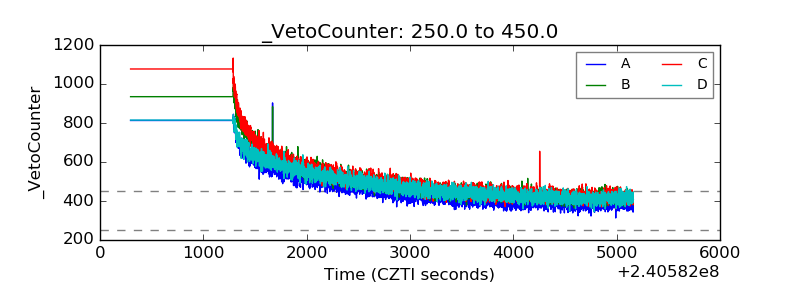 |