| Param | Original file | Final file |
|---|---|---|
| Filename | modeM0/AS1A03_099T01_9000001472cztM0_level2.fits | modeM0/AS1A03_099T01_9000001472cztM0_level2_quad_clean.evt |
| Size (bytes) | 1,175,503,680 | 1,192,354,560 |
| Size | 1.1 GB | 1.1 GB |
| Events in quadrant A | 7,070,164 | 7,127,825 |
| Events in quadrant B | 6,840,312 | 7,132,165 |
| Events in quadrant C | 7,046,270 | 6,963,486 |
| Events in quadrant D | 6,214,460 | 6,463,447 |
| Mode M0 | |||
|---|---|---|---|
| Quadrant | BADHDUFLAG | Total packets | Discarded packets |
| A | 0 | 277730 | 0 |
| B | 0 | 270293 | 0 |
| C | 0 | 253563 | 0 |
| D | 0 | 303264 | 0 |
| Mode SS | |||
|---|---|---|---|
| Quadrant | BADHDUFLAG | Total packets | Discarded packets |
| A | 0 | 2519 | 0 |
| B | 0 | 2517 | 0 |
| C | 0 | 2512 | 0 |
| D | 0 | 2514 | 0 |
| Mode M9 | |||
|---|---|---|---|
| Quadrant | BADHDUFLAG | Total packets | Discarded packets |
| A | 0 | 222 | 0 |
| B | 0 | 223 | 0 |
| C | 0 | 223 | 0 |
| D | 0 | 221 | 0 |
| Quadrant | Total seconds | Saturated seconds | Saturation percentage |
|---|---|---|---|
| A | 121964 | 2250 | 1.844807% |
| B | 122132 | 1815 | 1.486097% |
| C | 122884 | 914 | 0.743791% |
| D | 125238 | 2543 | 2.030534% |
Noise dominated data is calculated using 1-second bins in cleaned event files. If a bin has >2000 counts, and if more than 50% of those come from <1% of pixels, then it is considered to be noise-dominated and hence unusable.
| Quadrant | # 1 sec bins | Bins with >0 counts | Bins with >2000 counts | High rate bins dominated by noise | Noise dominated (total time) | Noise dominated (detector-on time) | Marked lightcurve |
|---|---|---|---|---|---|---|---|
| A | 149350 | 125565 | 0 | 0 | 0.00% | 0.00% | 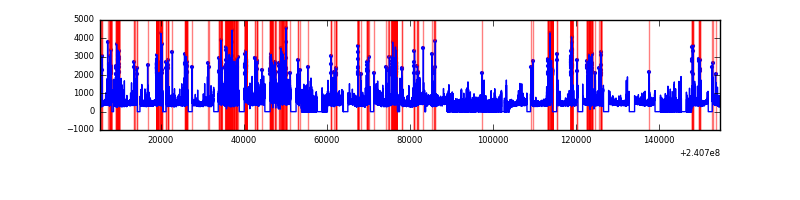 |
| B | 149350 | 125839 | 0 | 0 | 0.00% | 0.00% | 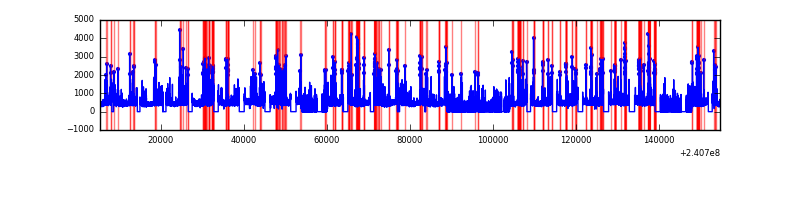 |
| C | 149350 | 126262 | 0 | 0 | 0.00% | 0.00% |  |
| D | 149350 | 126479 | 0 | 0 | 0.00% | 0.00% | 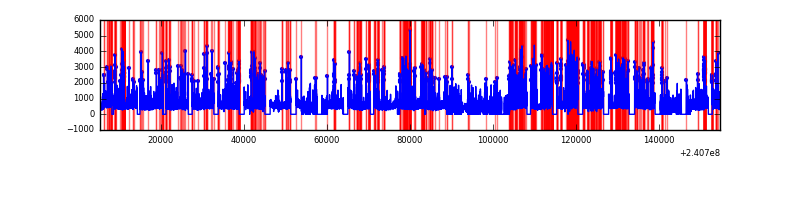 |
Top three noisy pixels from each quadrant. If the there are fewer than three noisy pixels in the level2.evt file, extra rows are filled as -1
| Pixel properties | Quadrant properties | ||||||
|---|---|---|---|---|---|---|---|
| Quadrant | DetID | PixID | Counts | Sigma | Mean | Median | Sigma |
| A | 0 | 29 | 6815 | 11.27 | 1837 | 1722 | 451.9 |
| A | 7 | 110 | 5682 | 8.76 | 1837 | 1722 | 451.9 |
| A | 9 | 19 | 5281 | 7.88 | 1837 | 1722 | 451.9 |
| B | 2 | 9 | 5666 | 11.19 | 1806 | 1723 | 352.5 |
| B | 3 | 17 | 4596 | 8.15 | 1806 | 1723 | 352.5 |
| B | 14 | 254 | 4574 | 8.09 | 1806 | 1723 | 352.5 |
| C | 1 | 81 | 5232 | 7.23 | 1859 | 1730 | 484.2 |
| C | 1 | 80 | 5196 | 7.16 | 1859 | 1730 | 484.2 |
| C | 12 | 241 | 4988 | 6.73 | 1859 | 1730 | 484.2 |
| D | 6 | 231 | 4607 | 6.36 | 1770 | 1613 | 470.5 |
| D | 3 | 14 | 4532 | 6.2 | 1770 | 1613 | 470.5 |
| D | 7 | 5 | 4374 | 5.87 | 1770 | 1613 | 470.5 |
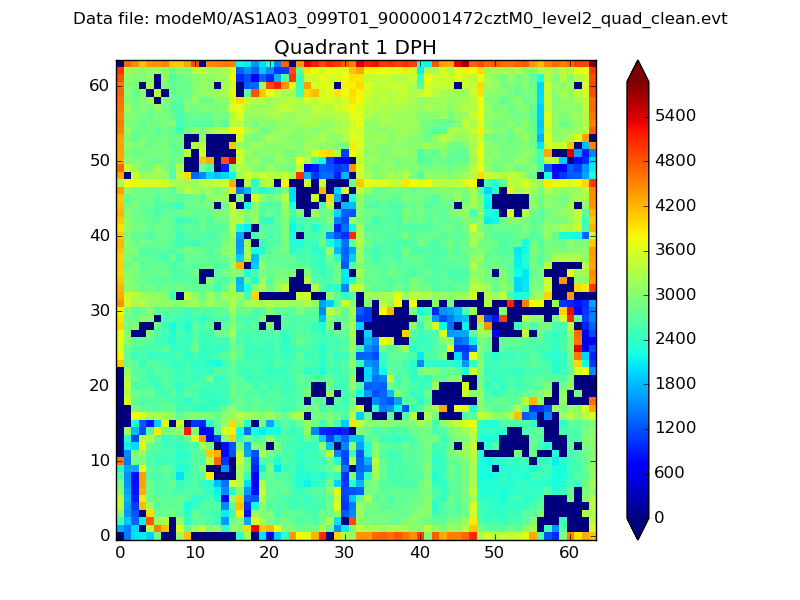
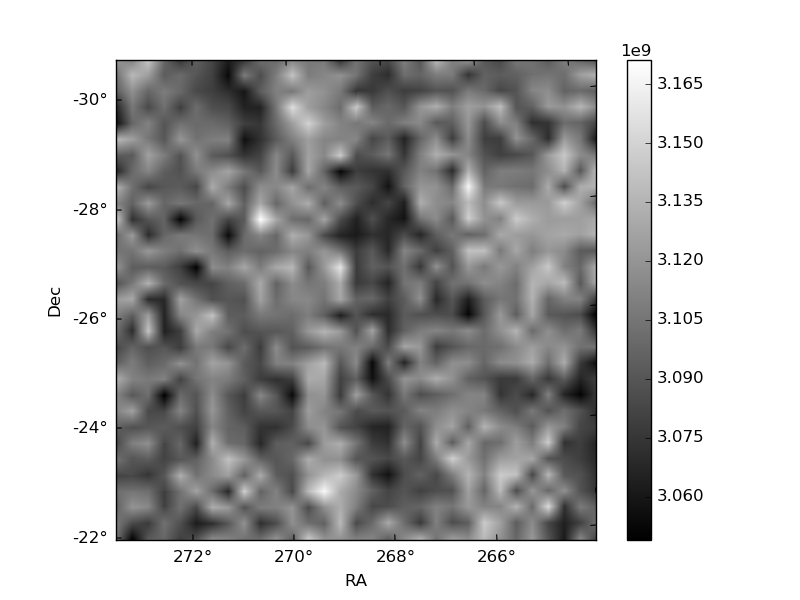
Histogram calculated using DETX and DETY for each event in the final _common_clean file
| Quadrant A |  |
 |
Quadrant B |
|---|---|---|---|
| Quadrant D | 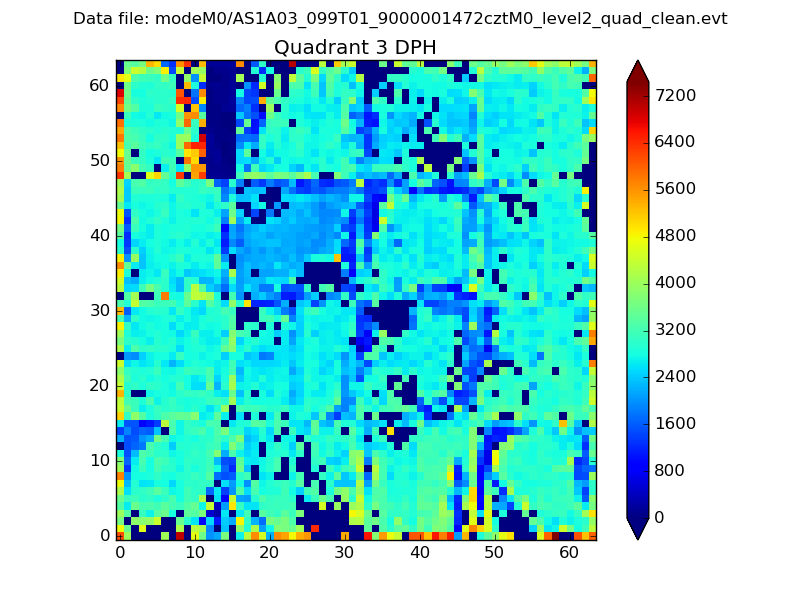 |
 |
Quadrant C |
| Plot type | Count rate plots | Images |
|---|---|---|
| Comparison with Poisson distribution Blue bars denote a histogram of data divided into 1 sec bins. Red curve is a Poisson curve with rate = median count rate of data. |
 |
 |
| Quadrant-wise count rates Data is divided into 100 sec bins |
 |
|
| Module-wise count rates for Quadrant A Data is divided into 100 sec bins |
 |
 |
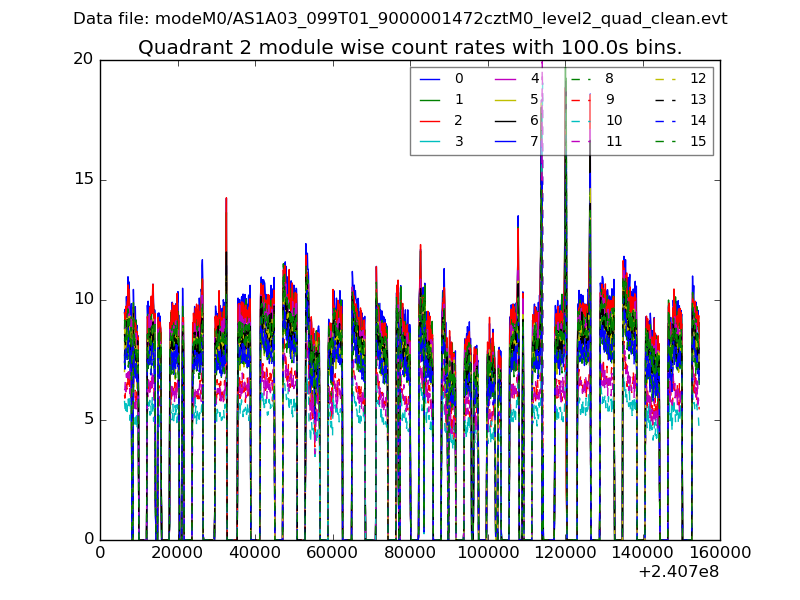
| Module-wise count rates for Quadrant B Data is divided into 100 sec bins |
 |
 |
| Module-wise count rates for Quadrant C Data is divided into 100 sec bins |
 |
 |
| Module-wise count rates for Quadrant D Data is divided into 100 sec bins |
 |
 |
| Parameter | Plot |
|---|---|
| CZT HV Monitor |  |
| D_VDD | 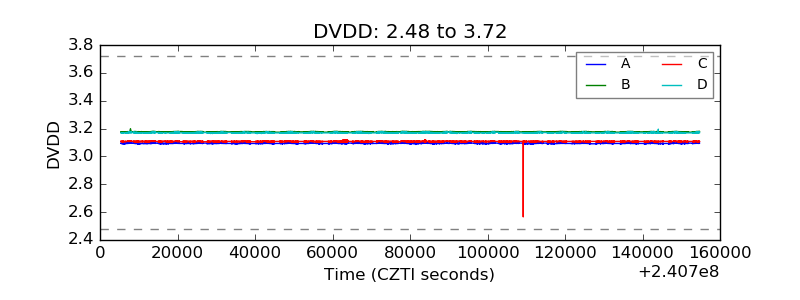 |
| Temperature 1 |  |
| Veto HV Monitor |  |
| Veto LLD |  |
| Alpha Counter |  |
| _CPM_Rate |  |
| CZT Counter | 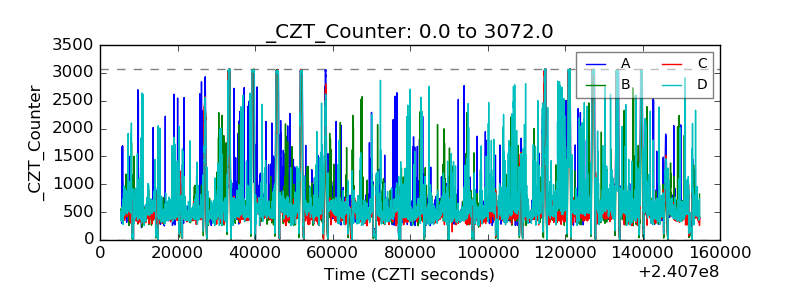 |
| +2.5 Volts monitor |  |
| +5 Volts monitor | 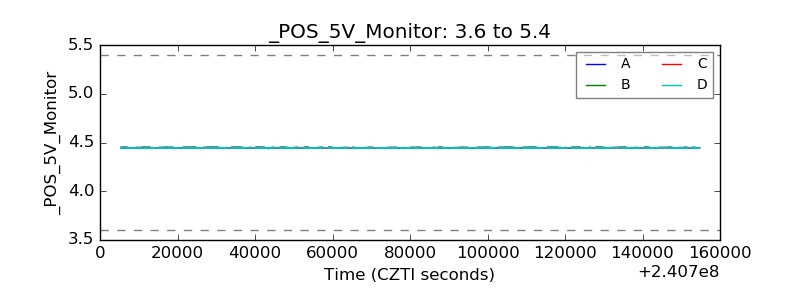 |
| _ROLL_ROT |  |
| _Roll_DEC |  |
| _Roll_RA |  |
| Veto Counter |  |