| Param | Original file | Final file |
|---|---|---|
| Filename | modeM0/AS1A03_099T01_9000001472_10212cztM0_level2.evt | modeM0/AS1A03_099T01_9000001472_10212cztM0_level2_quad_clean.evt |
| Size (bytes) | 911,998,080 | 160,640,640 |
| Size | 869.7 MB | 153.2 MB |
| Events in quadrant A | 6,848,830 | 987,118 |
| Events in quadrant B | 6,479,887 | 1,010,341 |
| Events in quadrant C | 5,839,434 | 999,530 |
| Events in quadrant D | 7,554,757 | 952,616 |
| Mode M0 | |||
|---|---|---|---|
| Quadrant | BADHDUFLAG | Total packets | Discarded packets |
| A | 0 | 29324 | 4 |
| B | 0 | 28054 | 3 |
| C | 0 | 26840 | 3 |
| D | 0 | 31469 | 9 |
| Mode SS | |||
|---|---|---|---|
| Quadrant | BADHDUFLAG | Total packets | Discarded packets |
| A | 0 | 272 | 0 |
| B | 0 | 272 | 0 |
| C | 0 | 272 | 0 |
| D | 0 | 272 | 0 |
| Mode M9 | |||
|---|---|---|---|
| Quadrant | BADHDUFLAG | Total packets | Discarded packets |
| A | 0 | 18 | 0 |
| B | 0 | 18 | 0 |
| C | 0 | 18 | 0 |
| D | 0 | 18 | 0 |
| Quadrant | Total seconds | Saturated seconds | Saturation percentage |
|---|---|---|---|
| A | 13248 | 267 | 2.015399% |
| B | 13248 | 120 | 0.905797% |
| C | 13248 | 49 | 0.369867% |
| D | 13246 | 196 | 1.479692% |
Noise dominated data is calculated using 1-second bins in cleaned event files. If a bin has >2000 counts, and if more than 50% of those come from <1% of pixels, then it is considered to be noise-dominated and hence unusable.
| Quadrant | # 1 sec bins | Bins with >0 counts | Bins with >2000 counts | High rate bins dominated by noise | Noise dominated (total time) | Noise dominated (detector-on time) | Marked lightcurve |
|---|---|---|---|---|---|---|---|
| A | 15078 | 13251 | 143 | 143 | 0.95% | 1.08% | 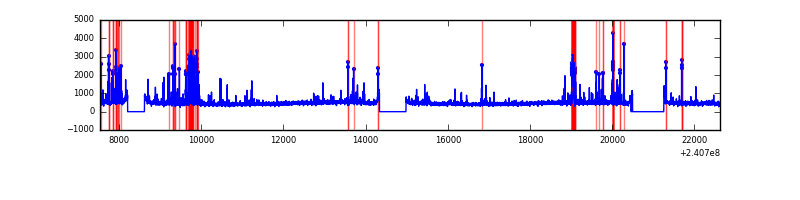 |
| B | 15078 | 13251 | 12 | 12 | 0.08% | 0.09% | 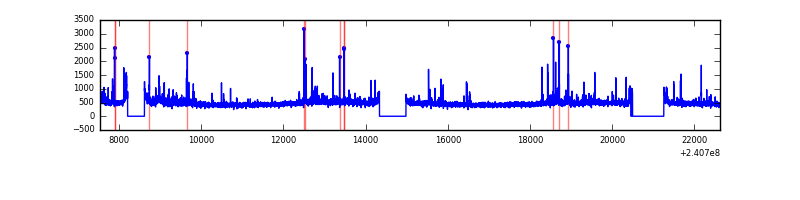 |
| C | 15078 | 13251 | 0 | 0 | 0.00% | 0.00% |  |
| D | 15078 | 13252 | 130 | 130 | 0.86% | 0.98% | 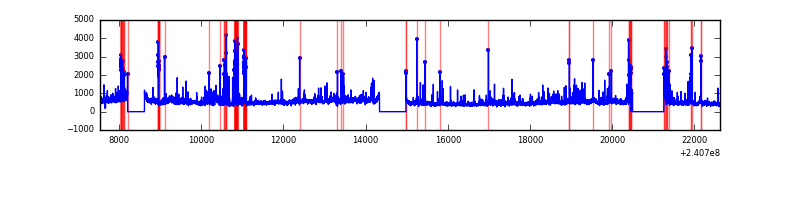 |
Top three noisy pixels from each quadrant. If the there are fewer than three noisy pixels in the level2.evt file, extra rows are filled as -1
| Pixel properties | Quadrant properties | ||||||
|---|---|---|---|---|---|---|---|
| Quadrant | DetID | PixID | Counts | Sigma | Mean | Median | Sigma |
| A | 15 | 223 | 506671 | 1634.11 | 1528 | 1496 | 309.1 |
| A | 15 | 239 | 204698 | 657.31 | 1528 | 1496 | 309.1 |
| A | 4 | 2 | 157559 | 504.82 | 1528 | 1496 | 309.1 |
| B | 4 | 239 | 148766 | 499.33 | 1549 | 1512 | 294.9 |
| B | 11 | 51 | 83972 | 279.62 | 1549 | 1512 | 294.9 |
| B | 0 | 214 | 83711 | 278.73 | 1549 | 1512 | 294.9 |
| C | 13 | 61 | 11297 | 28.2 | 1491 | 1499 | 347.4 |
| C | 14 | 234 | 10262 | 25.22 | 1491 | 1499 | 347.4 |
| C | 4 | 175 | 8671 | 20.64 | 1491 | 1499 | 347.4 |
| D | 8 | 195 | 712417 | 1843.11 | 1460 | 1429 | 385.8 |
| D | 1 | 52 | 588098 | 1520.83 | 1460 | 1429 | 385.8 |
| D | 13 | 104 | 180705 | 464.74 | 1460 | 1429 | 385.8 |
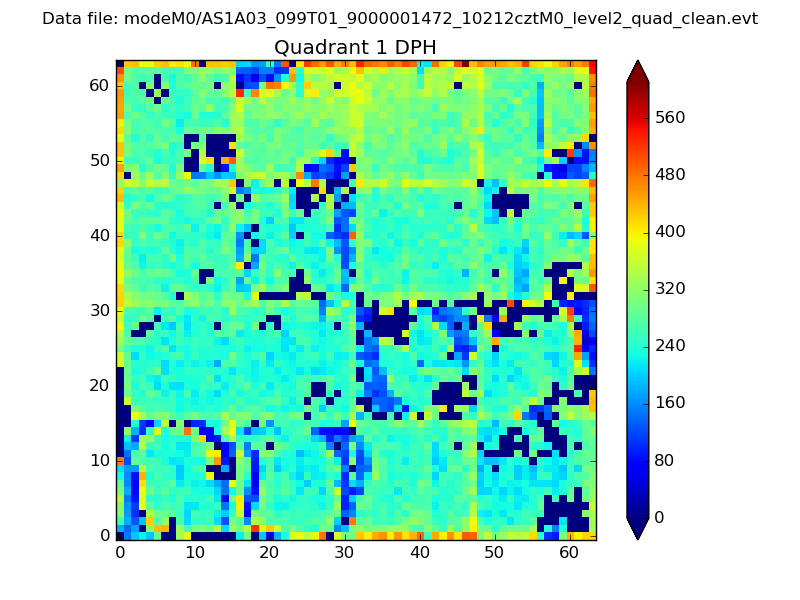
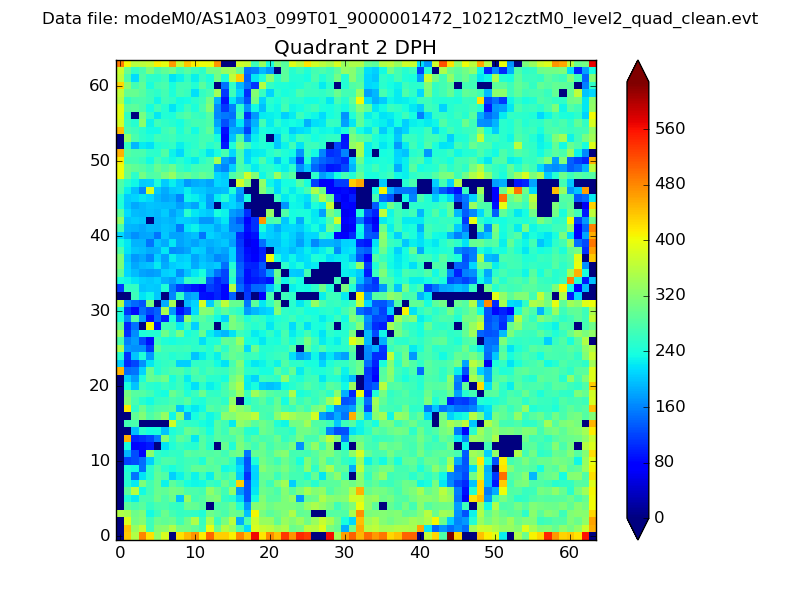
Histogram calculated using DETX and DETY for each event in the final _common_clean file
| Quadrant A | 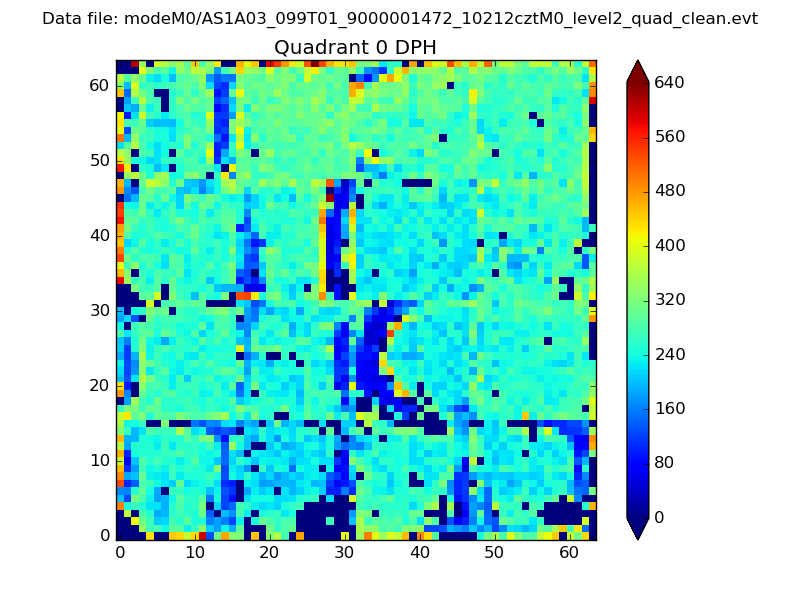 |
 |
Quadrant B |
|---|---|---|---|
| Quadrant D | 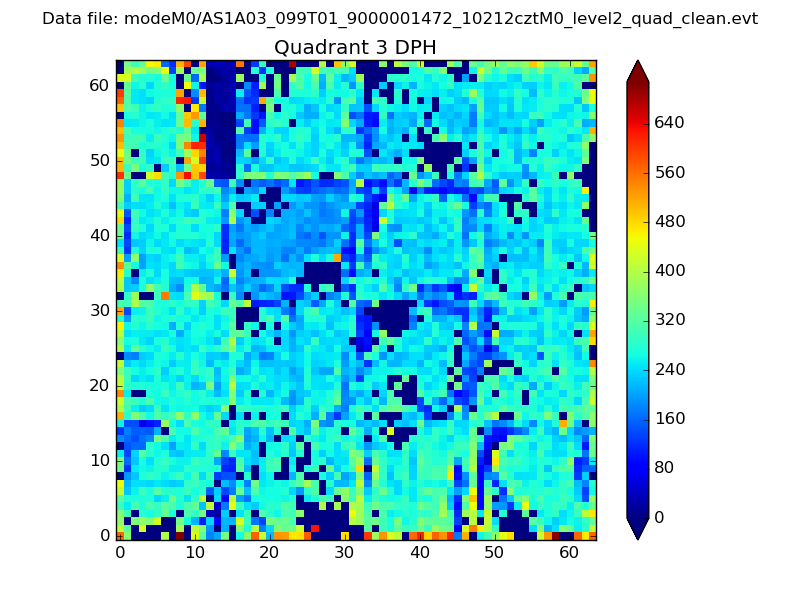 |
 |
Quadrant C |
| Plot type | Count rate plots | Images |
|---|---|---|
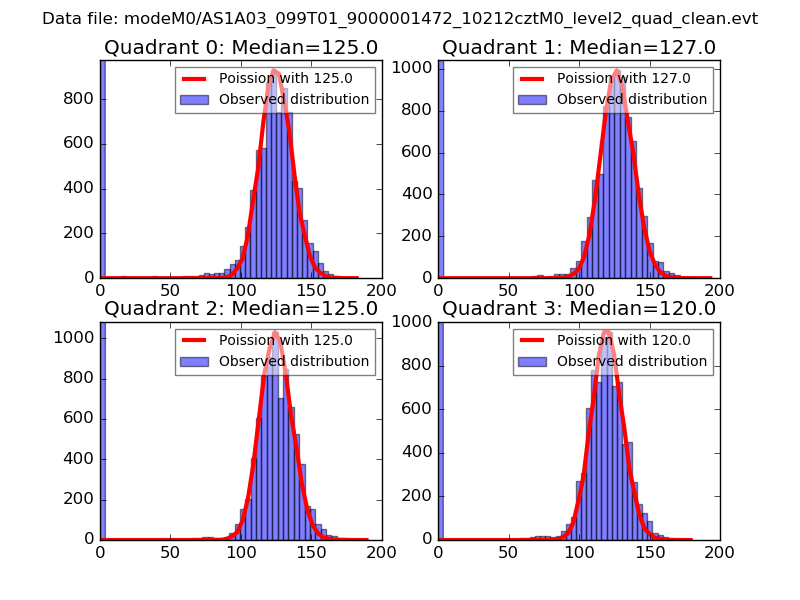
| Comparison with Poisson distribution Blue bars denote a histogram of data divided into 1 sec bins. Red curve is a Poisson curve with rate = median count rate of data. |
 |
 |
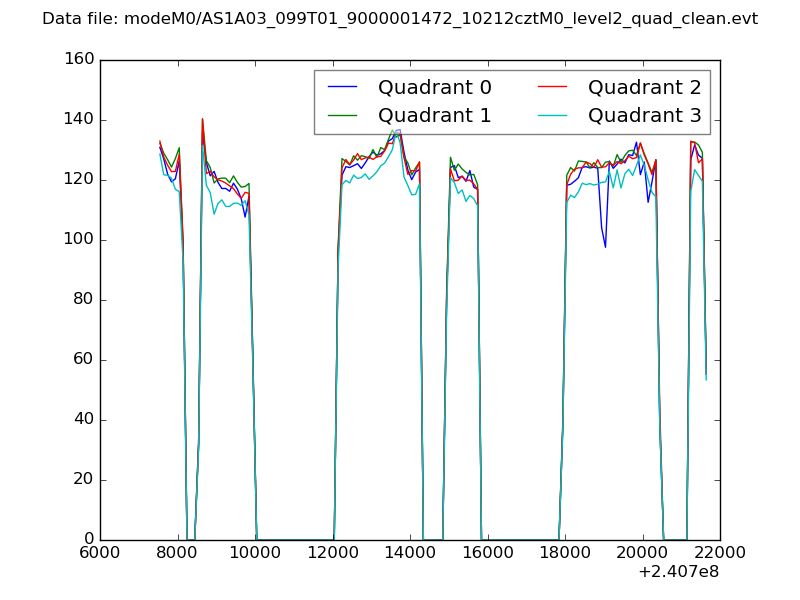
| Quadrant-wise count rates Data is divided into 100 sec bins |
 |
|
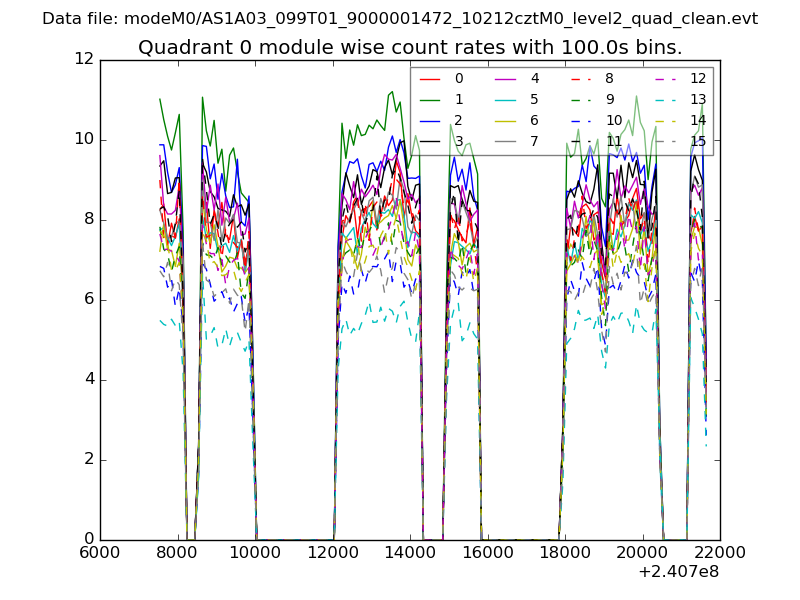
| Module-wise count rates for Quadrant A Data is divided into 100 sec bins |
 |
 |
| Module-wise count rates for Quadrant B Data is divided into 100 sec bins |
 |
 |
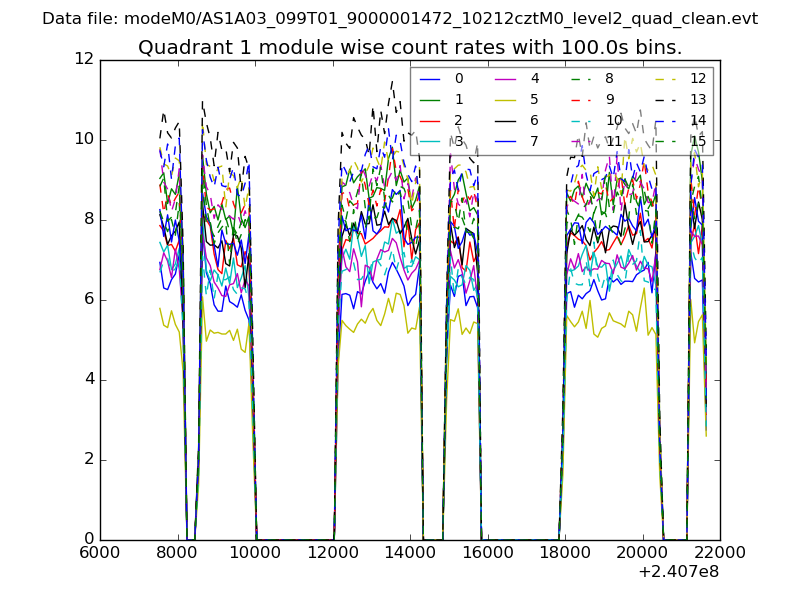
| Module-wise count rates for Quadrant C Data is divided into 100 sec bins |
 |
 |
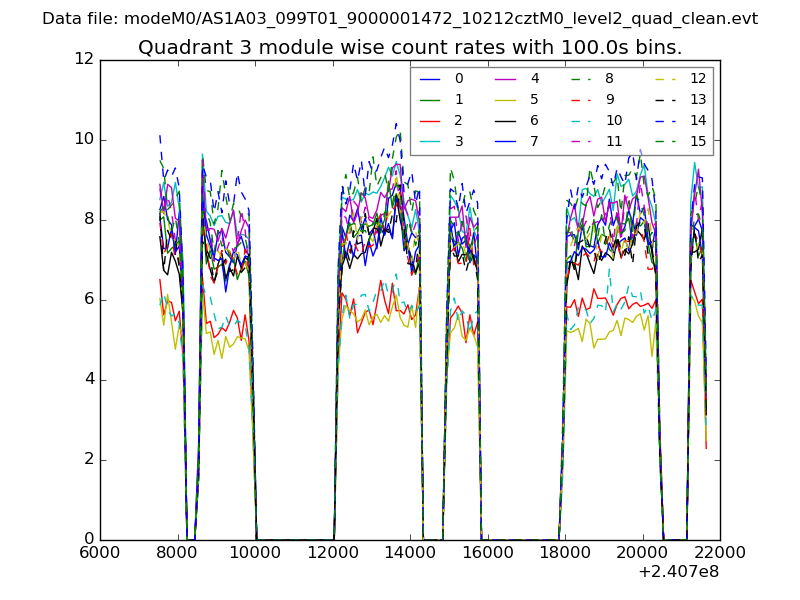
| Module-wise count rates for Quadrant D Data is divided into 100 sec bins |
 |
 |
| Parameter | Plot |
|---|---|
| CZT HV Monitor | 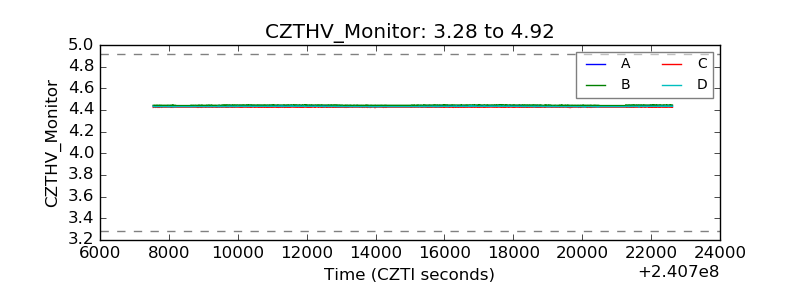 |
| D_VDD | 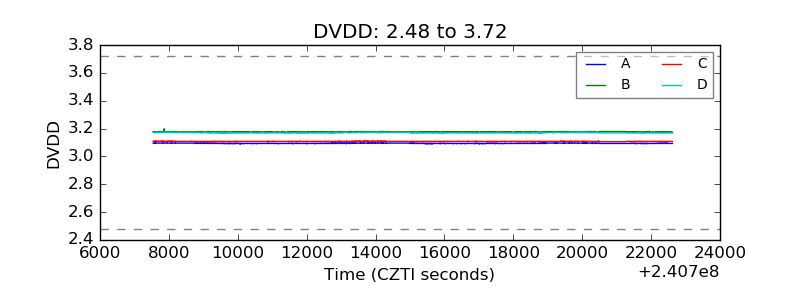 |
| Temperature 1 | 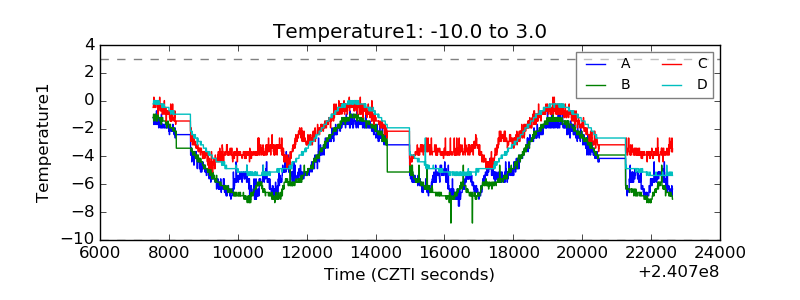 |
| Veto HV Monitor | 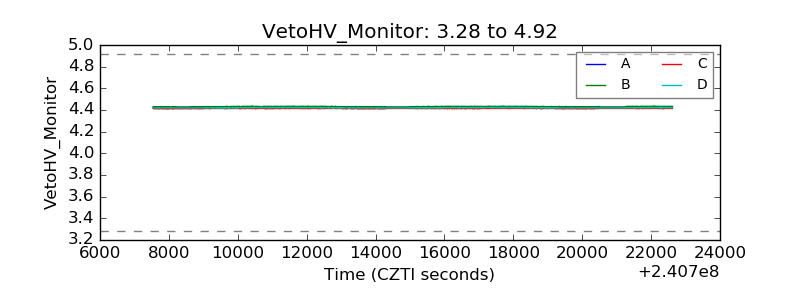 |
| Veto LLD | 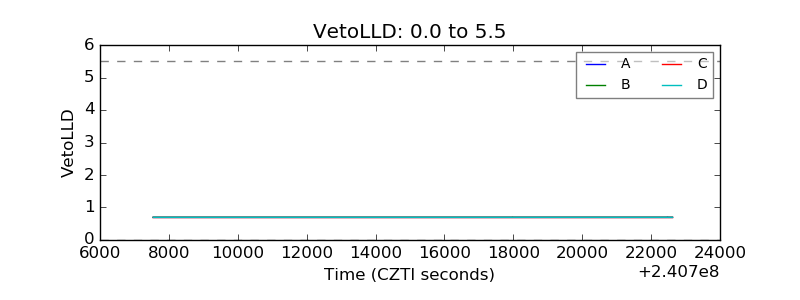 |
| Alpha Counter |  |
| _CPM_Rate |  |
| CZT Counter | 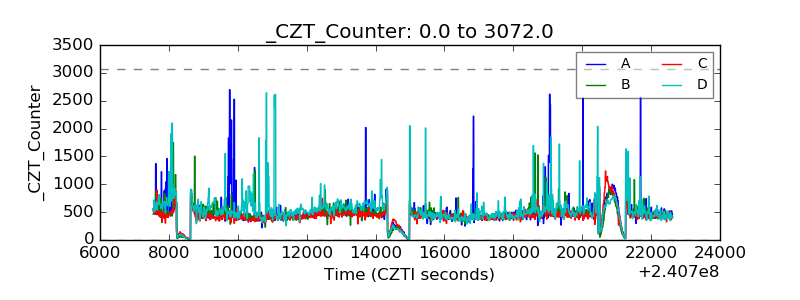 |
| +2.5 Volts monitor |  |
| +5 Volts monitor |  |
| _ROLL_ROT | 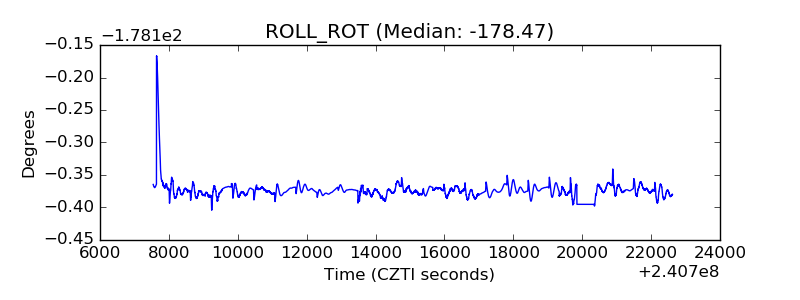 |
| _Roll_DEC | 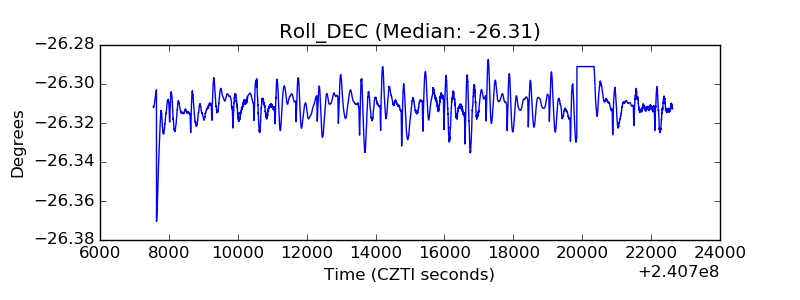 |
| _Roll_RA | 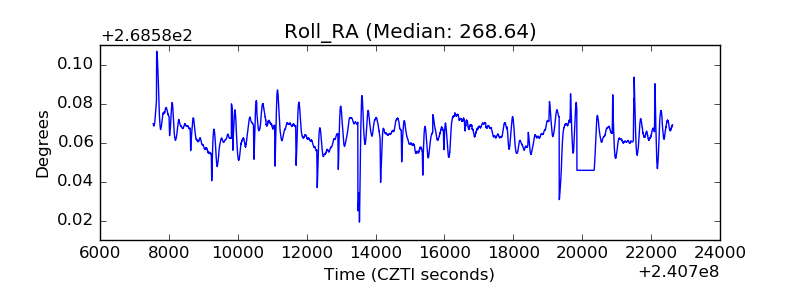 |
| Veto Counter |  |