| Param | Original file | Final file |
|---|---|---|
| Filename | modeM0/AS1A03_099T01_9000001472_10213cztM0_level2.evt | modeM0/AS1A03_099T01_9000001472_10213cztM0_level2_quad_clean.evt |
| Size (bytes) | 496,900,800 | 82,180,800 |
| Size | 473.9 MB | 78.4 MB |
| Events in quadrant A | 3,675,333 | 494,624 |
| Events in quadrant B | 3,677,029 | 500,462 |
| Events in quadrant C | 3,328,126 | 500,227 |
| Events in quadrant D | 3,865,969 | 478,749 |
| Mode M0 | |||
|---|---|---|---|
| Quadrant | BADHDUFLAG | Total packets | Discarded packets |
| A | 0 | 15779 | 3 |
| B | 0 | 15690 | 2 |
| C | 0 | 15086 | 2 |
| D | 0 | 16416 | 2 |
| Mode SS | |||
|---|---|---|---|
| Quadrant | BADHDUFLAG | Total packets | Discarded packets |
| A | 0 | 152 | 0 |
| B | 0 | 152 | 0 |
| C | 0 | 152 | 0 |
| D | 0 | 152 | 0 |
| Mode M9 | |||
|---|---|---|---|
| Quadrant | BADHDUFLAG | Total packets | Discarded packets |
| A | 0 | 17 | 0 |
| B | 0 | 17 | 0 |
| C | 0 | 17 | 0 |
| D | 0 | 17 | 0 |
| Quadrant | Total seconds | Saturated seconds | Saturation percentage |
|---|---|---|---|
| A | 7391 | 135 | 1.826546% |
| B | 7391 | 96 | 1.298877% |
| C | 7391 | 61 | 0.825328% |
| D | 7391 | 113 | 1.528886% |
Noise dominated data is calculated using 1-second bins in cleaned event files. If a bin has >2000 counts, and if more than 50% of those come from <1% of pixels, then it is considered to be noise-dominated and hence unusable.
| Quadrant | # 1 sec bins | Bins with >0 counts | Bins with >2000 counts | High rate bins dominated by noise | Noise dominated (total time) | Noise dominated (detector-on time) | Marked lightcurve |
|---|---|---|---|---|---|---|---|
| A | 9106 | 7392 | 42 | 42 | 0.46% | 0.57% | 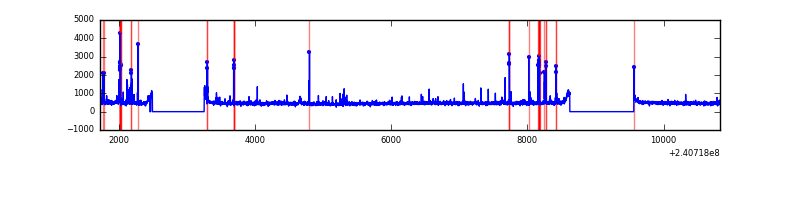 |
| B | 9106 | 7392 | 7 | 7 | 0.08% | 0.09% | 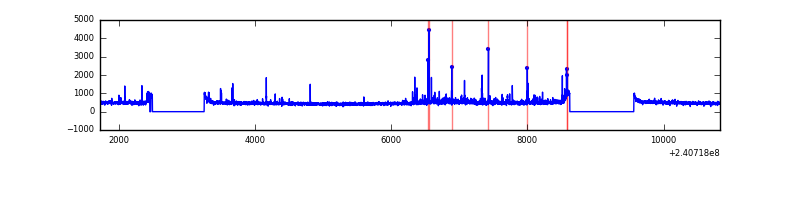 |
| C | 9106 | 7392 | 0 | 0 | 0.00% | 0.00% | 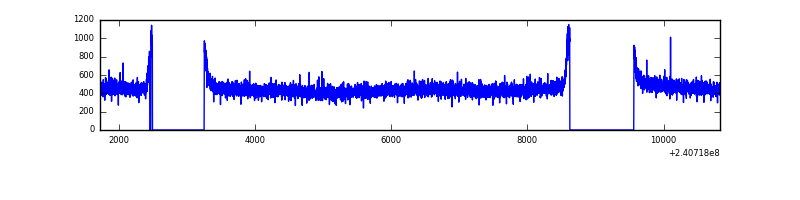 |
| D | 9106 | 7393 | 37 | 37 | 0.41% | 0.50% |  |
Top three noisy pixels from each quadrant. If the there are fewer than three noisy pixels in the level2.evt file, extra rows are filled as -1
| Pixel properties | Quadrant properties | ||||||
|---|---|---|---|---|---|---|---|
| Quadrant | DetID | PixID | Counts | Sigma | Mean | Median | Sigma |
| A | 15 | 223 | 84552 | 478.32 | 870 | 852 | 175.0 |
| A | 8 | 5 | 81088 | 458.53 | 870 | 852 | 175.0 |
| A | 8 | 15 | 53251 | 299.45 | 870 | 852 | 175.0 |
| B | 0 | 214 | 92088 | 534.44 | 882 | 860 | 170.7 |
| B | 4 | 239 | 72093 | 417.3 | 882 | 860 | 170.7 |
| B | 11 | 51 | 42738 | 245.33 | 882 | 860 | 170.7 |
| C | 13 | 61 | 6520 | 28.38 | 853 | 856 | 199.5 |
| C | 4 | 175 | 2734 | 9.41 | 853 | 856 | 199.5 |
| C | 3 | 202 | 2118 | 6.32 | 853 | 856 | 199.5 |
| D | 8 | 195 | 280878 | 1383.53 | 842 | 818 | 202.4 |
| D | 1 | 52 | 146344 | 718.92 | 842 | 818 | 202.4 |
| D | 12 | 233 | 88818 | 434.73 | 842 | 818 | 202.4 |
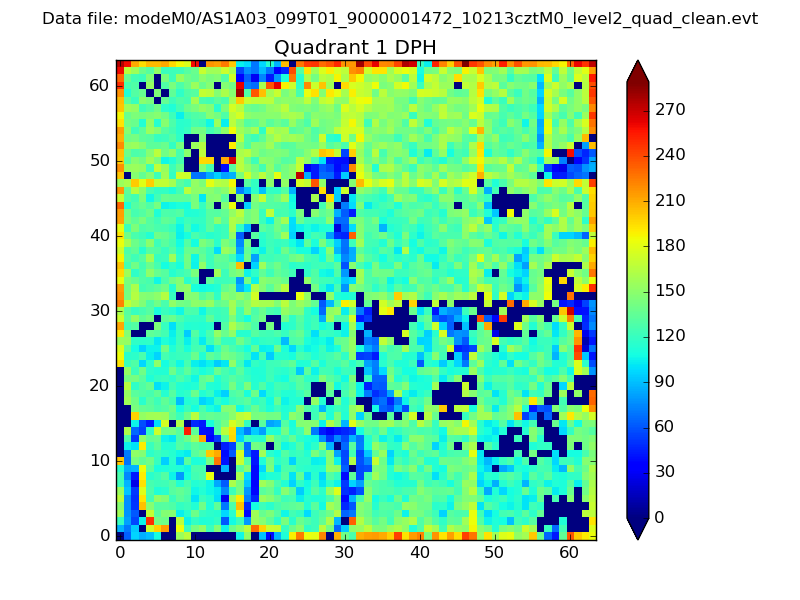
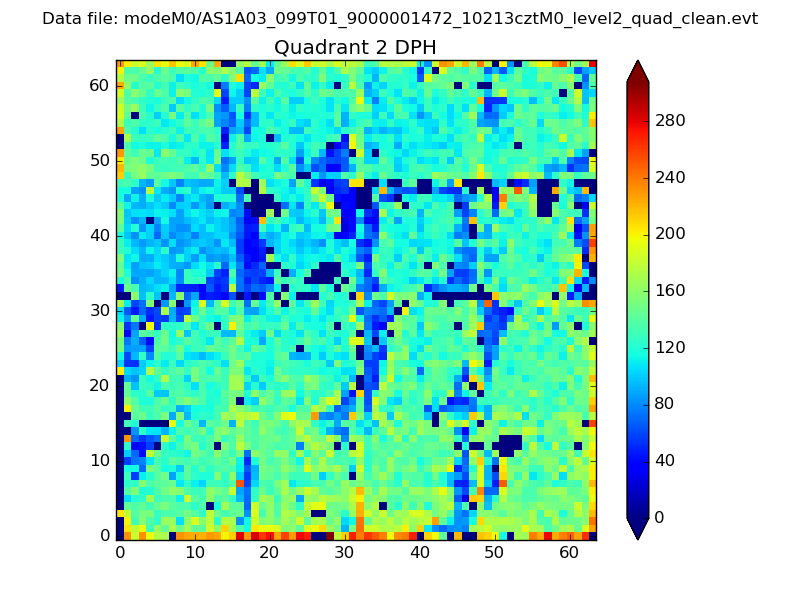
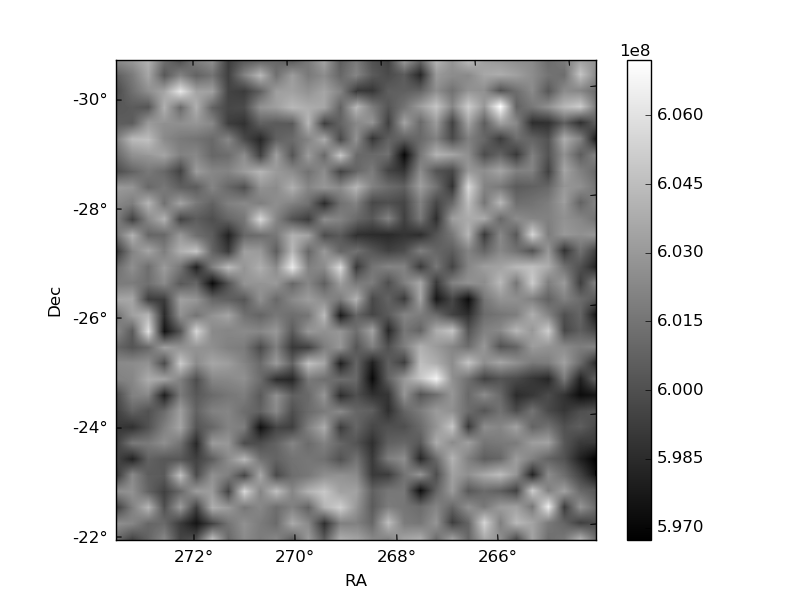
Histogram calculated using DETX and DETY for each event in the final _common_clean file
| Quadrant A | 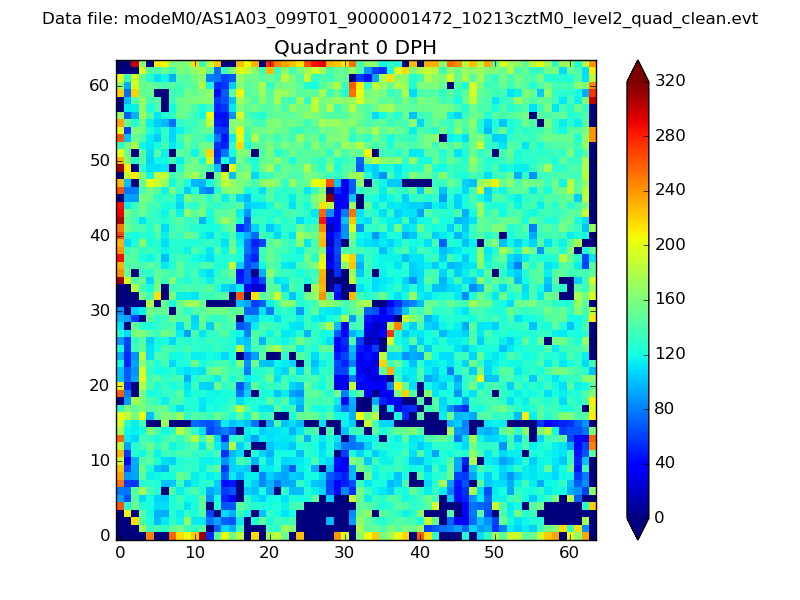 |
 |
Quadrant B |
|---|---|---|---|
| Quadrant D | 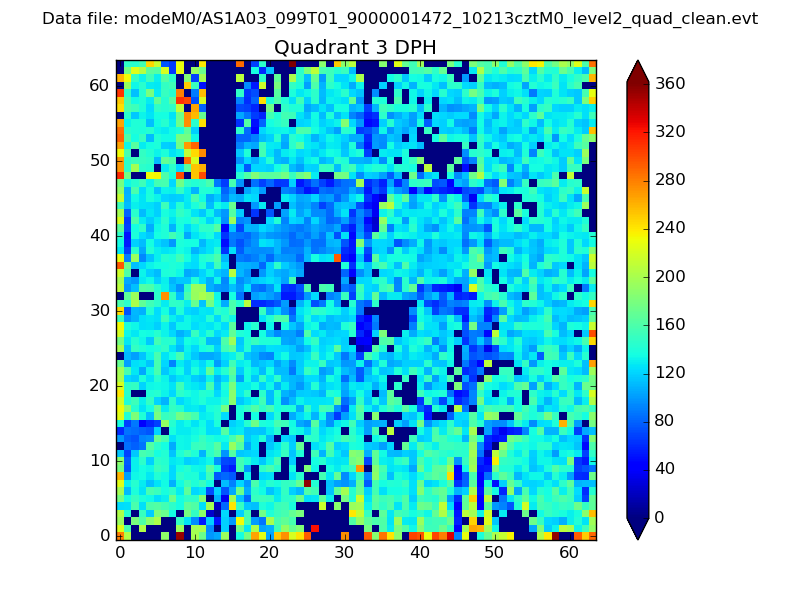 |
 |
Quadrant C |
| Plot type | Count rate plots | Images |
|---|---|---|
| Comparison with Poisson distribution Blue bars denote a histogram of data divided into 1 sec bins. Red curve is a Poisson curve with rate = median count rate of data. |
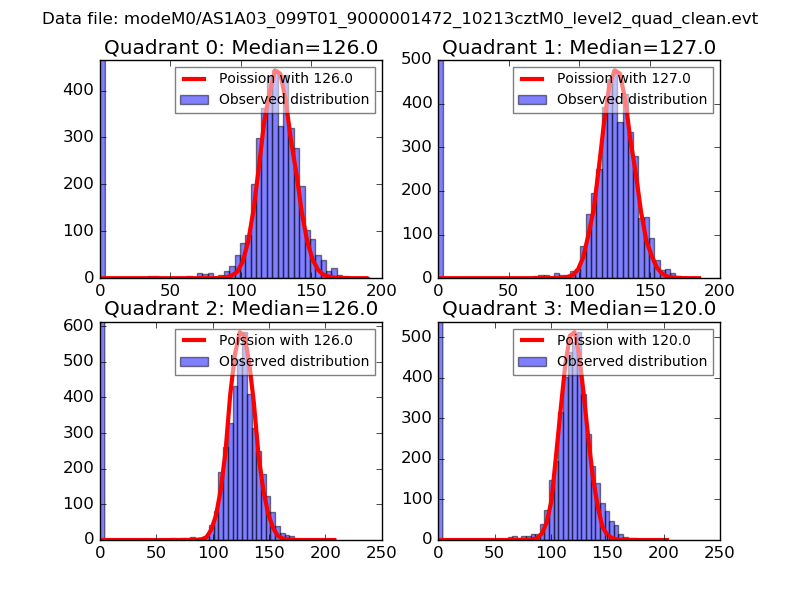 |
 |
| Quadrant-wise count rates Data is divided into 100 sec bins |
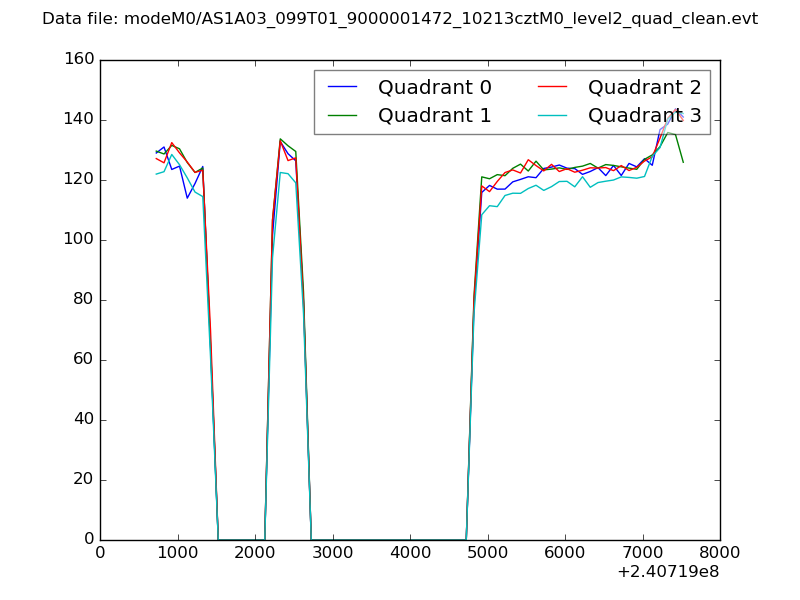 |
|
| Module-wise count rates for Quadrant A Data is divided into 100 sec bins |
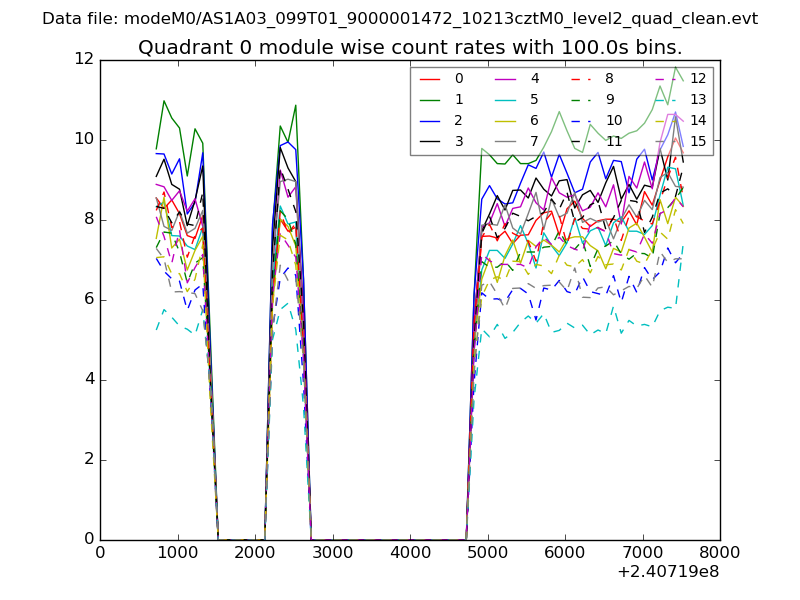 |
 |
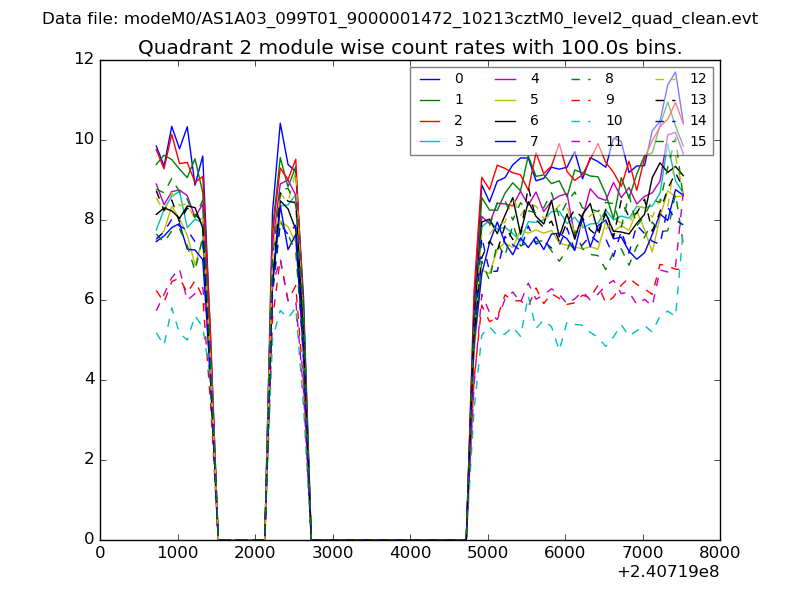
| Module-wise count rates for Quadrant B Data is divided into 100 sec bins |
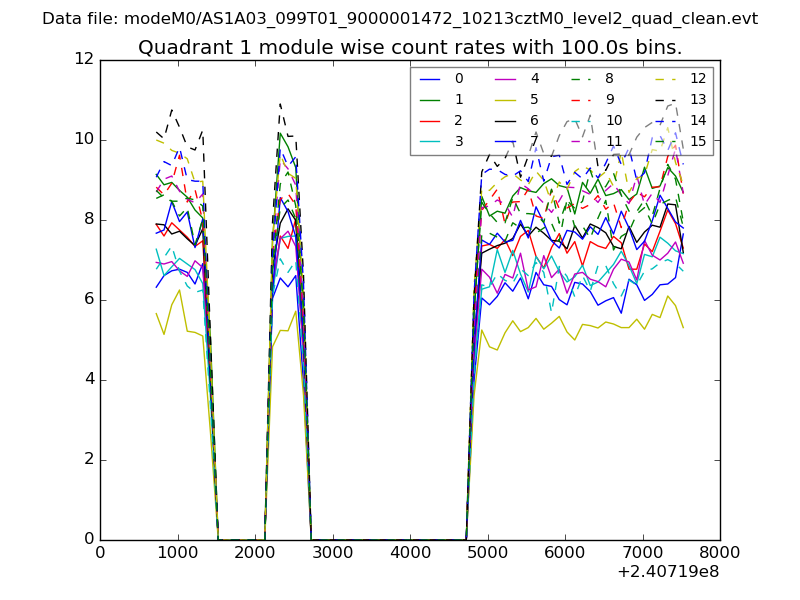 |
 |
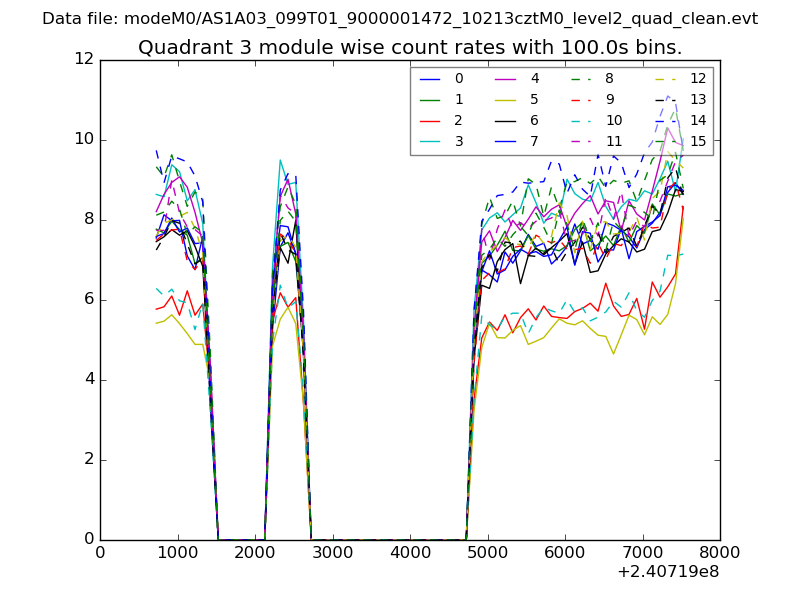
| Module-wise count rates for Quadrant C Data is divided into 100 sec bins |
 |
 |
| Module-wise count rates for Quadrant D Data is divided into 100 sec bins |
 |
 |
| Parameter | Plot |
|---|---|
| CZT HV Monitor | 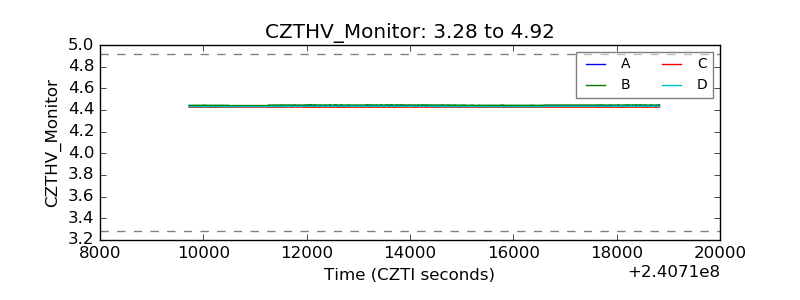 |
| D_VDD | 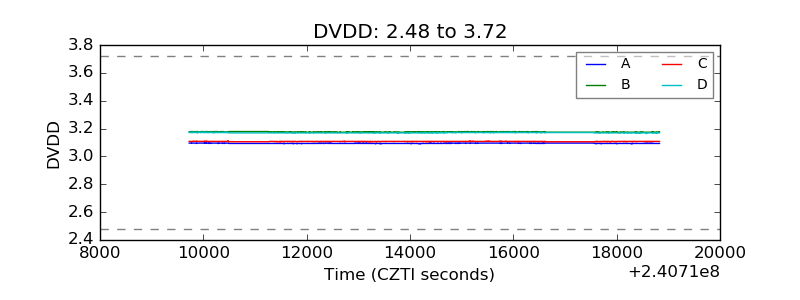 |
| Temperature 1 | 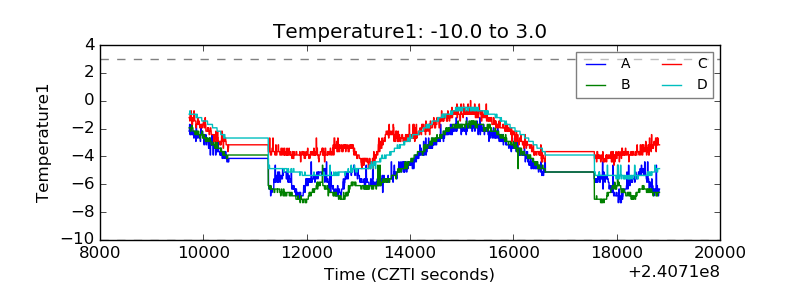 |
| Veto HV Monitor | 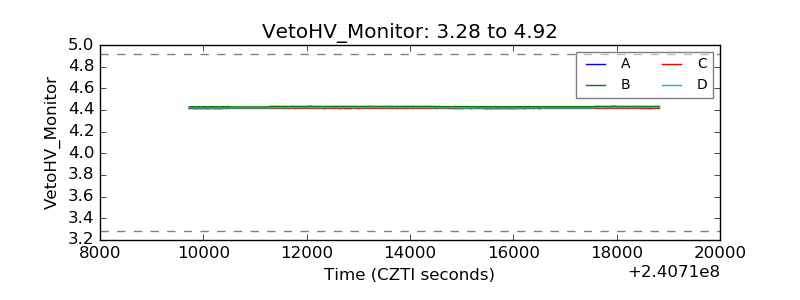 |
| Veto LLD | 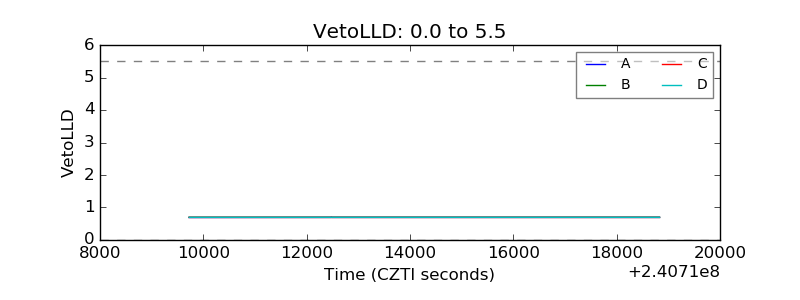 |
| Alpha Counter | 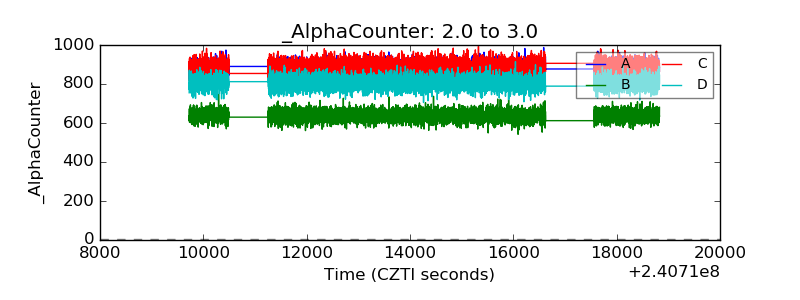 |
| _CPM_Rate | 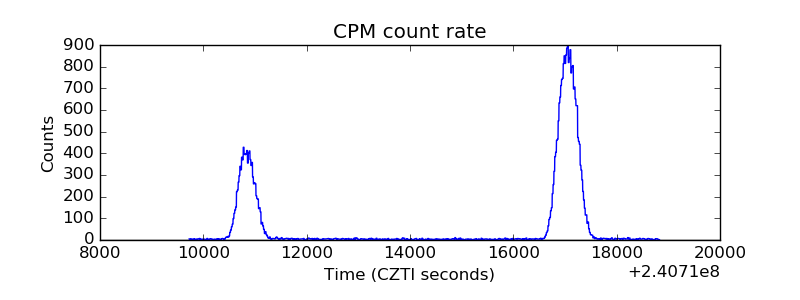 |
| CZT Counter | 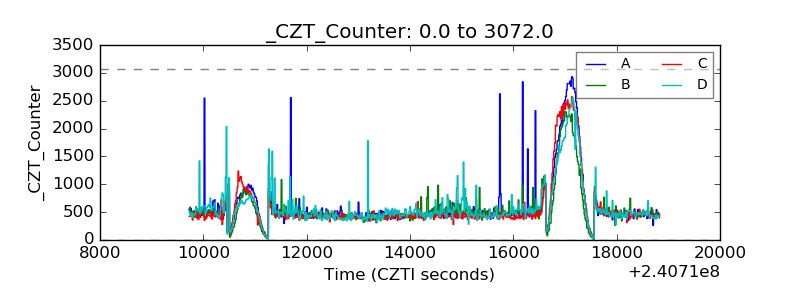 |
| +2.5 Volts monitor |  |
| +5 Volts monitor |  |
| _ROLL_ROT | 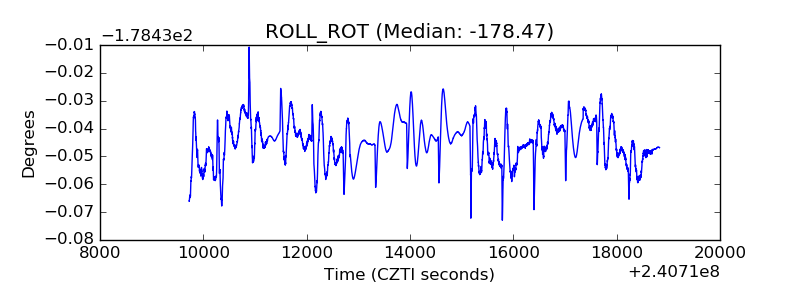 |
| _Roll_DEC | 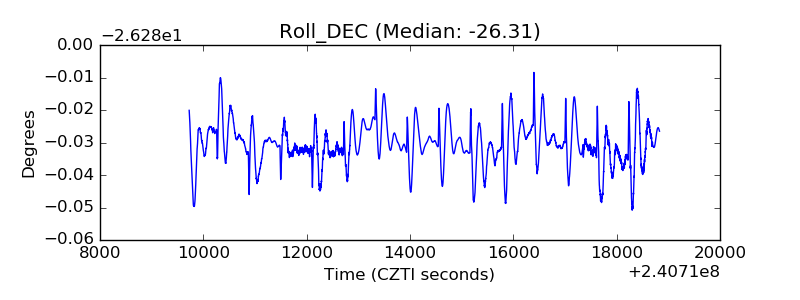 |
| _Roll_RA | 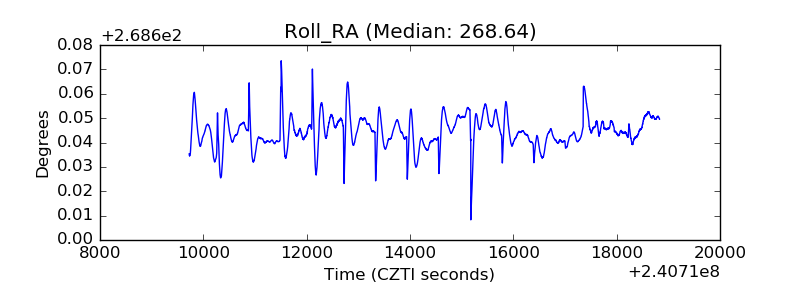 |
| Veto Counter | 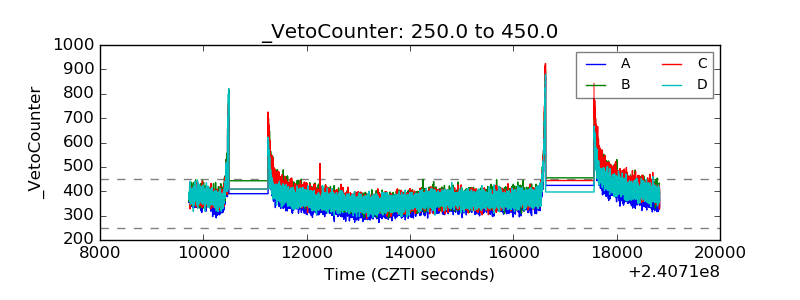 |