| Param | Original file | Final file |
|---|---|---|
| Filename | modeM0/AS1A03_099T01_9000001472_10214cztM0_level2.evt | modeM0/AS1A03_099T01_9000001472_10214cztM0_level2_quad_clean.evt |
| Size (bytes) | 455,034,240 | 65,805,120 |
| Size | 434.0 MB | 62.8 MB |
| Events in quadrant A | 3,305,695 | 390,942 |
| Events in quadrant B | 3,502,269 | 386,179 |
| Events in quadrant C | 2,993,056 | 389,515 |
| Events in quadrant D | 3,539,411 | 373,631 |
| Mode M0 | |||
|---|---|---|---|
| Quadrant | BADHDUFLAG | Total packets | Discarded packets |
| A | 0 | 14130 | 3 |
| B | 0 | 14483 | 4 |
| C | 0 | 13279 | 2 |
| D | 0 | 14479 | 2 |
| Mode SS | |||
|---|---|---|---|
| Quadrant | BADHDUFLAG | Total packets | Discarded packets |
| A | 0 | 132 | 0 |
| B | 0 | 132 | 0 |
| C | 0 | 132 | 0 |
| D | 0 | 132 | 0 |
| Mode M9 | |||
|---|---|---|---|
| Quadrant | BADHDUFLAG | Total packets | Discarded packets |
| A | 0 | 18 | 0 |
| B | 0 | 18 | 0 |
| C | 0 | 18 | 0 |
| D | 0 | 19 | 0 |
| Quadrant | Total seconds | Saturated seconds | Saturation percentage |
|---|---|---|---|
| A | 6479 | 70 | 1.080414% |
| B | 6478 | 91 | 1.404755% |
| C | 6479 | 38 | 0.586510% |
| D | 6479 | 70 | 1.080414% |
Noise dominated data is calculated using 1-second bins in cleaned event files. If a bin has >2000 counts, and if more than 50% of those come from <1% of pixels, then it is considered to be noise-dominated and hence unusable.
| Quadrant | # 1 sec bins | Bins with >0 counts | Bins with >2000 counts | High rate bins dominated by noise | Noise dominated (total time) | Noise dominated (detector-on time) | Marked lightcurve |
|---|---|---|---|---|---|---|---|
| A | 7564 | 6479 | 19 | 19 | 0.25% | 0.29% | 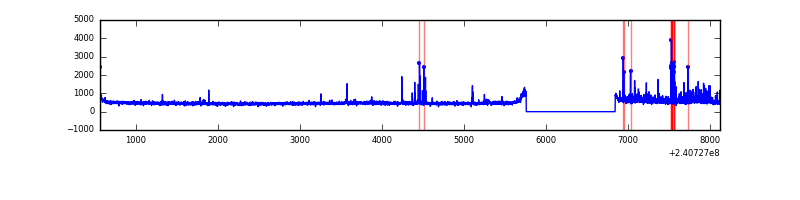 |
| B | 7564 | 6479 | 35 | 35 | 0.46% | 0.54% | 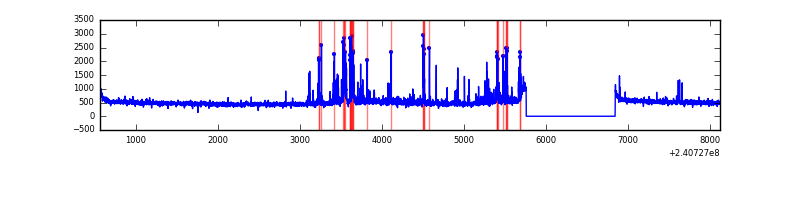 |
| C | 7564 | 6479 | 0 | 0 | 0.00% | 0.00% | 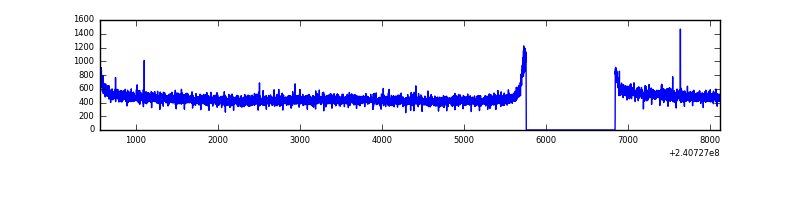 |
| D | 7564 | 6479 | 24 | 24 | 0.32% | 0.37% | 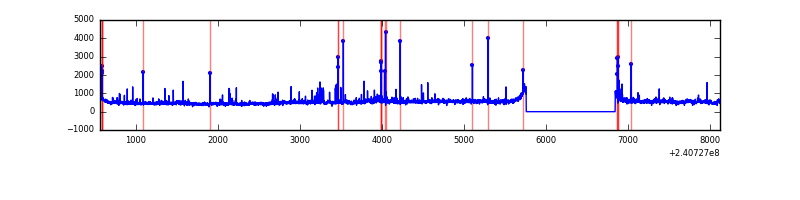 |
Top three noisy pixels from each quadrant. If the there are fewer than three noisy pixels in the level2.evt file, extra rows are filled as -1
| Pixel properties | Quadrant properties | ||||||
|---|---|---|---|---|---|---|---|
| Quadrant | DetID | PixID | Counts | Sigma | Mean | Median | Sigma |
| A | 8 | 15 | 118798 | 742.86 | 787 | 771 | 158.9 |
| A | 15 | 223 | 78105 | 486.74 | 787 | 771 | 158.9 |
| A | 15 | 239 | 31456 | 193.13 | 787 | 771 | 158.9 |
| B | 4 | 239 | 232867 | 1544.97 | 790 | 772 | 150.2 |
| B | 0 | 214 | 126096 | 834.24 | 790 | 772 | 150.2 |
| B | 11 | 51 | 61191 | 402.19 | 790 | 772 | 150.2 |
| C | 13 | 61 | 5706 | 27.91 | 766 | 770 | 176.8 |
| C | 14 | 234 | 2853 | 11.78 | 766 | 770 | 176.8 |
| C | 0 | 207 | 2472 | 9.62 | 766 | 770 | 176.8 |
| D | 8 | 195 | 386039 | 1926.58 | 753 | 738 | 200.0 |
| D | 1 | 52 | 86170 | 427.18 | 753 | 738 | 200.0 |
| D | 2 | 16 | 44530 | 218.97 | 753 | 738 | 200.0 |
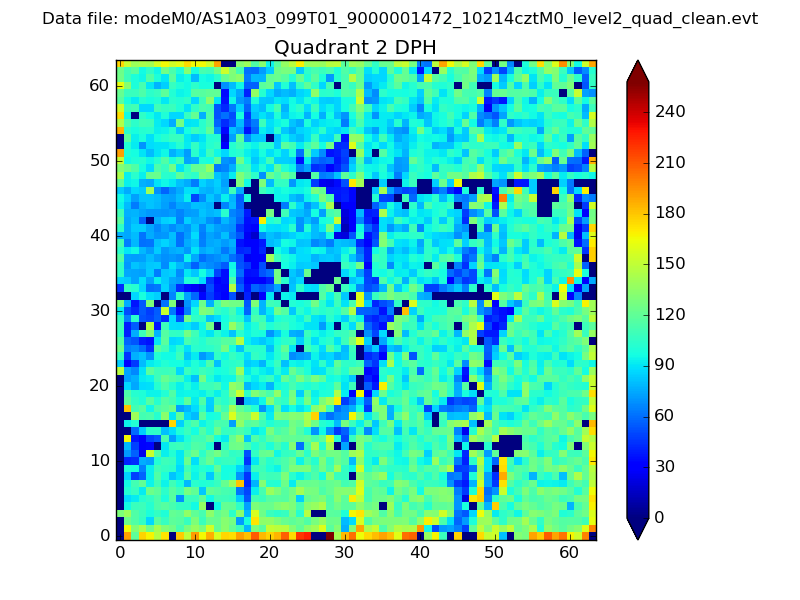
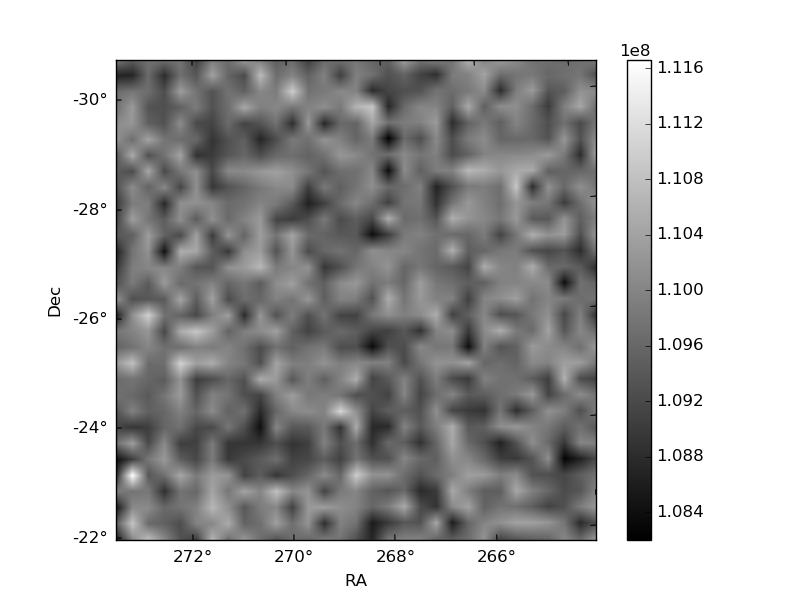
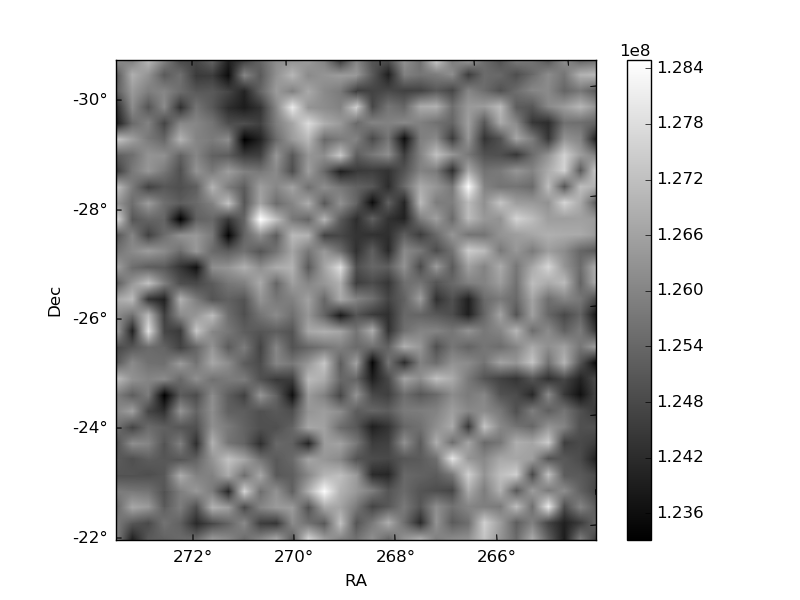
Histogram calculated using DETX and DETY for each event in the final _common_clean file
| Quadrant A | 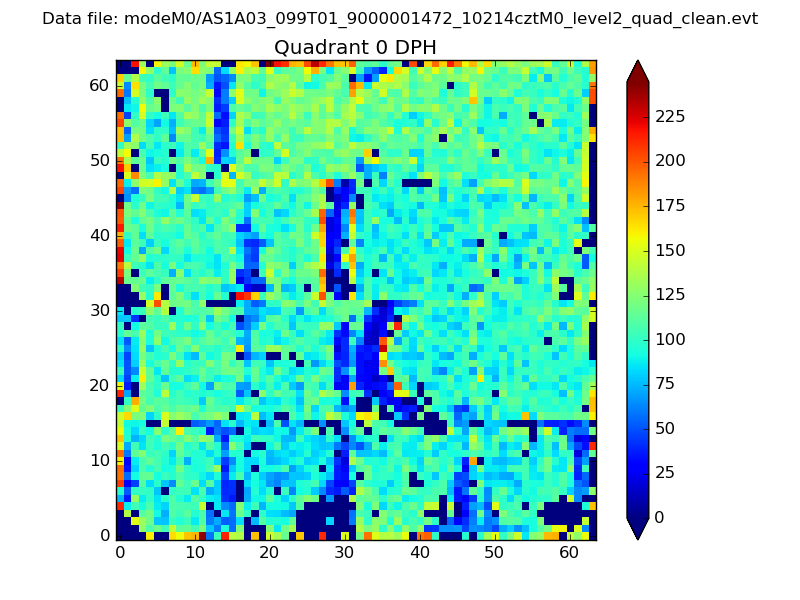 |
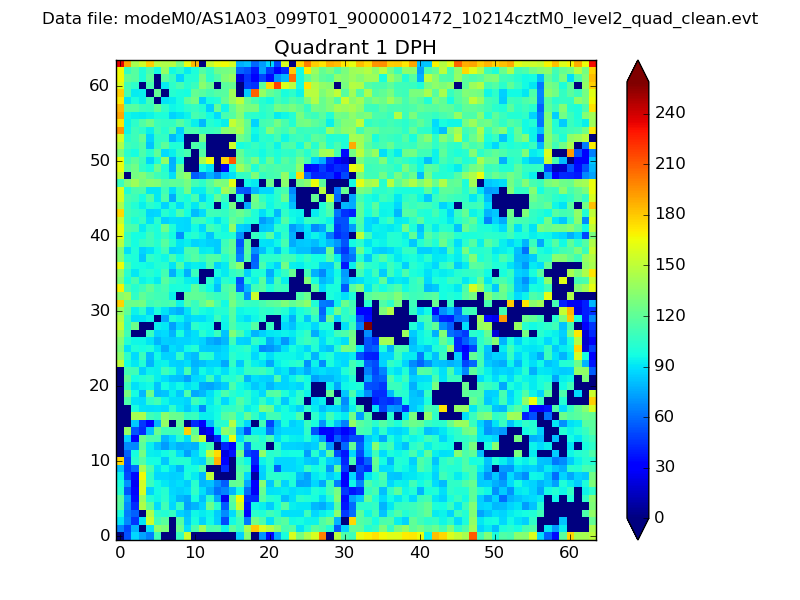 |
Quadrant B |
|---|---|---|---|
| Quadrant D | 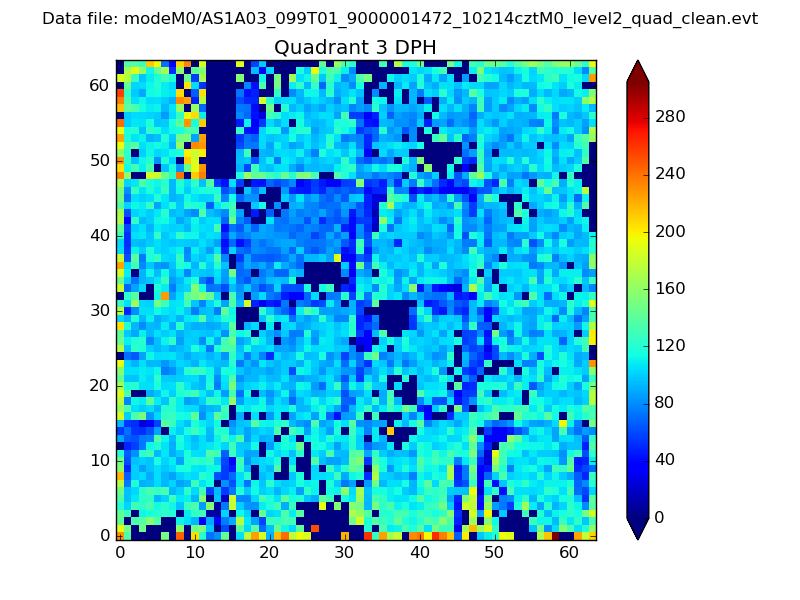 |
 |
Quadrant C |
| Plot type | Count rate plots | Images |
|---|---|---|
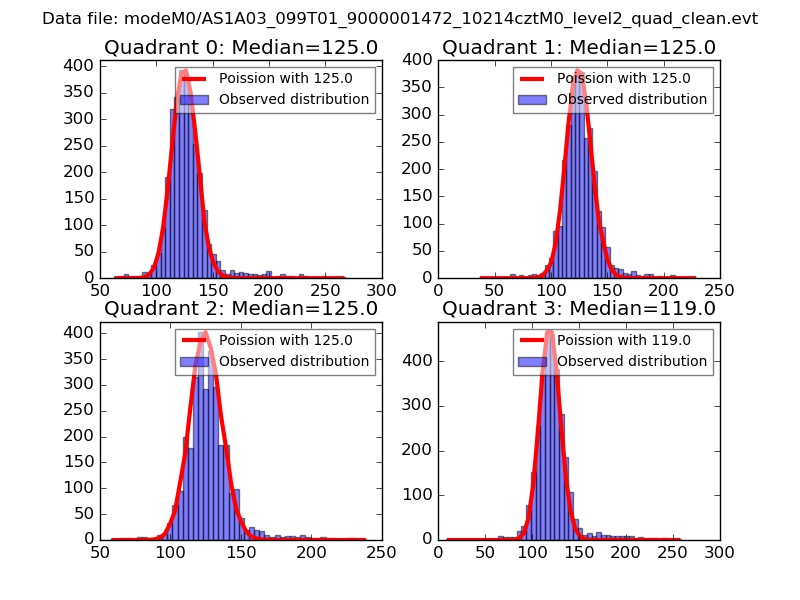
| Comparison with Poisson distribution Blue bars denote a histogram of data divided into 1 sec bins. Red curve is a Poisson curve with rate = median count rate of data. |
 |
 |
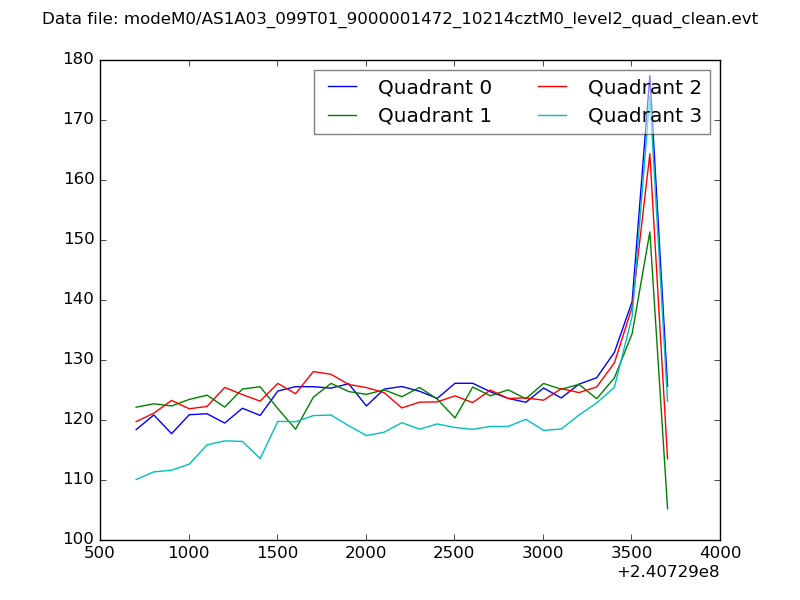
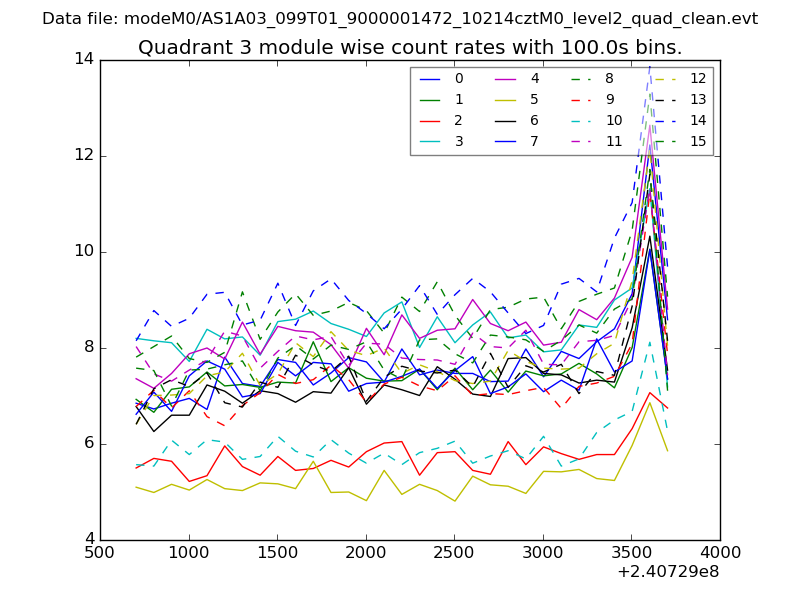
| Quadrant-wise count rates Data is divided into 100 sec bins |
 |
|
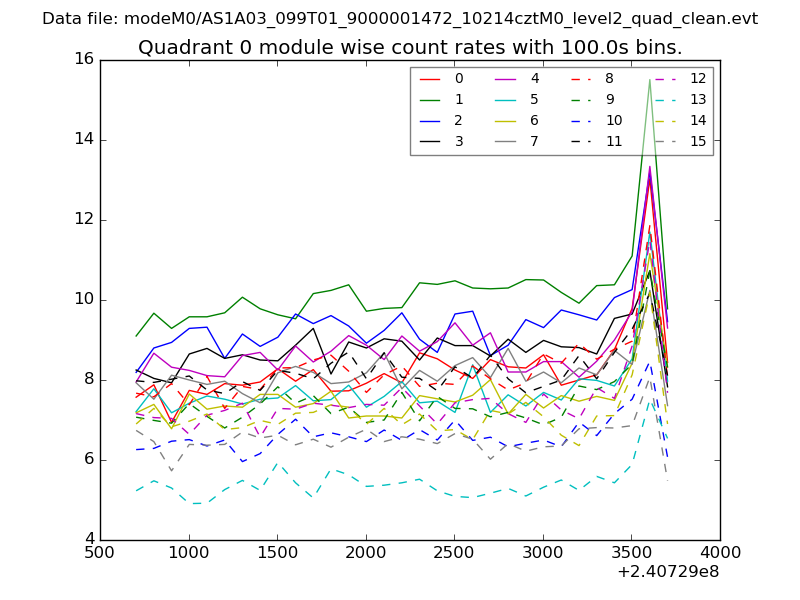
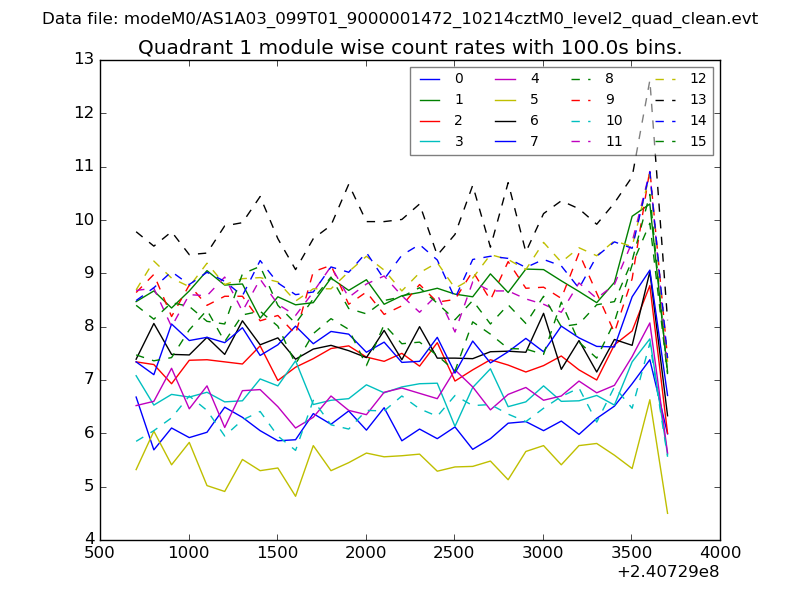
| Module-wise count rates for Quadrant A Data is divided into 100 sec bins |
 |
 |
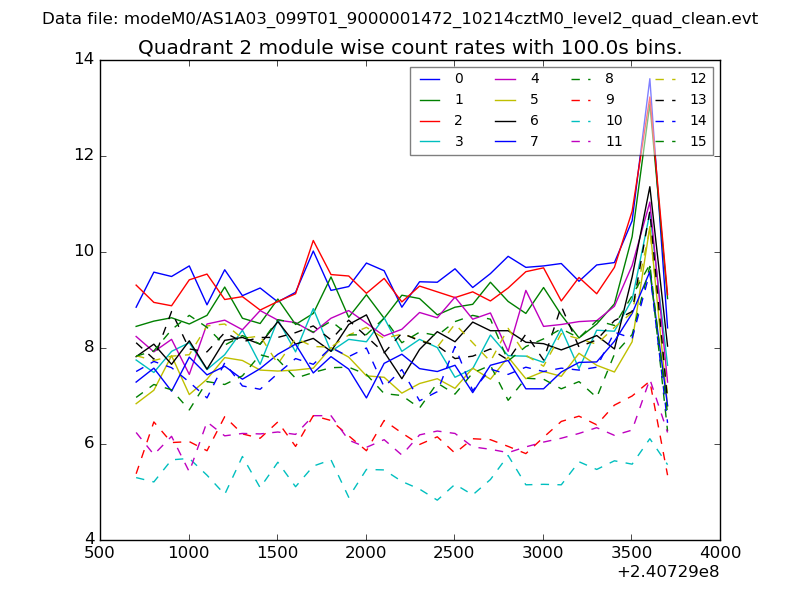
| Module-wise count rates for Quadrant B Data is divided into 100 sec bins |
 |
 |
| Module-wise count rates for Quadrant C Data is divided into 100 sec bins |
 |
 |
| Module-wise count rates for Quadrant D Data is divided into 100 sec bins |
 |
 |
| Parameter | Plot |
|---|---|
| CZT HV Monitor | 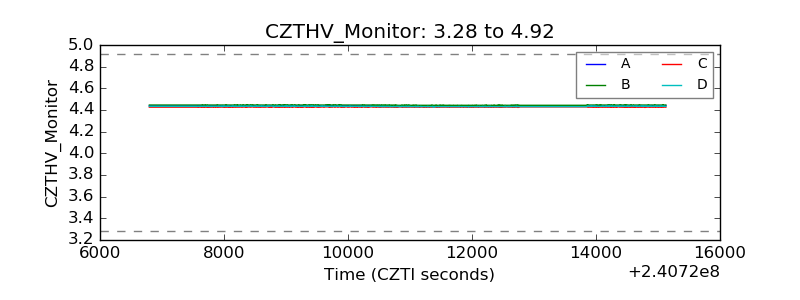 |
| D_VDD | 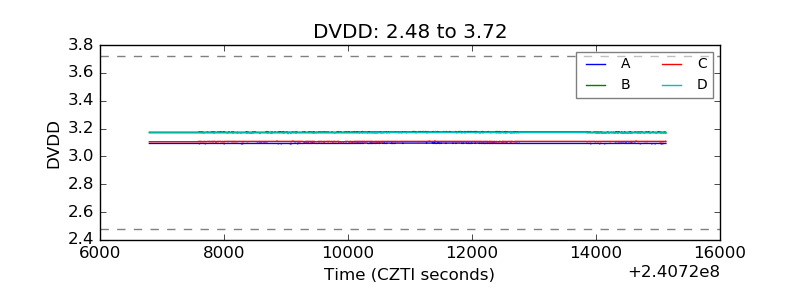 |
| Temperature 1 | 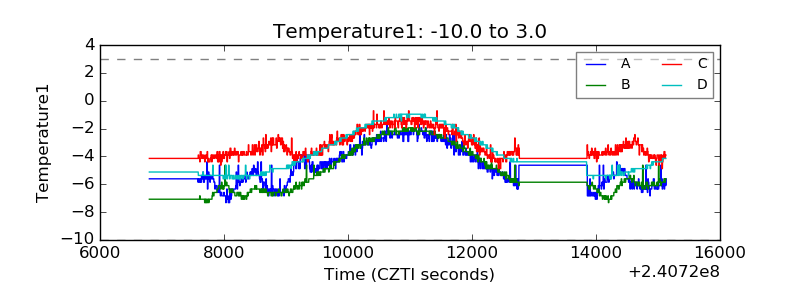 |
| Veto HV Monitor | 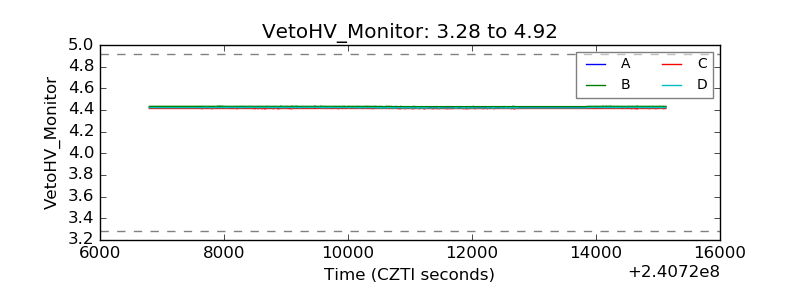 |
| Veto LLD | 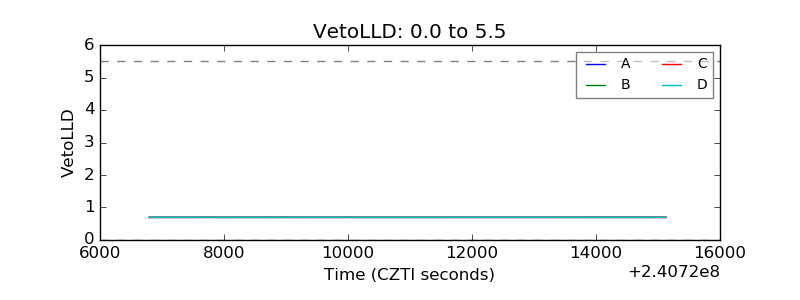 |
| Alpha Counter | 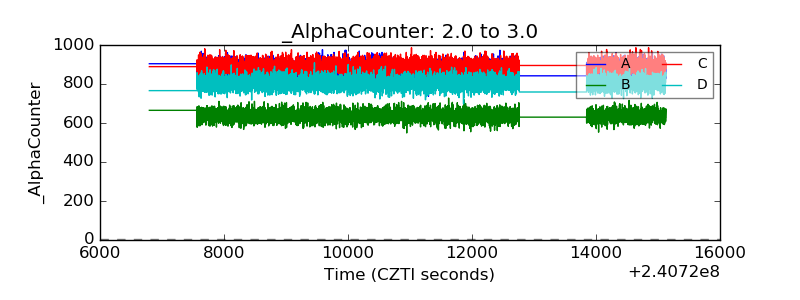 |
| _CPM_Rate | 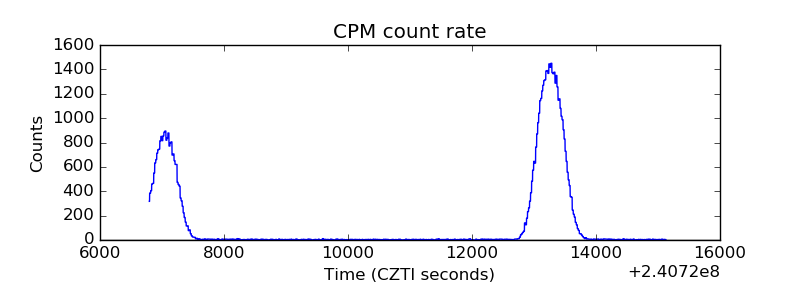 |
| CZT Counter | 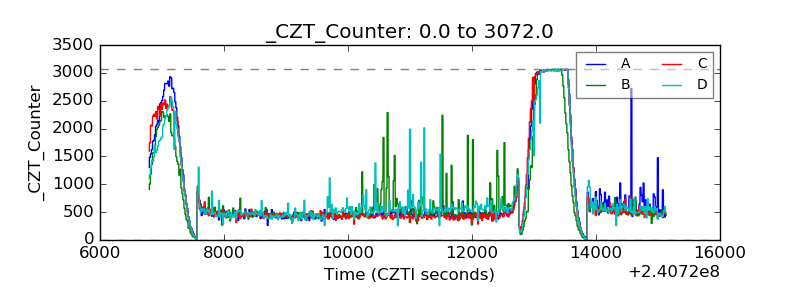 |
| +2.5 Volts monitor |  |
| +5 Volts monitor | 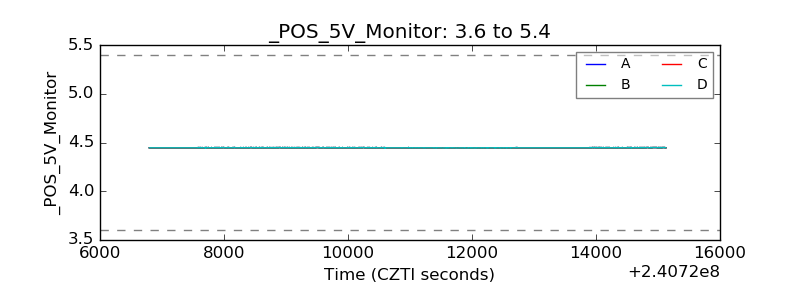 |
| _ROLL_ROT |  |
| _Roll_DEC | 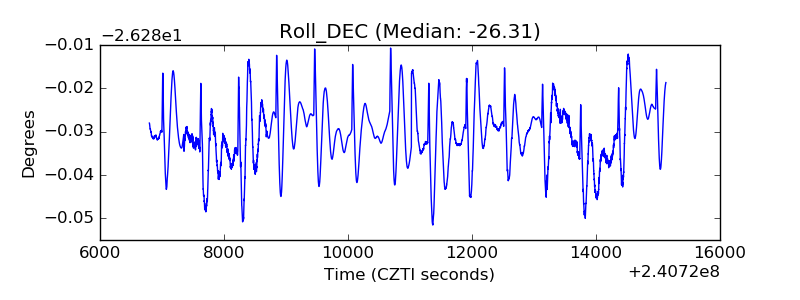 |
| _Roll_RA | 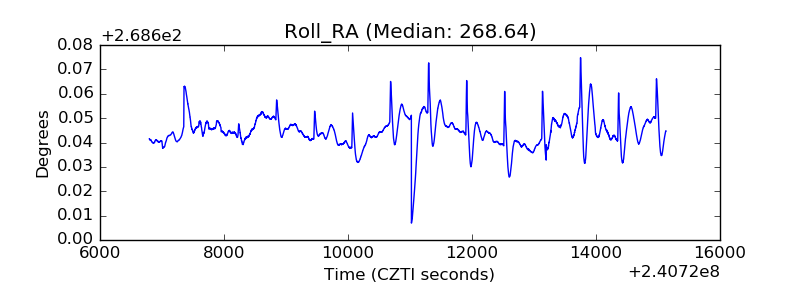 |
| Veto Counter | 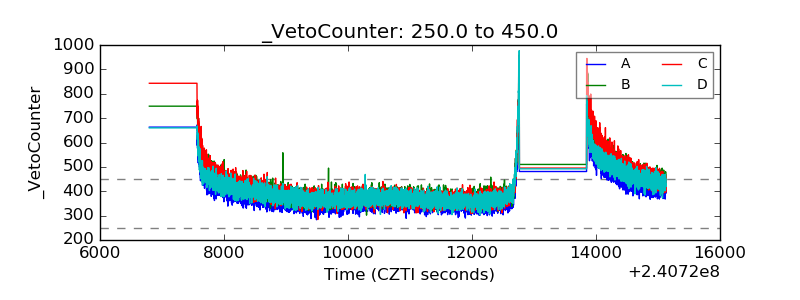 |