| Param | Original file | Final file |
|---|---|---|
| Filename | modeM0/AS1A03_099T01_9000001472_10216cztM0_level2.evt | modeM0/AS1A03_099T01_9000001472_10216cztM0_level2_quad_clean.evt |
| Size (bytes) | 483,477,120 | 70,830,720 |
| Size | 461.1 MB | 67.5 MB |
| Events in quadrant A | 4,209,505 | 423,104 |
| Events in quadrant B | 3,312,295 | 435,229 |
| Events in quadrant C | 3,064,467 | 432,376 |
| Events in quadrant D | 3,625,796 | 411,733 |
| Mode M0 | |||
|---|---|---|---|
| Quadrant | BADHDUFLAG | Total packets | Discarded packets |
| A | 0 | 16746 | 7 |
| B | 0 | 13745 | 10 |
| C | 0 | 13208 | 13 |
| D | 0 | 14564 | 10 |
| Mode SS | |||
|---|---|---|---|
| Quadrant | BADHDUFLAG | Total packets | Discarded packets |
| A | 0 | 128 | 0 |
| B | 0 | 128 | 0 |
| C | 0 | 128 | 0 |
| D | 0 | 128 | 0 |
| Mode M9 | |||
|---|---|---|---|
| Quadrant | BADHDUFLAG | Total packets | Discarded packets |
| A | 0 | 17 | 0 |
| B | 0 | 17 | 0 |
| C | 0 | 17 | 0 |
| D | 0 | 18 | 0 |
| Quadrant | Total seconds | Saturated seconds | Saturation percentage |
|---|---|---|---|
| A | 6341 | 239 | 3.769122% |
| B | 6339 | 58 | 0.914971% |
| C | 6338 | 27 | 0.426002% |
| D | 6340 | 88 | 1.388013% |
Noise dominated data is calculated using 1-second bins in cleaned event files. If a bin has >2000 counts, and if more than 50% of those come from <1% of pixels, then it is considered to be noise-dominated and hence unusable.
| Quadrant | # 1 sec bins | Bins with >0 counts | Bins with >2000 counts | High rate bins dominated by noise | Noise dominated (total time) | Noise dominated (detector-on time) | Marked lightcurve |
|---|---|---|---|---|---|---|---|
| A | 7553 | 6343 | 156 | 156 | 2.07% | 2.46% | 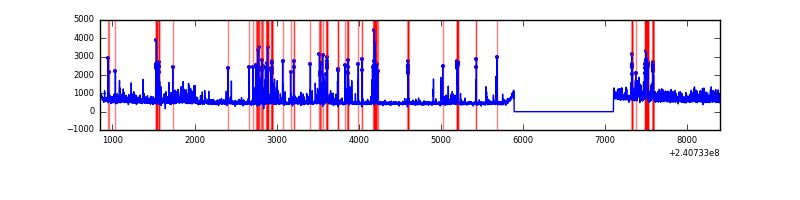 |
| B | 7553 | 6344 | 10 | 10 | 0.13% | 0.16% | 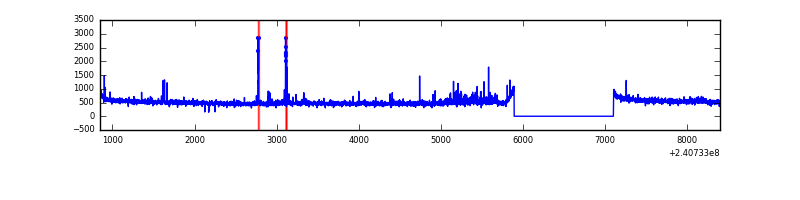 |
| C | 7553 | 6344 | 0 | 0 | 0.00% | 0.00% | 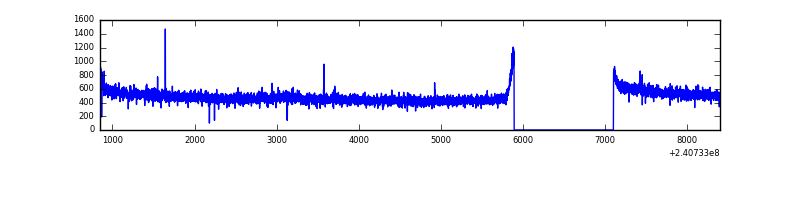 |
| D | 7553 | 6343 | 49 | 49 | 0.65% | 0.77% | 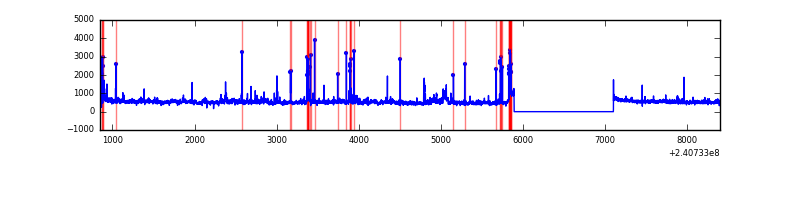 |
Top three noisy pixels from each quadrant. If the there are fewer than three noisy pixels in the level2.evt file, extra rows are filled as -1
| Pixel properties | Quadrant properties | ||||||
|---|---|---|---|---|---|---|---|
| Quadrant | DetID | PixID | Counts | Sigma | Mean | Median | Sigma |
| A | 15 | 223 | 438037 | 2726.82 | 793 | 779 | 160.4 |
| A | 8 | 15 | 411727 | 2562.75 | 793 | 779 | 160.4 |
| A | 15 | 239 | 184428 | 1145.27 | 793 | 779 | 160.4 |
| B | 4 | 239 | 91543 | 601.09 | 806 | 790 | 151.0 |
| B | 11 | 51 | 55814 | 364.44 | 806 | 790 | 151.0 |
| B | 0 | 214 | 18712 | 118.7 | 806 | 790 | 151.0 |
| C | 4 | 175 | 12916 | 67.66 | 780 | 786 | 179.3 |
| C | 13 | 61 | 5948 | 28.79 | 780 | 786 | 179.3 |
| C | 14 | 67 | 4159 | 18.81 | 780 | 786 | 179.3 |
| D | 8 | 195 | 264393 | 1345.83 | 772 | 757 | 195.9 |
| D | 2 | 16 | 79797 | 403.49 | 772 | 757 | 195.9 |
| D | 2 | 14 | 78361 | 396.16 | 772 | 757 | 195.9 |
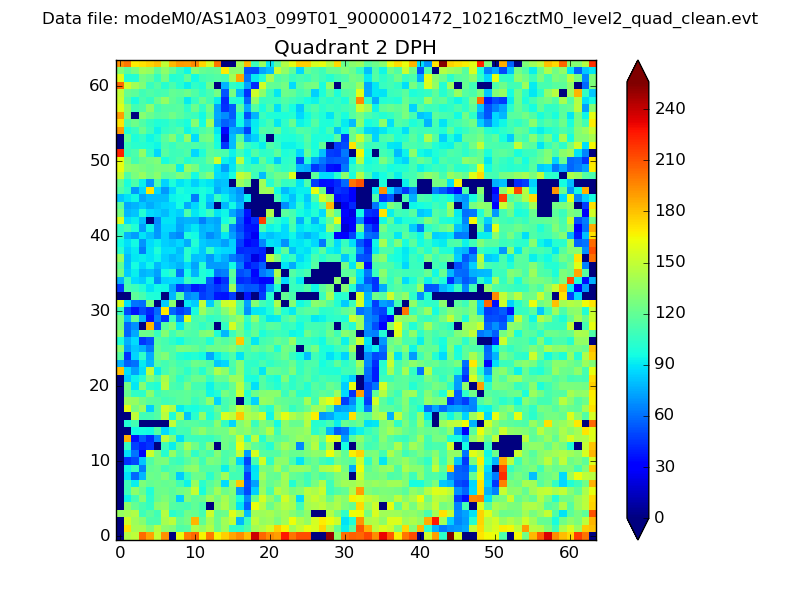
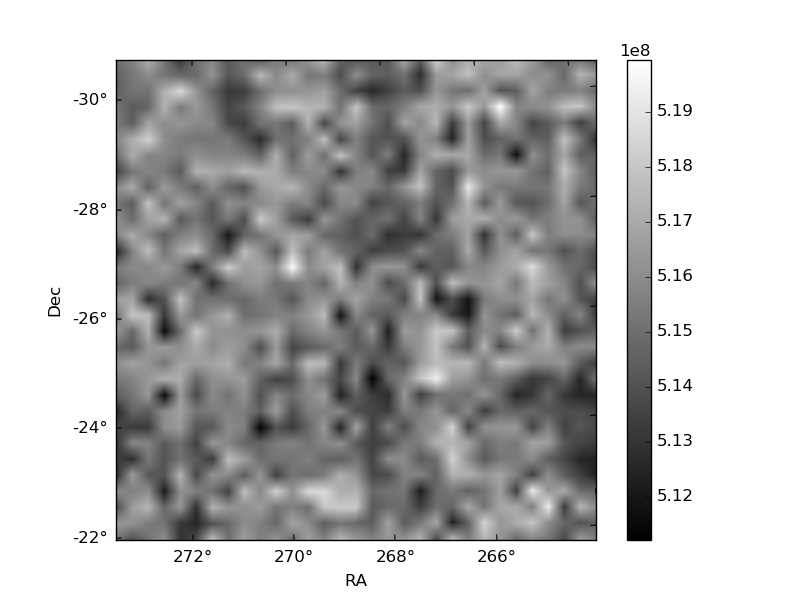
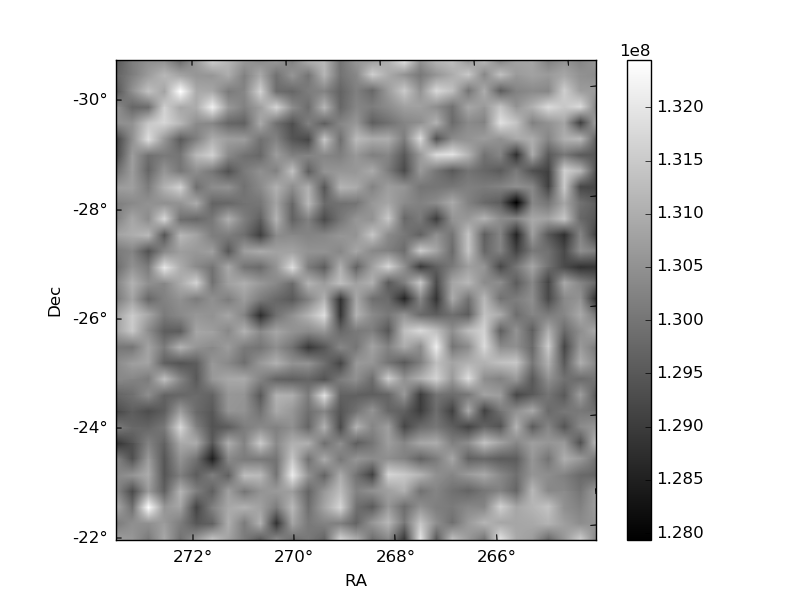
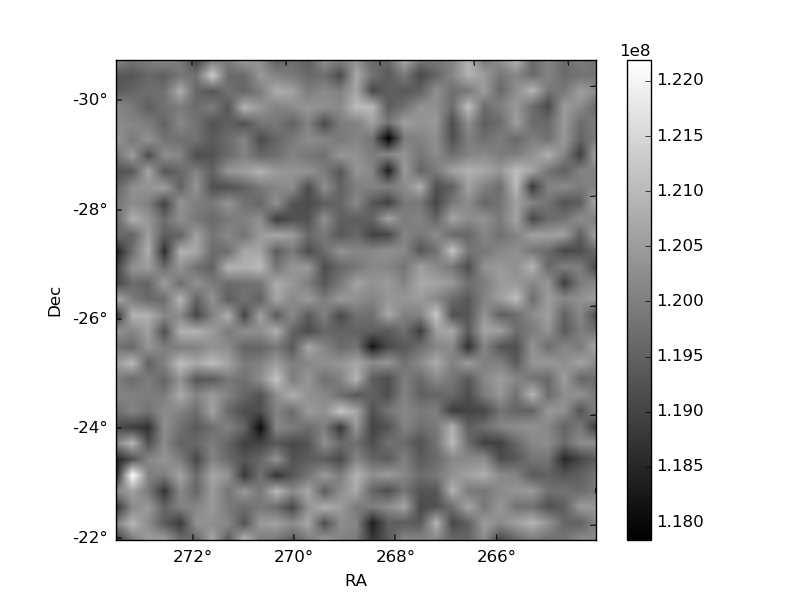
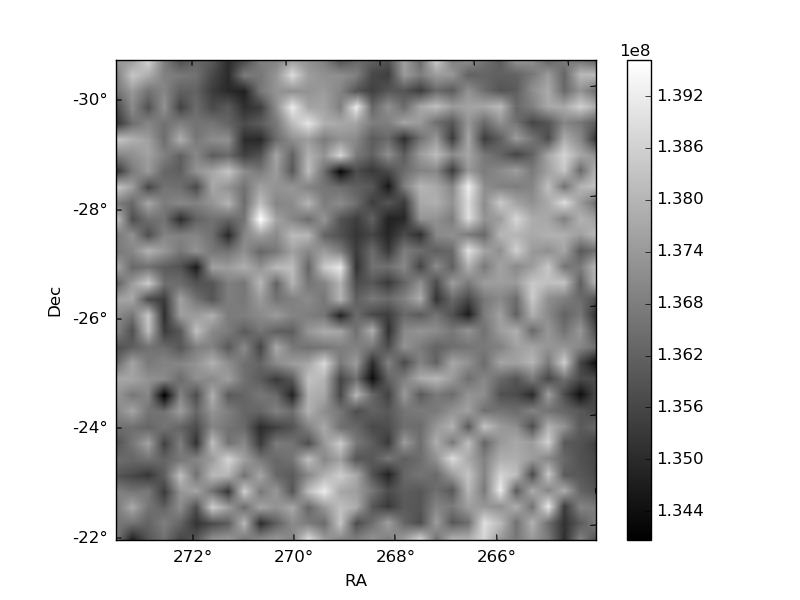
Histogram calculated using DETX and DETY for each event in the final _common_clean file
| Quadrant A | 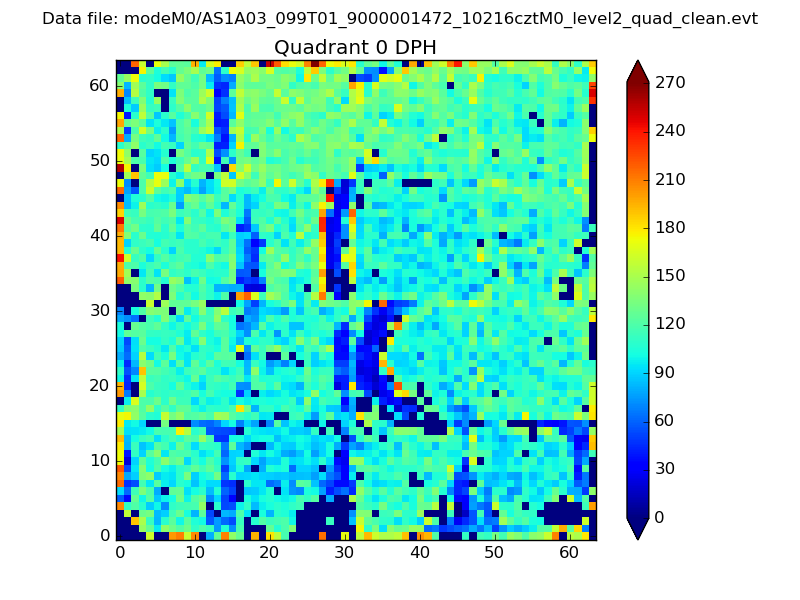 |
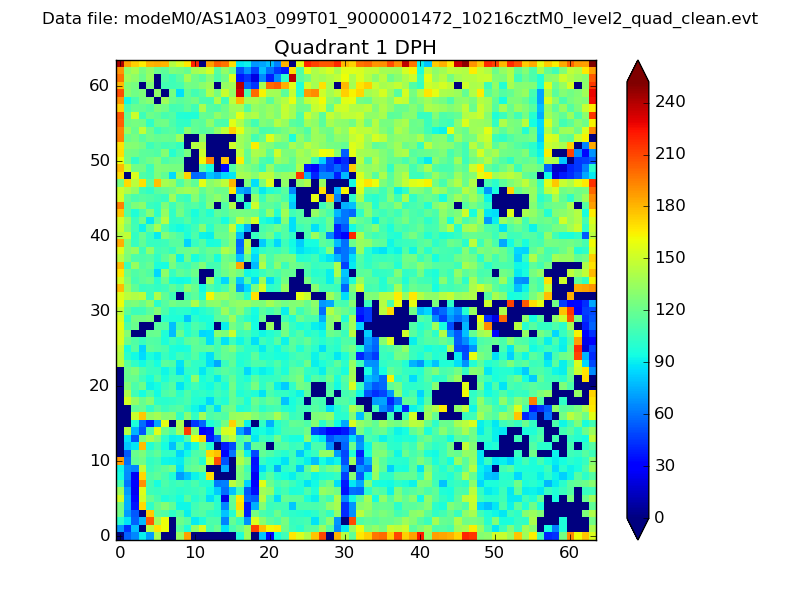 |
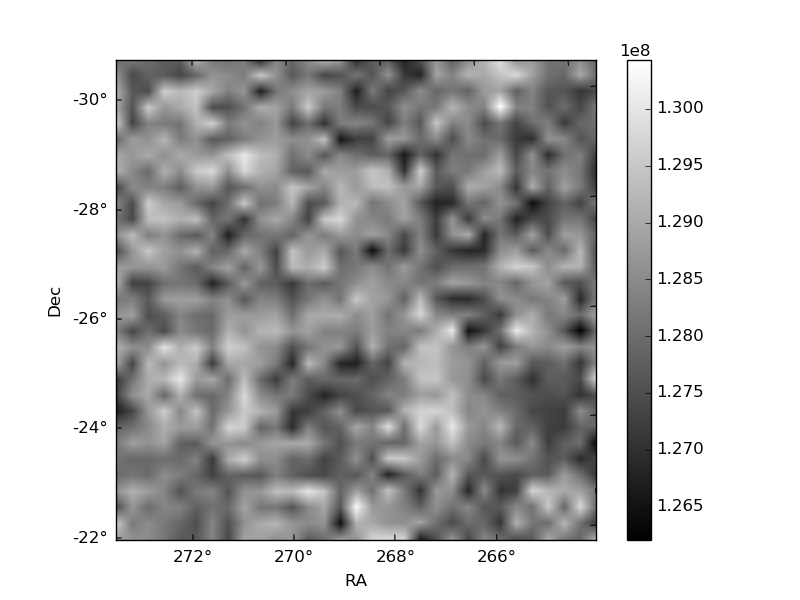
Quadrant B |
|---|---|---|---|
| Quadrant D | 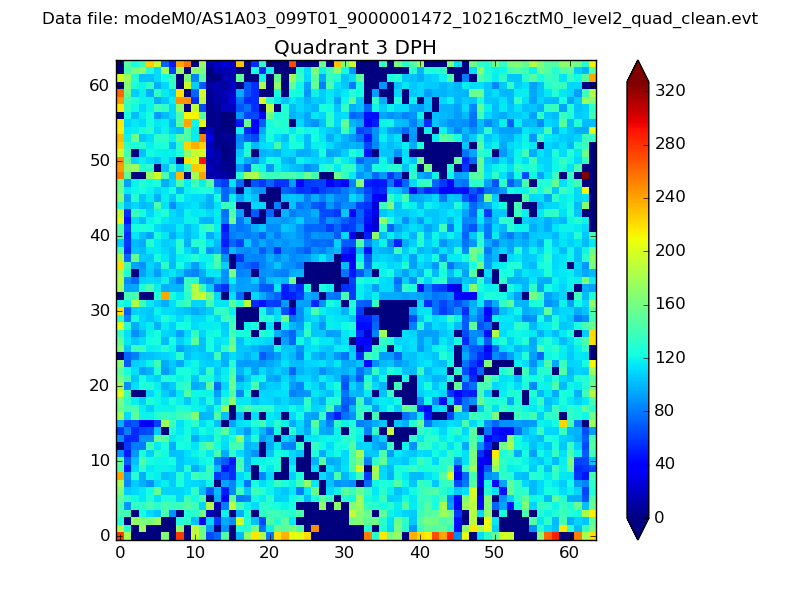 |
 |
Quadrant C |
| Plot type | Count rate plots | Images |
|---|---|---|
| Comparison with Poisson distribution Blue bars denote a histogram of data divided into 1 sec bins. Red curve is a Poisson curve with rate = median count rate of data. |
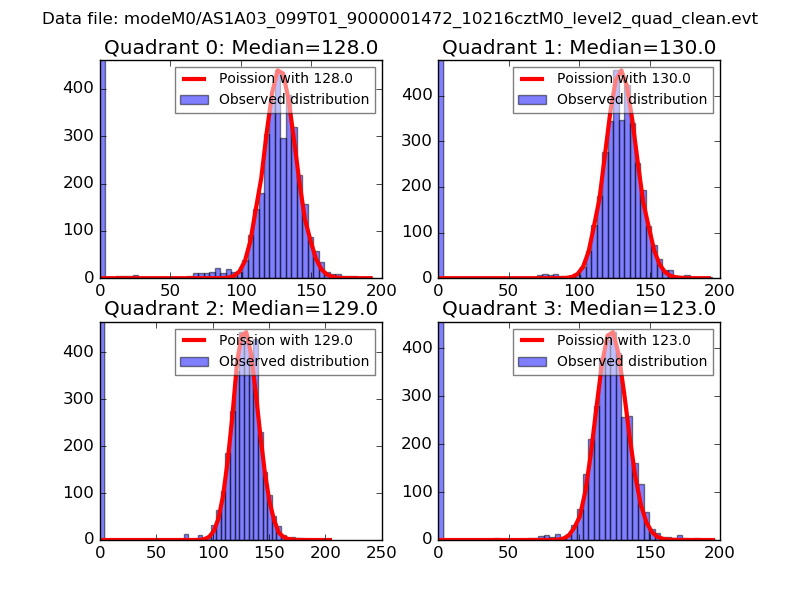 |
 |
| Quadrant-wise count rates Data is divided into 100 sec bins |
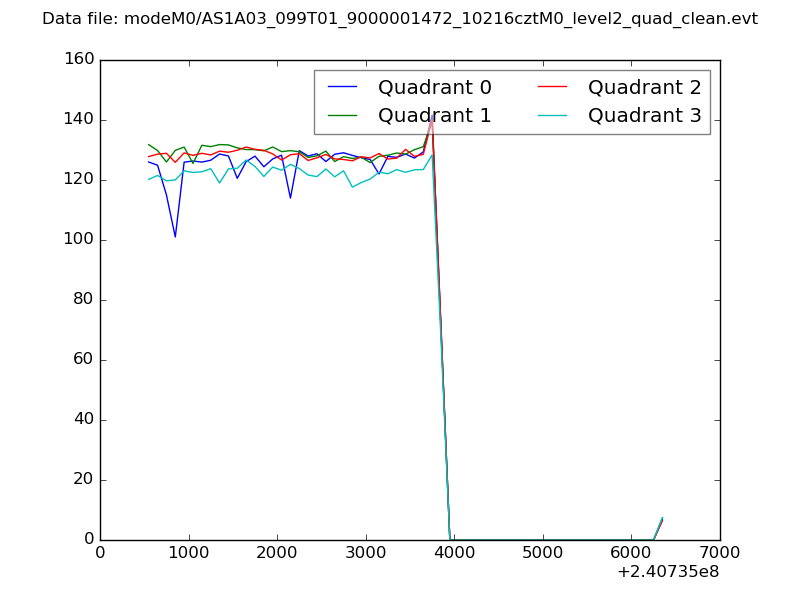 |
|
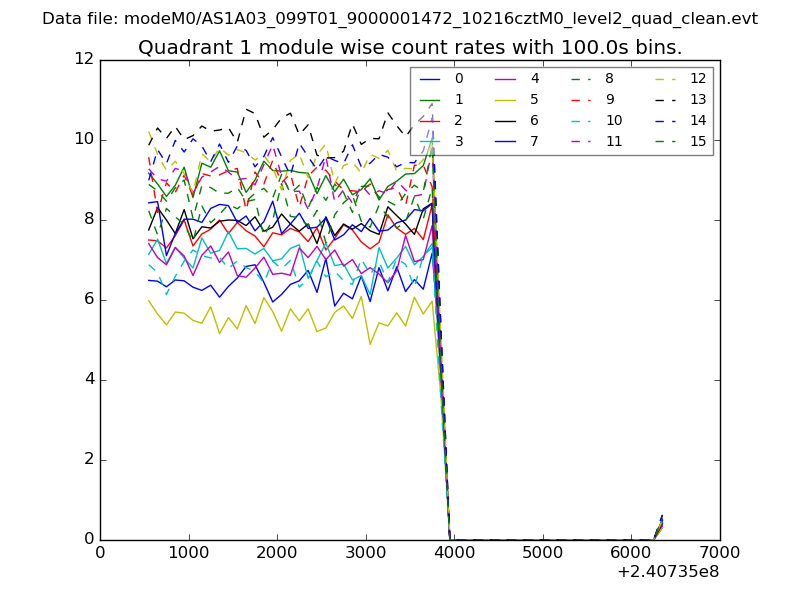
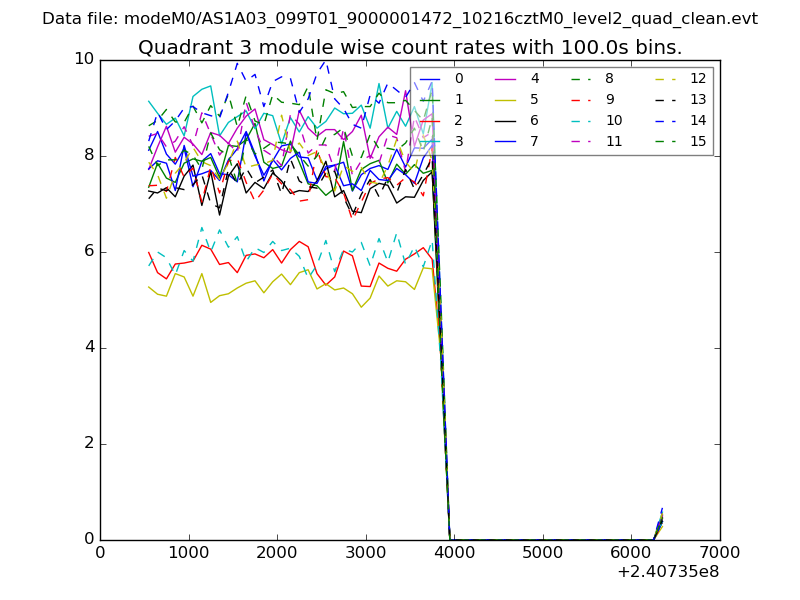
| Module-wise count rates for Quadrant A Data is divided into 100 sec bins |
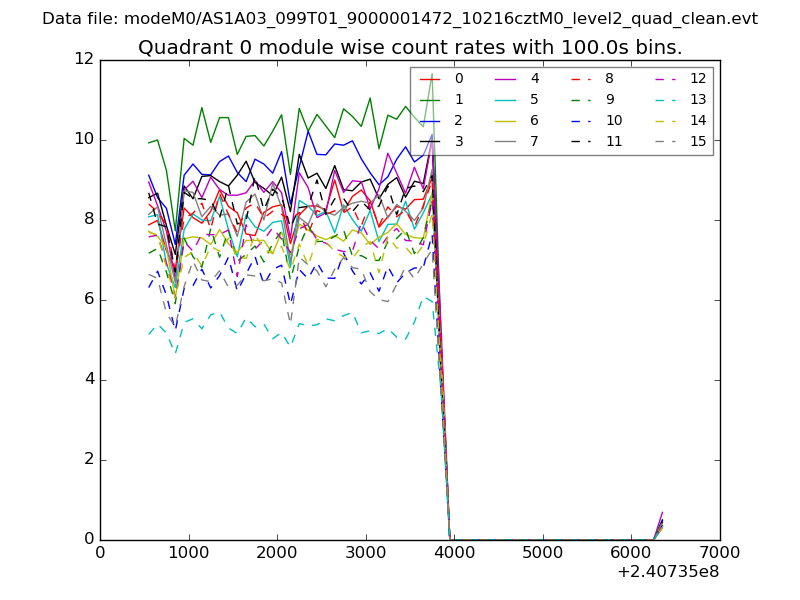 |
 |
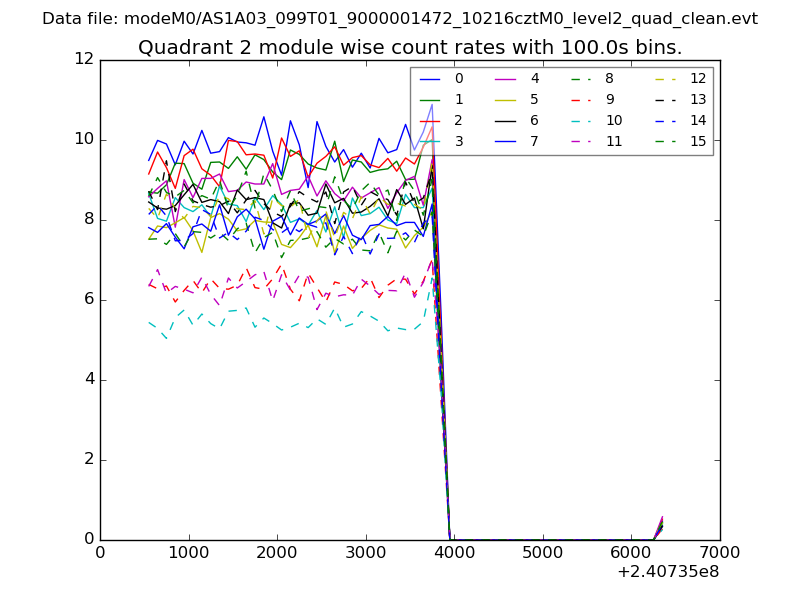
| Module-wise count rates for Quadrant B Data is divided into 100 sec bins |
 |
 |
| Module-wise count rates for Quadrant C Data is divided into 100 sec bins |
 |
 |
| Module-wise count rates for Quadrant D Data is divided into 100 sec bins |
 |
 |
| Parameter | Plot |
|---|---|
| CZT HV Monitor | 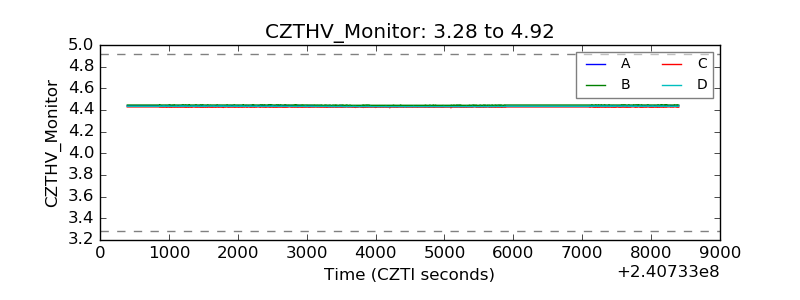 |
| D_VDD | 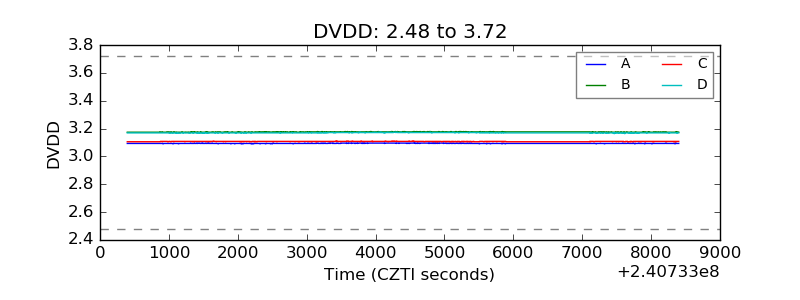 |
| Temperature 1 | 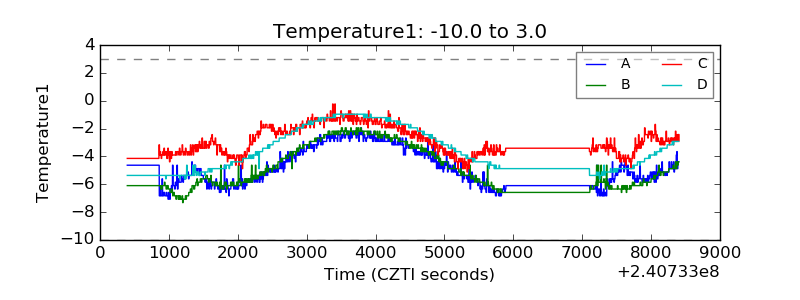 |
| Veto HV Monitor | 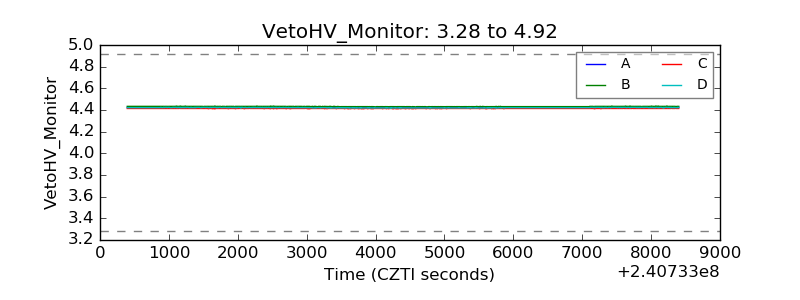 |
| Veto LLD | 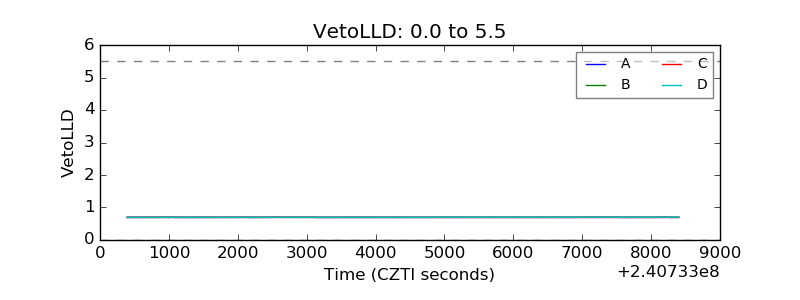 |
| Alpha Counter | 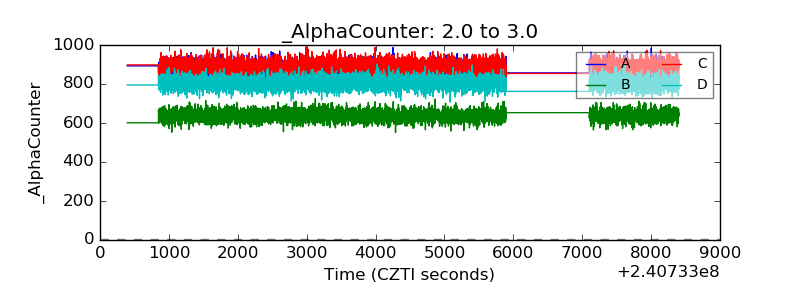 |
| _CPM_Rate | 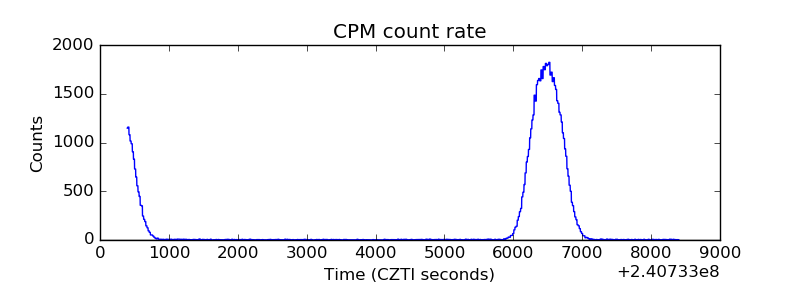 |
| CZT Counter | 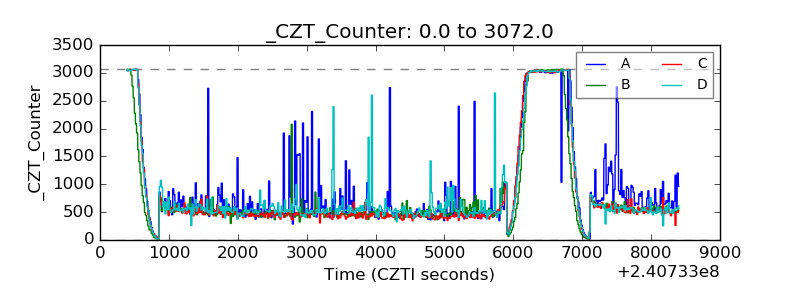 |
| +2.5 Volts monitor |  |
| +5 Volts monitor |  |
| _ROLL_ROT | 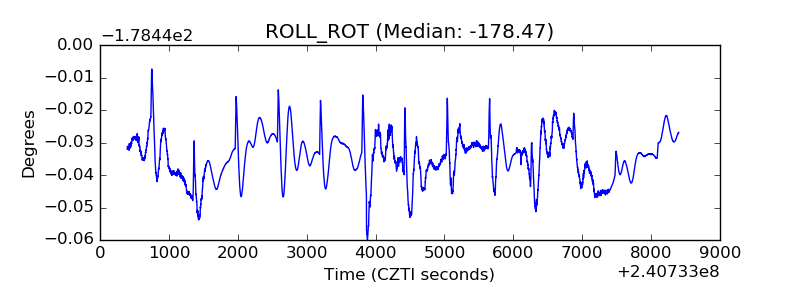 |
| _Roll_DEC | 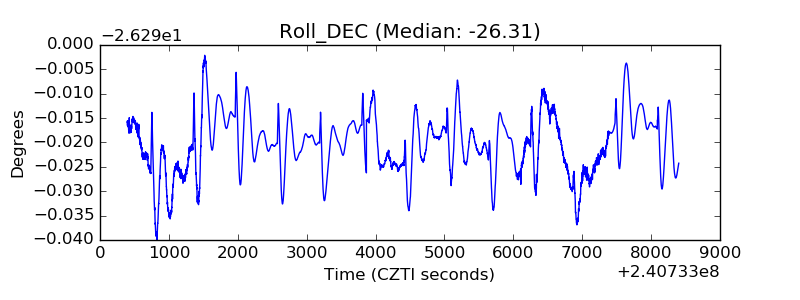 |
| _Roll_RA | 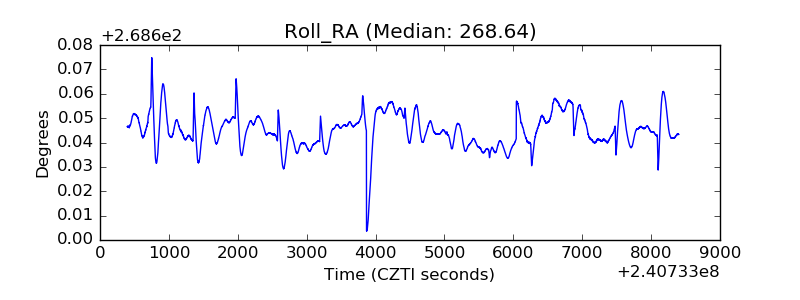 |
| Veto Counter | 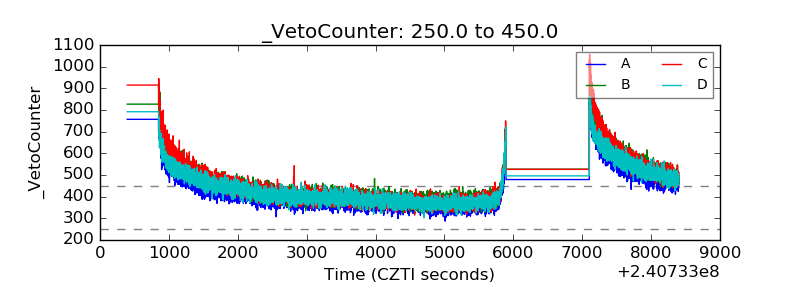 |