| Param | Original file | Final file |
|---|---|---|
| Filename | modeM0/AS1A03_099T01_9000001472_10217cztM0_level2.evt | modeM0/AS1A03_099T01_9000001472_10217cztM0_level2_quad_clean.evt |
| Size (bytes) | 505,872,000 | 88,179,840 |
| Size | 482.4 MB | 84.1 MB |
| Events in quadrant A | 4,537,938 | 556,839 |
| Events in quadrant B | 3,491,010 | 572,607 |
| Events in quadrant C | 3,182,971 | 562,852 |
| Events in quadrant D | 3,682,389 | 539,527 |
| Mode M0 | |||
|---|---|---|---|
| Quadrant | BADHDUFLAG | Total packets | Discarded packets |
| A | 0 | 17843 | 34 |
| B | 0 | 14208 | 17 |
| C | 0 | 13443 | 24 |
| D | 0 | 14938 | 28 |
| Mode SS | |||
|---|---|---|---|
| Quadrant | BADHDUFLAG | Total packets | Discarded packets |
| A | 0 | 126 | 0 |
| B | 0 | 126 | 0 |
| C | 0 | 126 | 0 |
| D | 0 | 126 | 0 |
| Mode M9 | |||
|---|---|---|---|
| Quadrant | BADHDUFLAG | Total packets | Discarded packets |
| A | 0 | 16 | 0 |
| B | 0 | 16 | 0 |
| C | 0 | 16 | 0 |
| D | 0 | 17 | 0 |
| Quadrant | Total seconds | Saturated seconds | Saturation percentage |
|---|---|---|---|
| A | 6288 | 245 | 3.896310% |
| B | 6291 | 83 | 1.319345% |
| C | 6287 | 63 | 1.002068% |
| D | 6287 | 92 | 1.463337% |
Noise dominated data is calculated using 1-second bins in cleaned event files. If a bin has >2000 counts, and if more than 50% of those come from <1% of pixels, then it is considered to be noise-dominated and hence unusable.
| Quadrant | # 1 sec bins | Bins with >0 counts | Bins with >2000 counts | High rate bins dominated by noise | Noise dominated (total time) | Noise dominated (detector-on time) | Marked lightcurve |
|---|---|---|---|---|---|---|---|
| A | 7568 | 6298 | 99 | 99 | 1.31% | 1.57% | 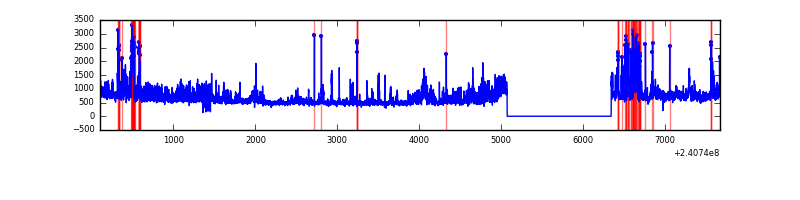 |
| B | 7568 | 6298 | 5 | 5 | 0.07% | 0.08% | 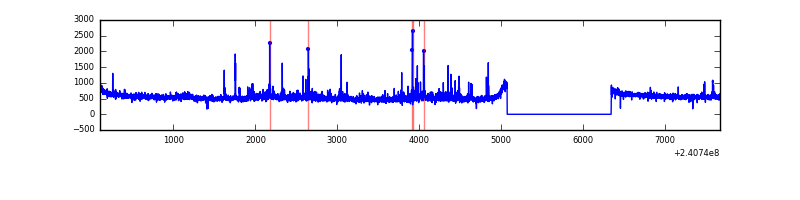 |
| C | 7568 | 6296 | 1 | 1 | 0.01% | 0.02% | 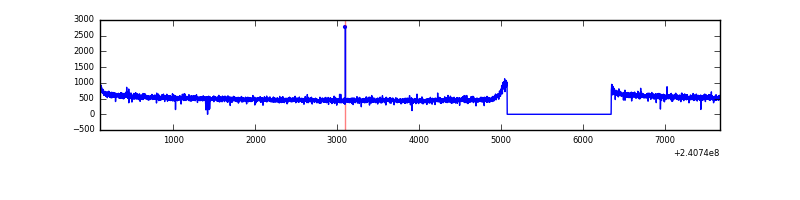 |
| D | 7568 | 6297 | 43 | 43 | 0.57% | 0.68% | 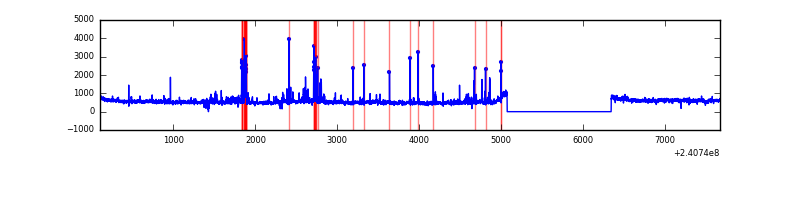 |
Top three noisy pixels from each quadrant. If the there are fewer than three noisy pixels in the level2.evt file, extra rows are filled as -1
| Pixel properties | Quadrant properties | ||||||
|---|---|---|---|---|---|---|---|
| Quadrant | DetID | PixID | Counts | Sigma | Mean | Median | Sigma |
| A | 8 | 15 | 750712 | 4533.36 | 828 | 814 | 165.4 |
| A | 15 | 223 | 281877 | 1699.11 | 828 | 814 | 165.4 |
| A | 8 | 5 | 190188 | 1144.82 | 828 | 814 | 165.4 |
| B | 0 | 214 | 93266 | 594.11 | 835 | 817 | 155.6 |
| B | 4 | 239 | 66579 | 422.61 | 835 | 817 | 155.6 |
| B | 11 | 51 | 61409 | 389.39 | 835 | 817 | 155.6 |
| C | 4 | 175 | 11406 | 57.36 | 810 | 817 | 184.6 |
| C | 0 | 207 | 10923 | 54.74 | 810 | 817 | 184.6 |
| C | 13 | 61 | 5990 | 28.02 | 810 | 817 | 184.6 |
| D | 8 | 195 | 240457 | 1162.54 | 804 | 787 | 206.2 |
| D | 5 | 222 | 143818 | 693.78 | 804 | 787 | 206.2 |
| D | 1 | 52 | 88391 | 424.93 | 804 | 787 | 206.2 |
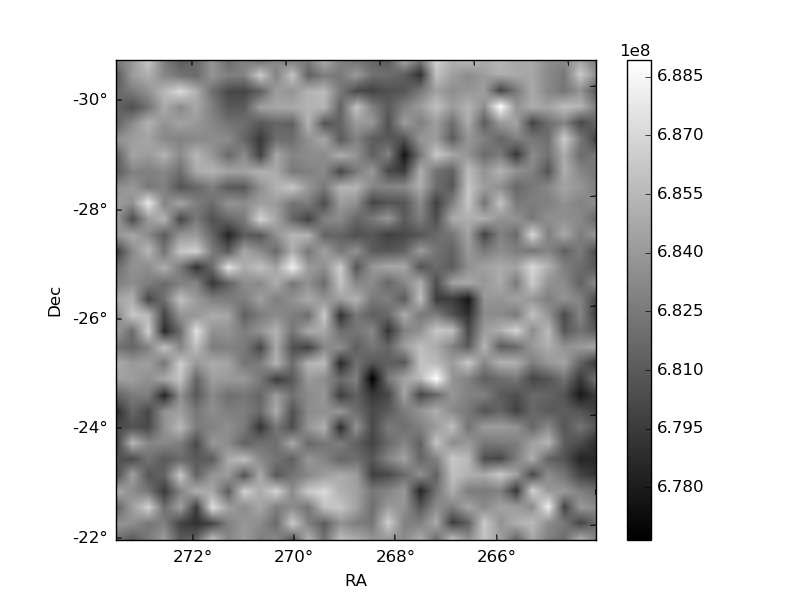
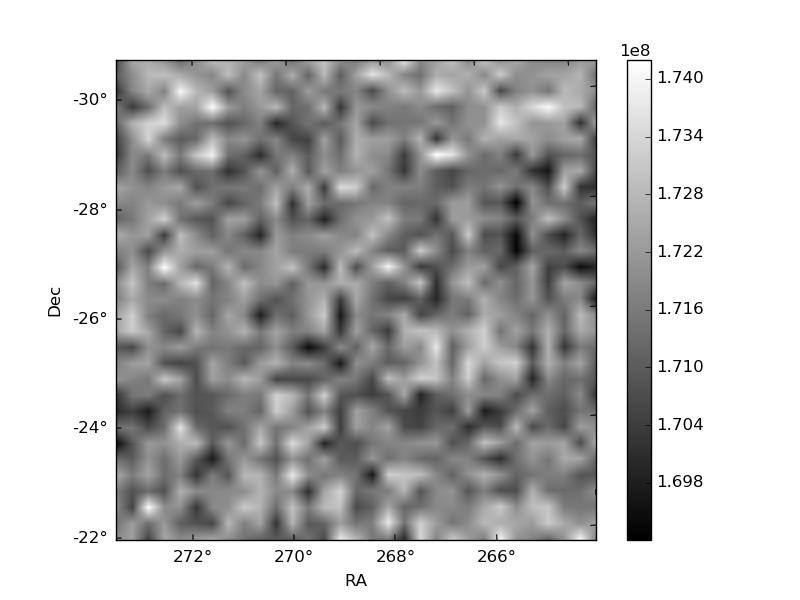
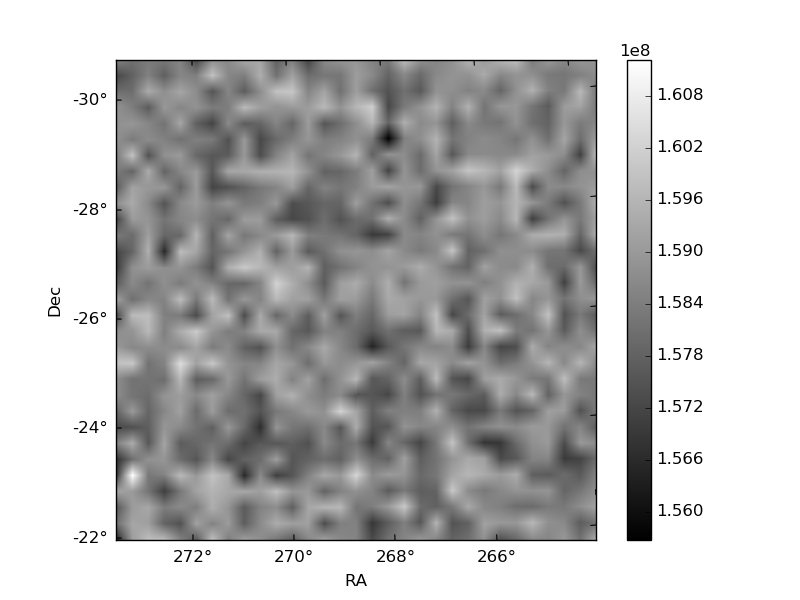
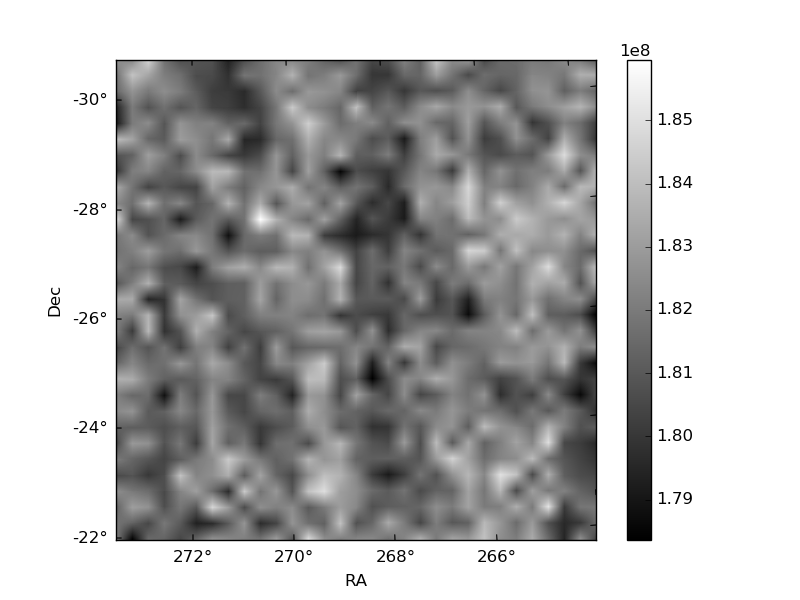
Histogram calculated using DETX and DETY for each event in the final _common_clean file
| Quadrant A | 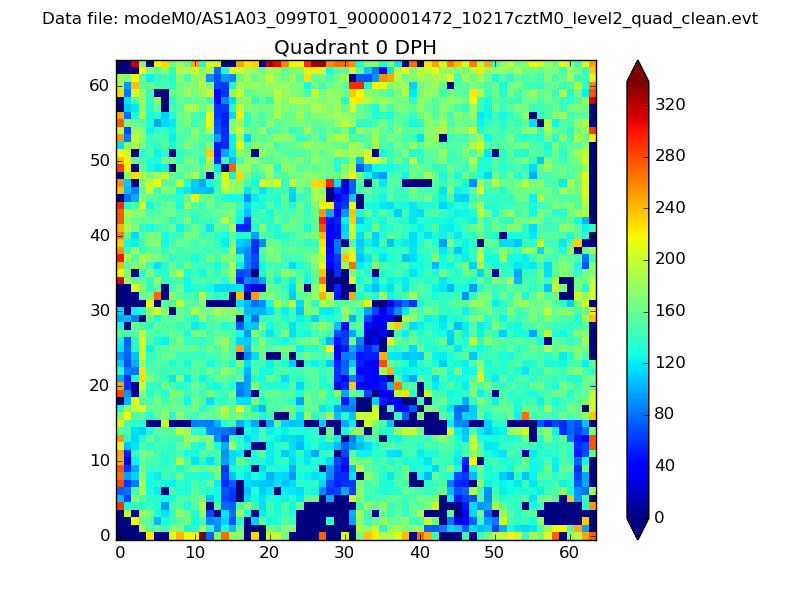 |
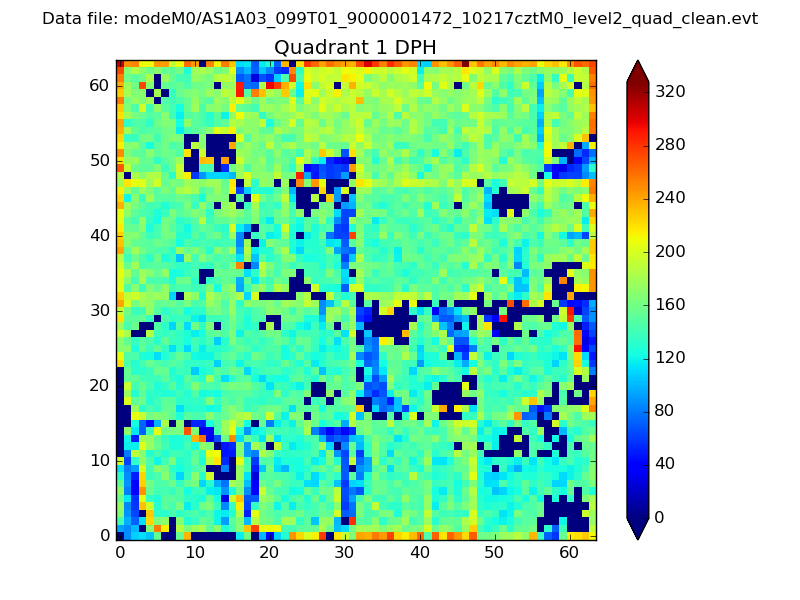 |
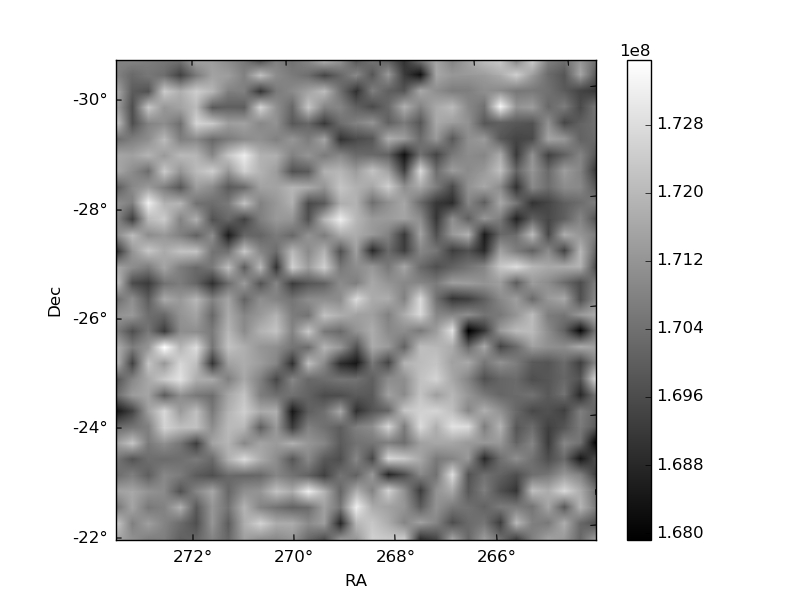
Quadrant B |
|---|---|---|---|
| Quadrant D | 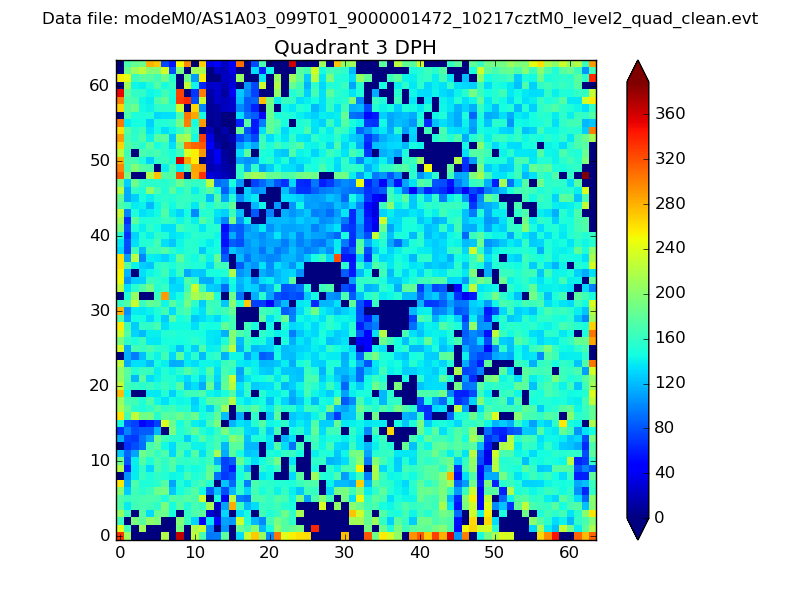 |
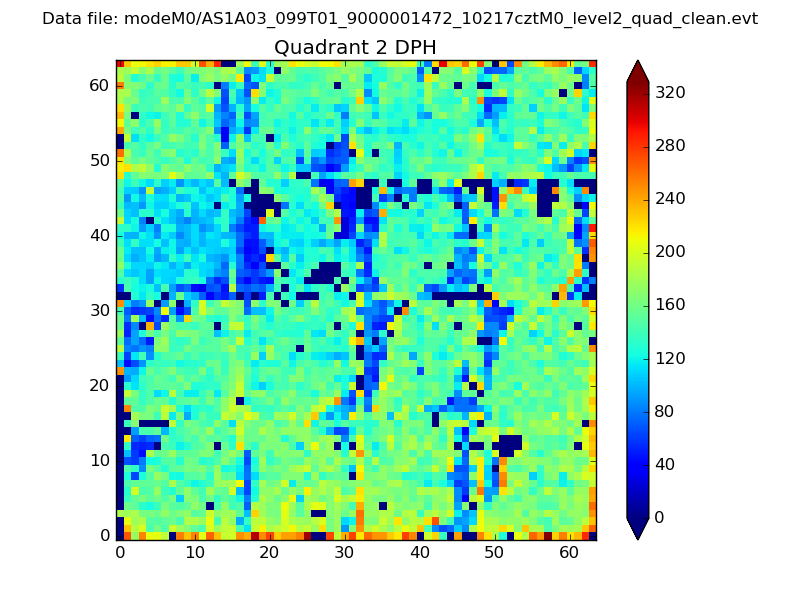 |
Quadrant C |
| Plot type | Count rate plots | Images |
|---|---|---|
| Comparison with Poisson distribution Blue bars denote a histogram of data divided into 1 sec bins. Red curve is a Poisson curve with rate = median count rate of data. |
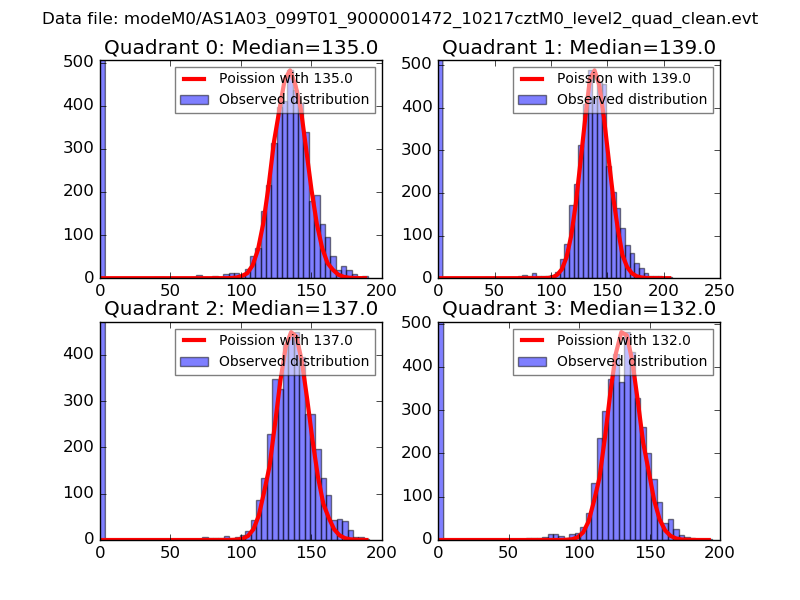 |
 |
| Quadrant-wise count rates Data is divided into 100 sec bins |
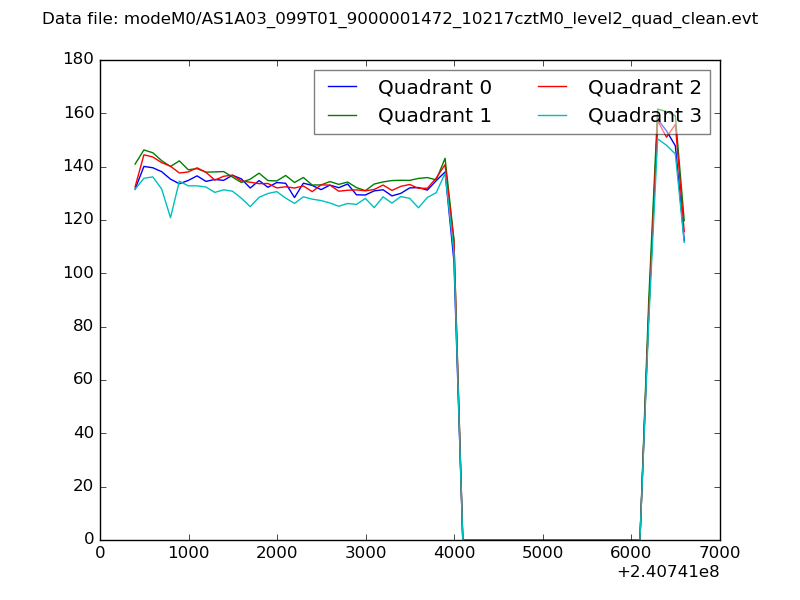 |
|
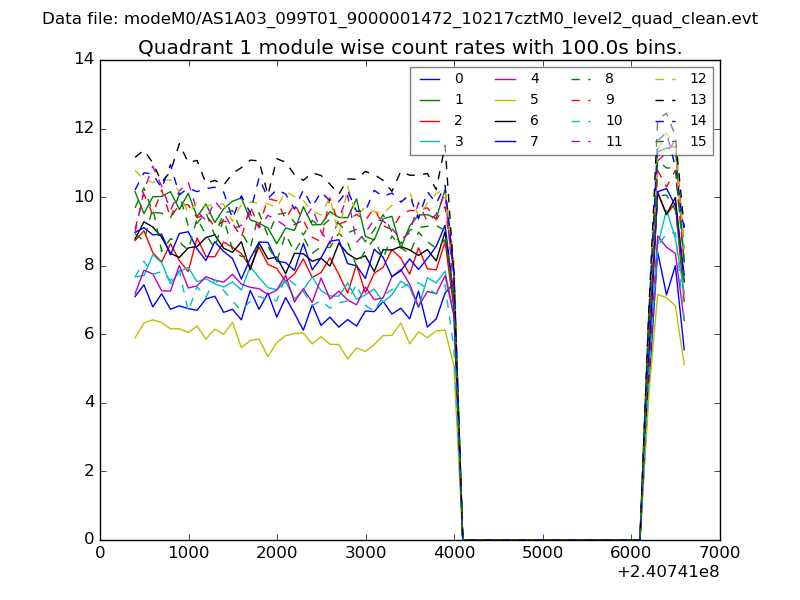
| Module-wise count rates for Quadrant A Data is divided into 100 sec bins |
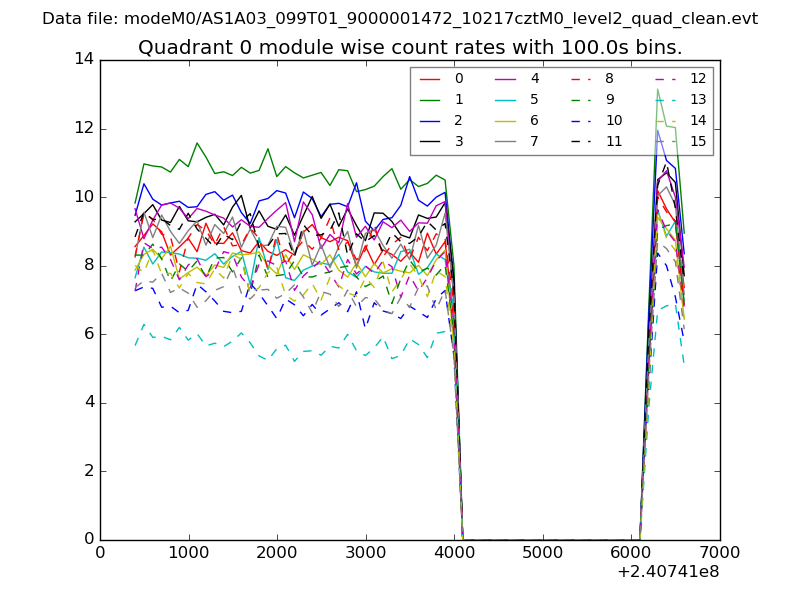 |
 |
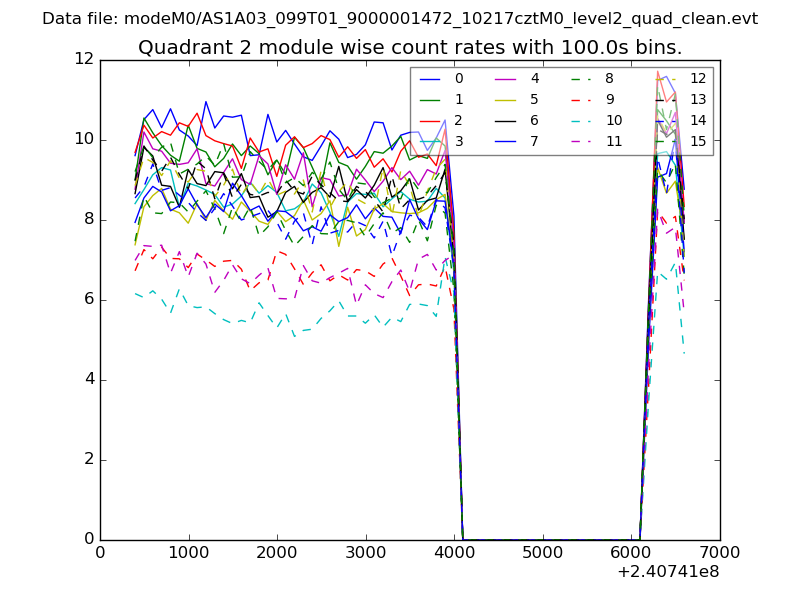
| Module-wise count rates for Quadrant B Data is divided into 100 sec bins |
 |
 |
| Module-wise count rates for Quadrant C Data is divided into 100 sec bins |
 |
 |
| Module-wise count rates for Quadrant D Data is divided into 100 sec bins |
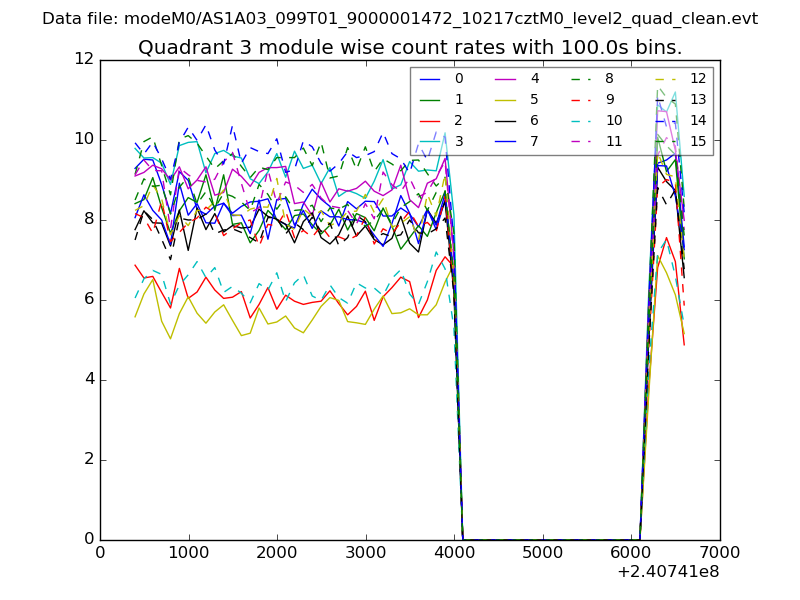 |
 |
| Parameter | Plot |
|---|---|
| CZT HV Monitor | 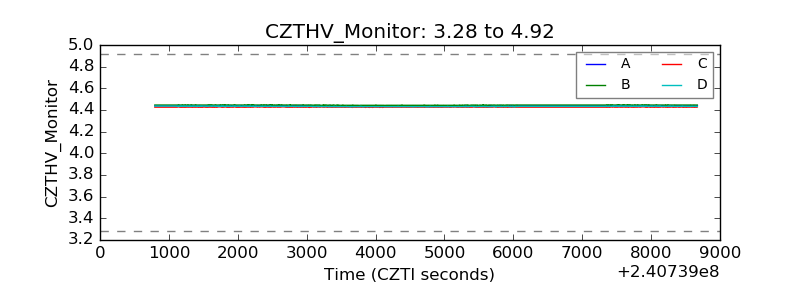 |
| D_VDD | 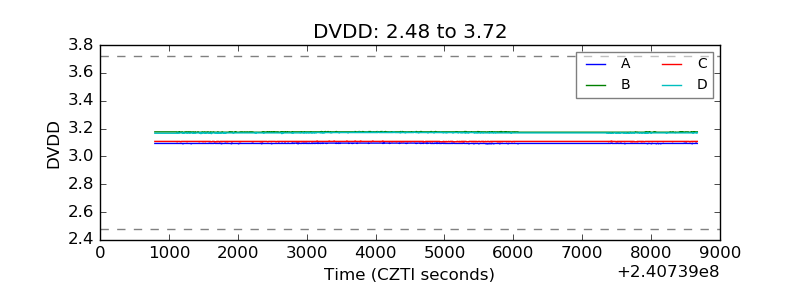 |
| Temperature 1 | 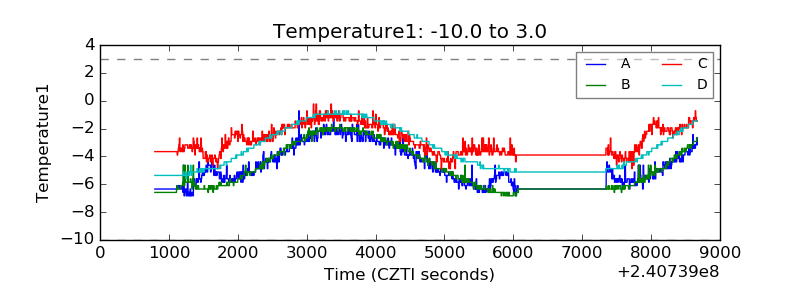 |
| Veto HV Monitor |  |
| Veto LLD | 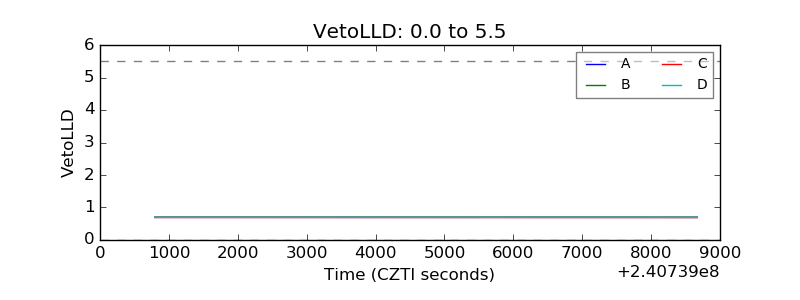 |
| Alpha Counter | 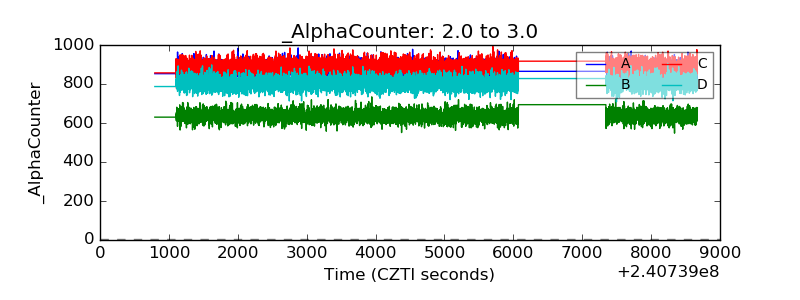 |
| _CPM_Rate | 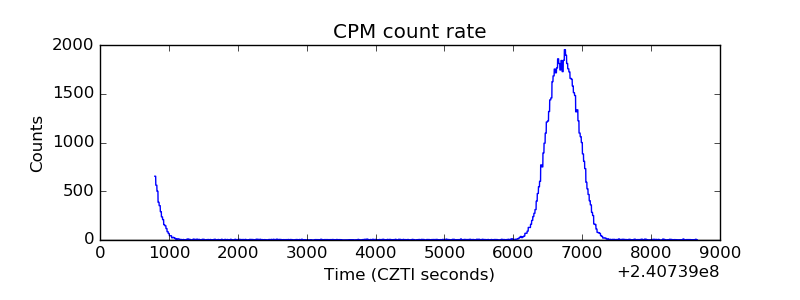 |
| CZT Counter | 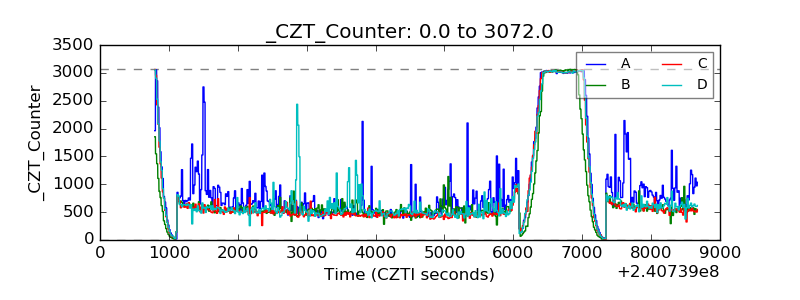 |
| +2.5 Volts monitor |  |
| +5 Volts monitor |  |
| _ROLL_ROT | 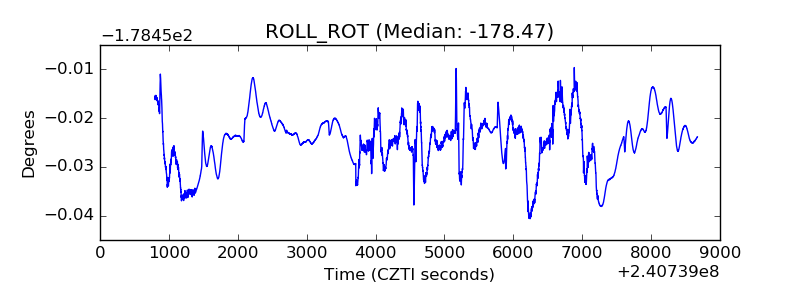 |
| _Roll_DEC | 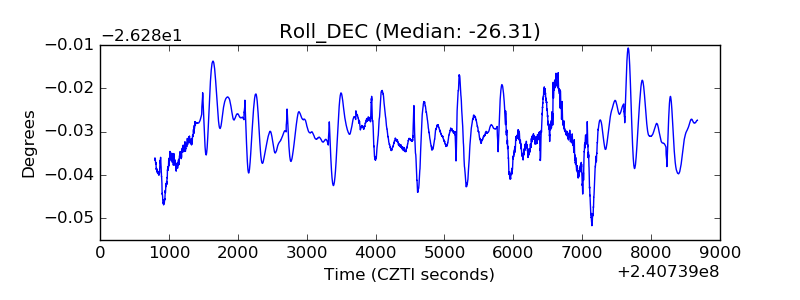 |
| _Roll_RA | 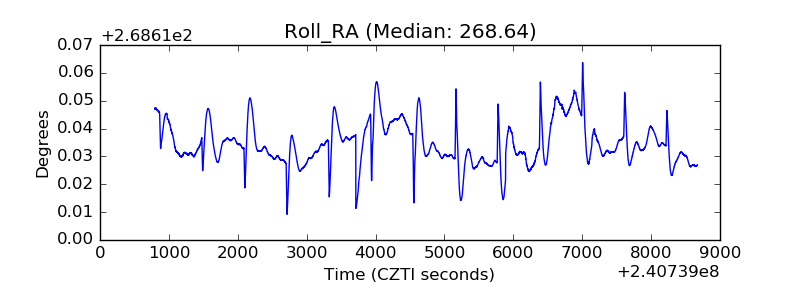 |
| Veto Counter | 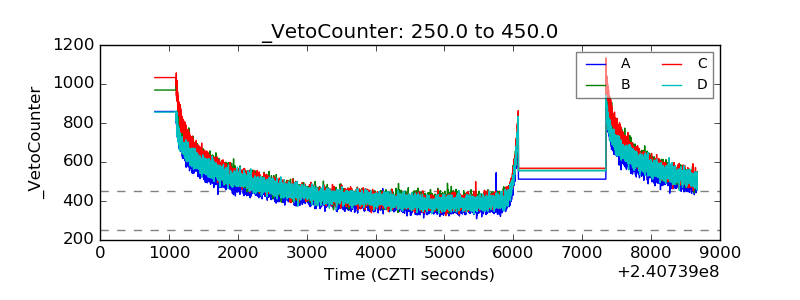 |