| Param | Original file | Final file |
|---|---|---|
| Filename | modeM0/AS1A03_099T01_9000001472_10221cztM0_level2.evt | modeM0/AS1A03_099T01_9000001472_10221cztM0_level2_quad_clean.evt |
| Size (bytes) | 478,396,800 | 91,457,280 |
| Size | 456.2 MB | 87.2 MB |
| Events in quadrant A | 3,685,425 | 585,939 |
| Events in quadrant B | 3,600,246 | 585,679 |
| Events in quadrant C | 2,997,572 | 582,491 |
| Events in quadrant D | 3,756,232 | 554,841 |
| Mode M0 | |||
|---|---|---|---|
| Quadrant | BADHDUFLAG | Total packets | Discarded packets |
| A | 0 | 15247 | 2 |
| B | 0 | 14913 | 1 |
| C | 0 | 13547 | 1 |
| D | 0 | 15479 | 1 |
| Mode SS | |||
|---|---|---|---|
| Quadrant | BADHDUFLAG | Total packets | Discarded packets |
| A | 0 | 134 | 0 |
| B | 0 | 134 | 0 |
| C | 0 | 134 | 0 |
| D | 0 | 134 | 0 |
| Mode M9 | |||
|---|---|---|---|
| Quadrant | BADHDUFLAG | Total packets | Discarded packets |
| A | 0 | 8 | 0 |
| B | 0 | 8 | 0 |
| C | 0 | 8 | 0 |
| D | 0 | 8 | 0 |
| Quadrant | Total seconds | Saturated seconds | Saturation percentage |
|---|---|---|---|
| A | 6609 | 115 | 1.740051% |
| B | 6609 | 145 | 2.193978% |
| C | 6609 | 30 | 0.453926% |
| D | 6609 | 119 | 1.800575% |
Noise dominated data is calculated using 1-second bins in cleaned event files. If a bin has >2000 counts, and if more than 50% of those come from <1% of pixels, then it is considered to be noise-dominated and hence unusable.
| Quadrant | # 1 sec bins | Bins with >0 counts | Bins with >2000 counts | High rate bins dominated by noise | Noise dominated (total time) | Noise dominated (detector-on time) | Marked lightcurve |
|---|---|---|---|---|---|---|---|
| A | 7419 | 6609 | 19 | 19 | 0.26% | 0.29% | 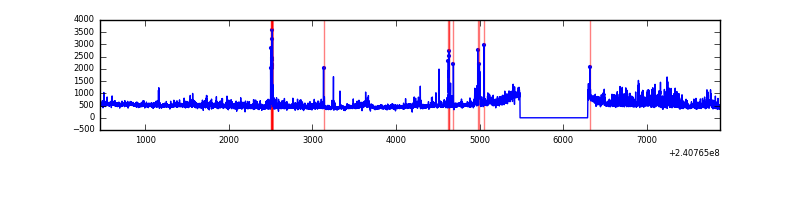 |
| B | 7419 | 6610 | 59 | 59 | 0.80% | 0.89% | 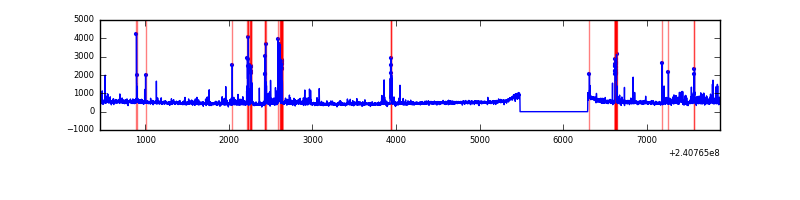 |
| C | 7419 | 6610 | 0 | 0 | 0.00% | 0.00% |  |
| D | 7419 | 6610 | 60 | 60 | 0.81% | 0.91% | 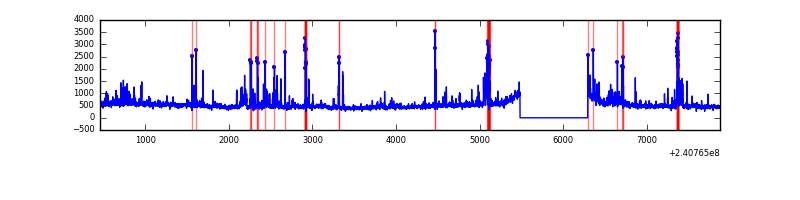 |
Top three noisy pixels from each quadrant. If the there are fewer than three noisy pixels in the level2.evt file, extra rows are filled as -1
| Pixel properties | Quadrant properties | ||||||
|---|---|---|---|---|---|---|---|
| Quadrant | DetID | PixID | Counts | Sigma | Mean | Median | Sigma |
| A | 8 | 15 | 492507 | 3044.64 | 793 | 779 | 161.5 |
| A | 15 | 223 | 77492 | 474.98 | 793 | 779 | 161.5 |
| A | 15 | 239 | 37347 | 226.42 | 793 | 779 | 161.5 |
| B | 4 | 239 | 194258 | 1271.12 | 790 | 771 | 152.2 |
| B | 4 | 81 | 90775 | 591.28 | 790 | 771 | 152.2 |
| B | 11 | 51 | 70433 | 457.65 | 790 | 771 | 152.2 |
| C | 0 | 207 | 17176 | 92.94 | 761 | 765 | 176.6 |
| C | 4 | 175 | 6740 | 33.84 | 761 | 765 | 176.6 |
| C | 13 | 61 | 5825 | 28.66 | 761 | 765 | 176.6 |
| D | 1 | 52 | 345436 | 1881.86 | 761 | 743 | 183.2 |
| D | 8 | 195 | 282606 | 1538.84 | 761 | 743 | 183.2 |
| D | 2 | 33 | 82007 | 443.66 | 761 | 743 | 183.2 |
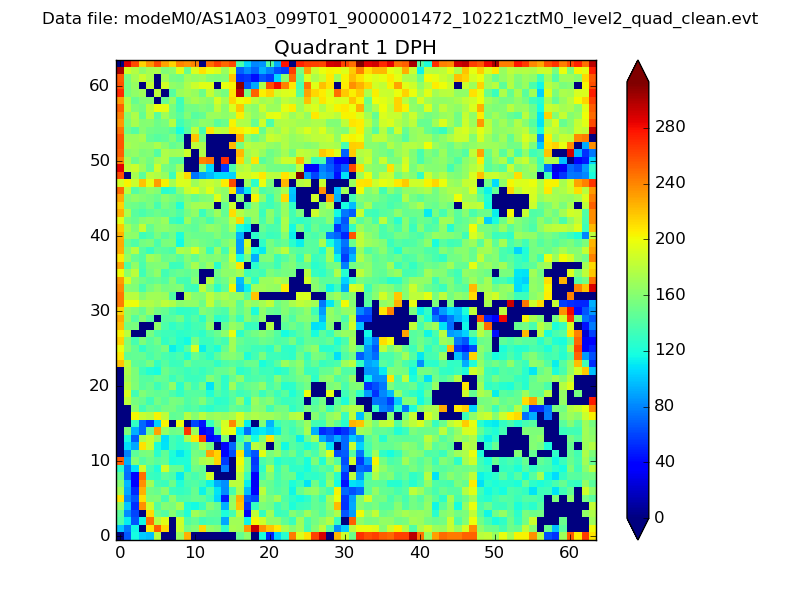
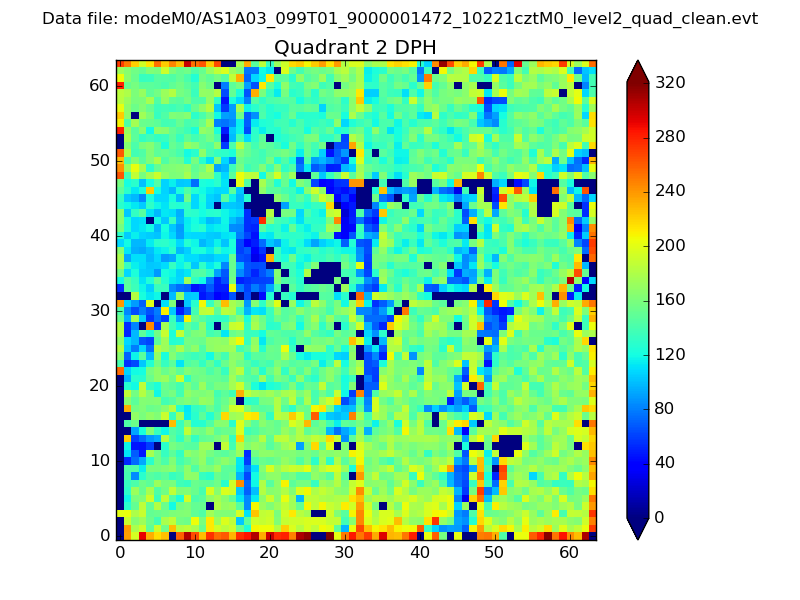
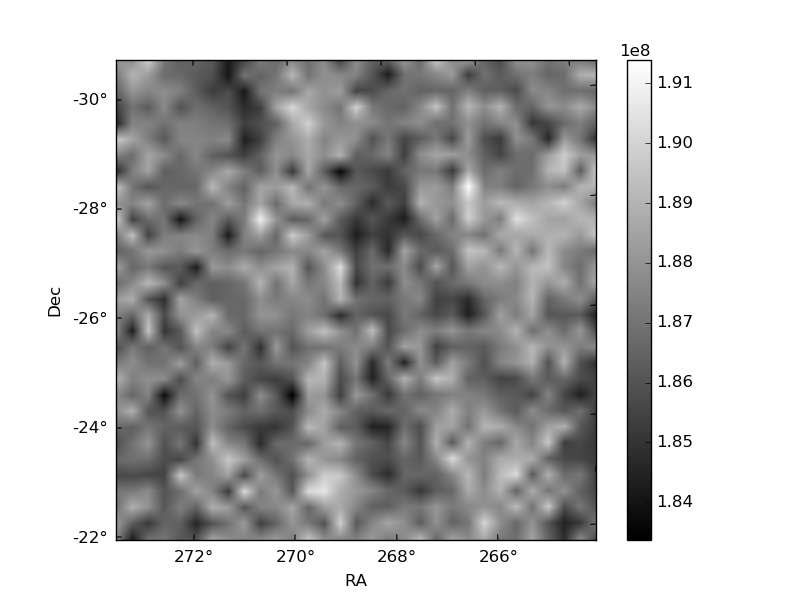
Histogram calculated using DETX and DETY for each event in the final _common_clean file
| Quadrant A | 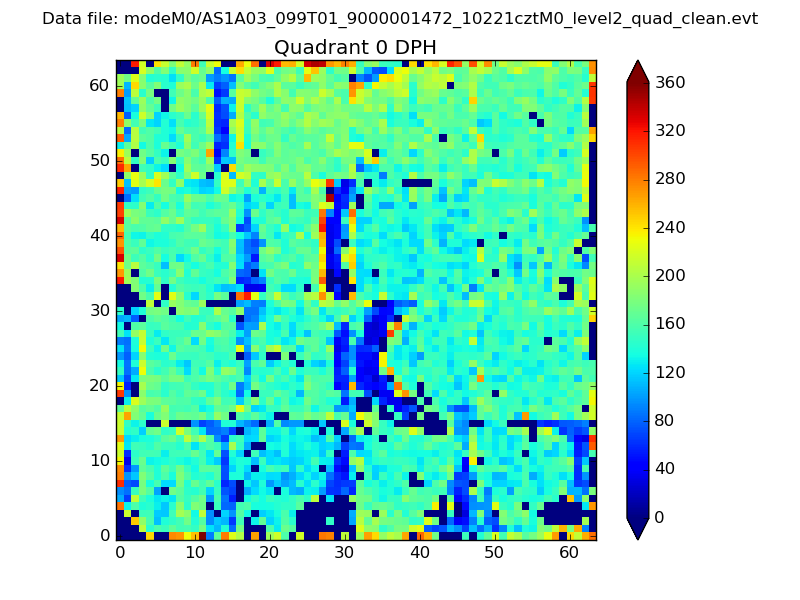 |
 |
Quadrant B |
|---|---|---|---|
| Quadrant D | 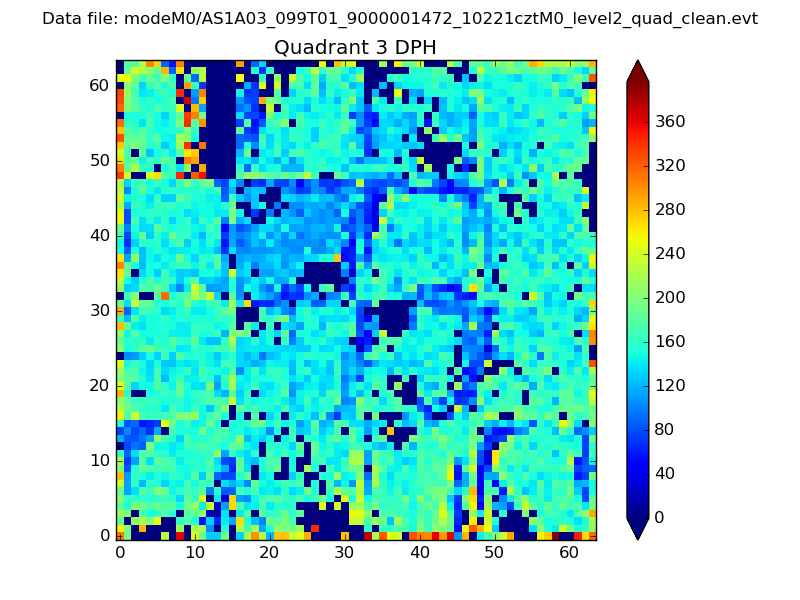 |
 |
Quadrant C |
| Plot type | Count rate plots | Images |
|---|---|---|
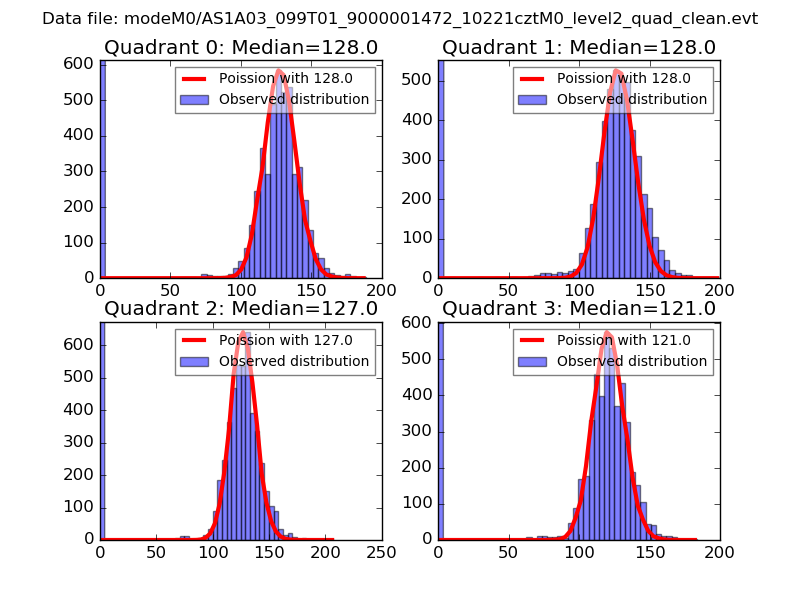
| Comparison with Poisson distribution Blue bars denote a histogram of data divided into 1 sec bins. Red curve is a Poisson curve with rate = median count rate of data. |
 |
 |
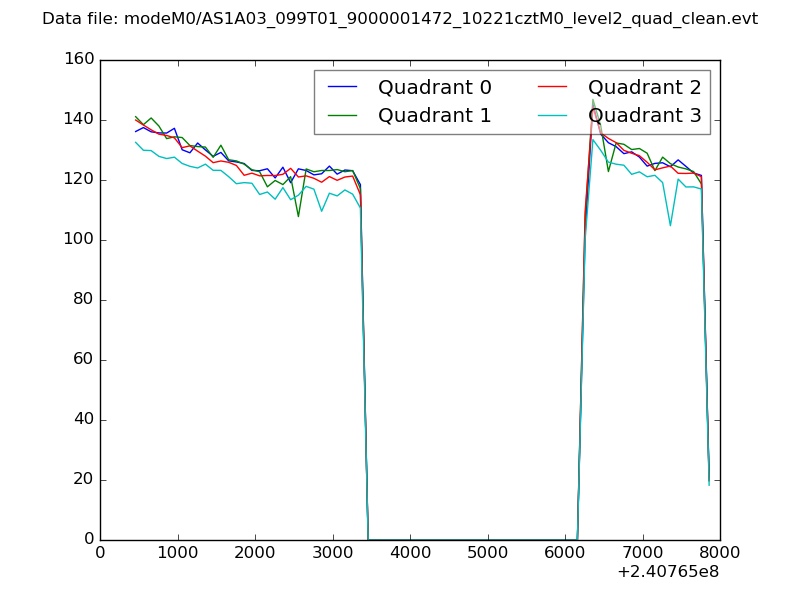
| Quadrant-wise count rates Data is divided into 100 sec bins |
 |
|
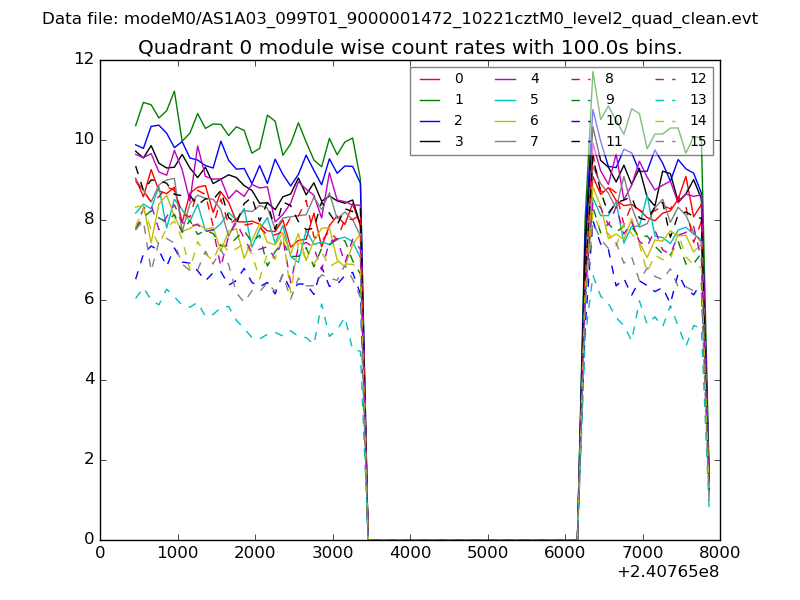
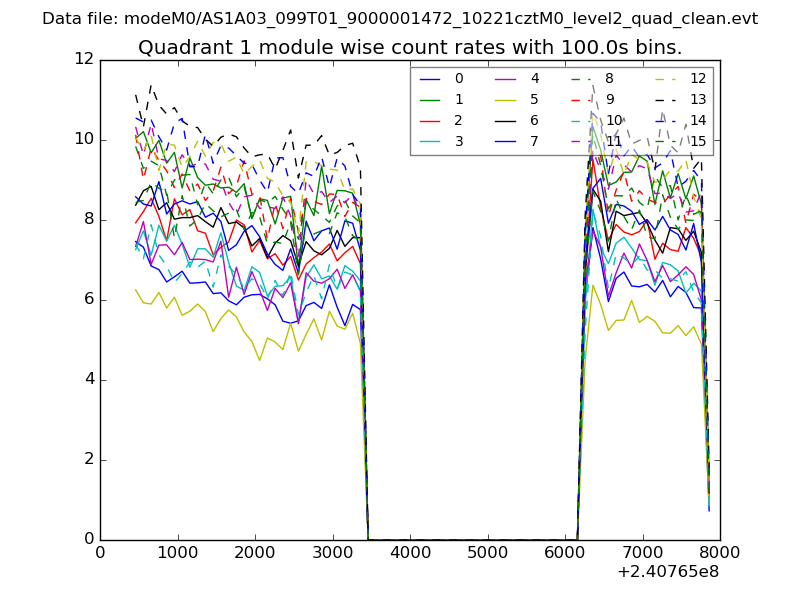
| Module-wise count rates for Quadrant A Data is divided into 100 sec bins |
 |
 |
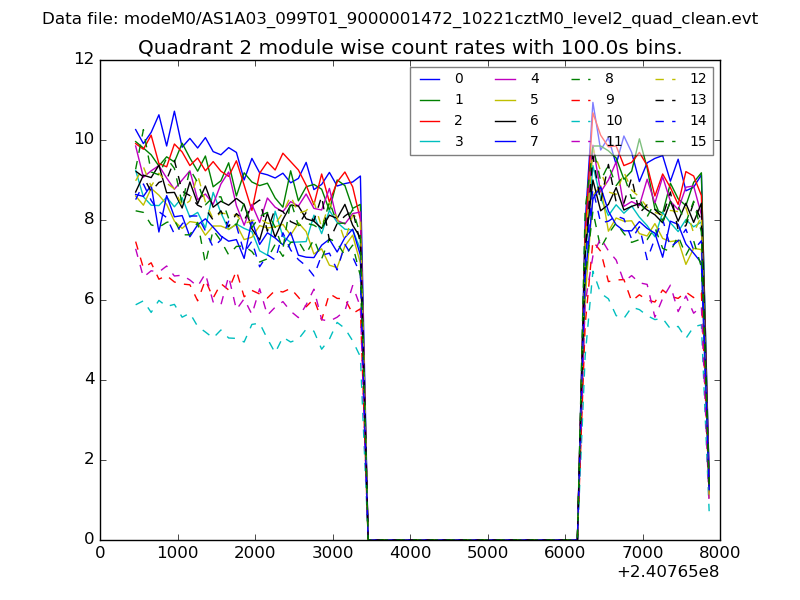
| Module-wise count rates for Quadrant B Data is divided into 100 sec bins |
 |
 |
| Module-wise count rates for Quadrant C Data is divided into 100 sec bins |
 |
 |
| Module-wise count rates for Quadrant D Data is divided into 100 sec bins |
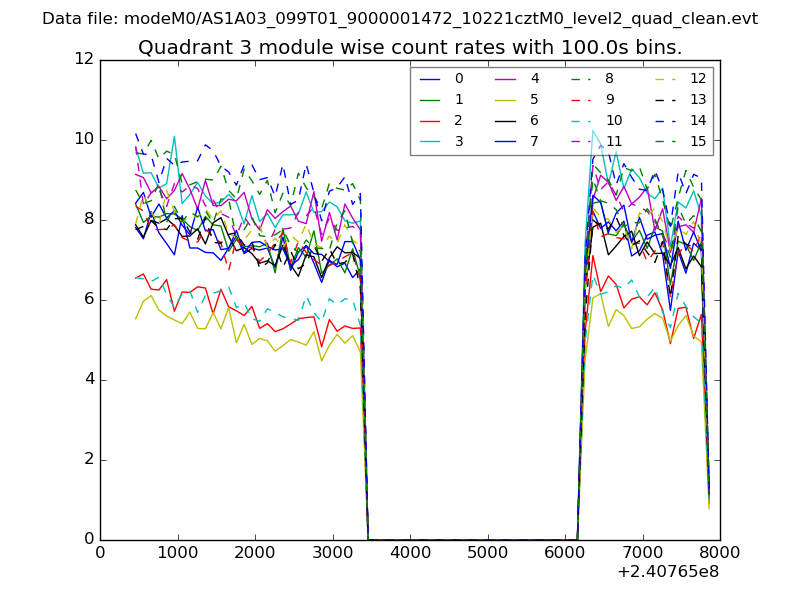 |
 |
| Parameter | Plot |
|---|---|
| CZT HV Monitor | 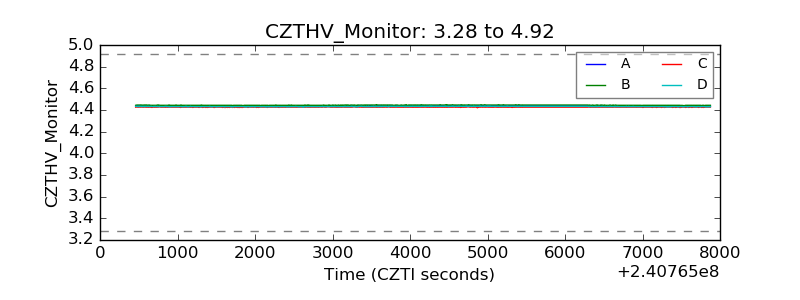 |
| D_VDD | 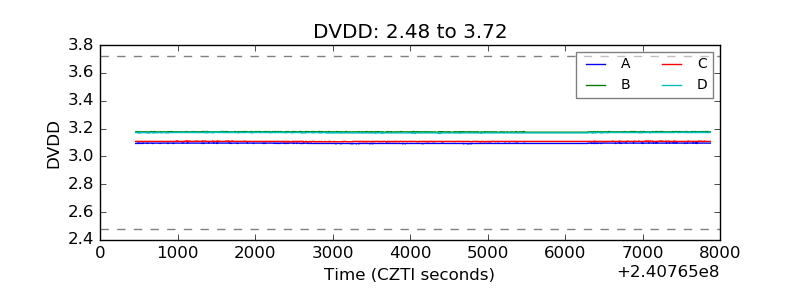 |
| Temperature 1 | 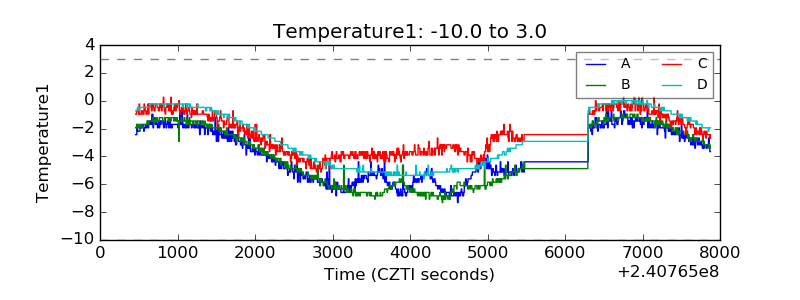 |
| Veto HV Monitor | 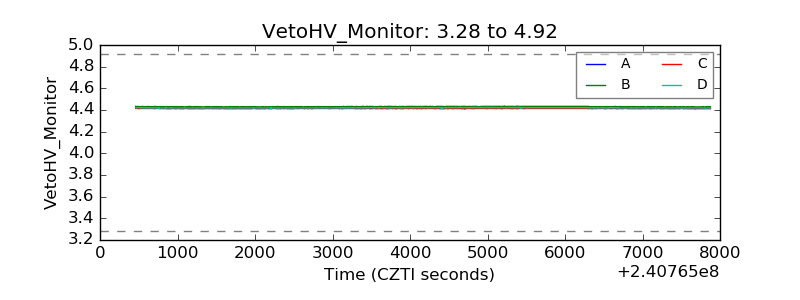 |
| Veto LLD | 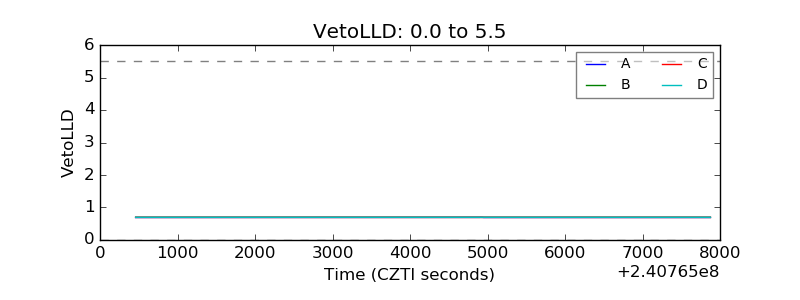 |
| Alpha Counter | 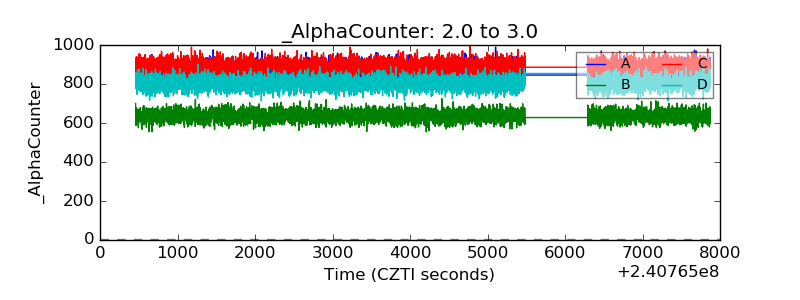 |
| _CPM_Rate | 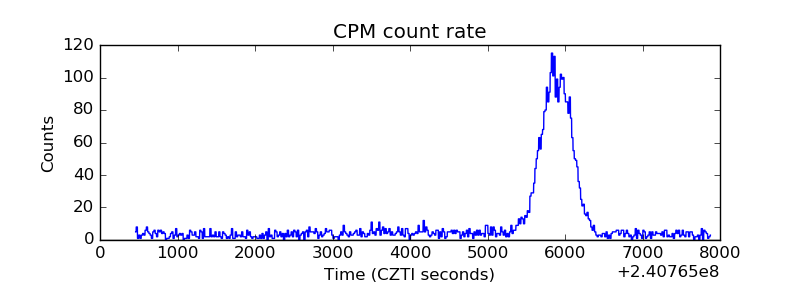 |
| CZT Counter | 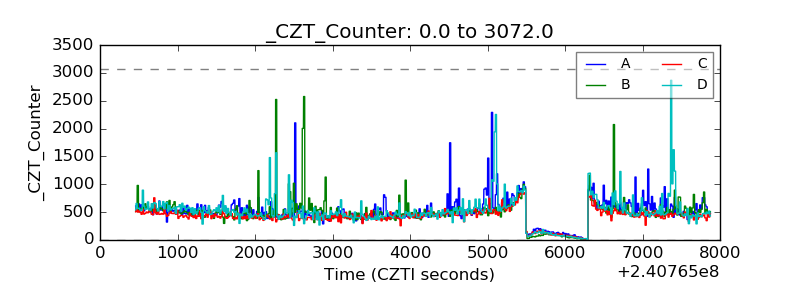 |
| +2.5 Volts monitor | 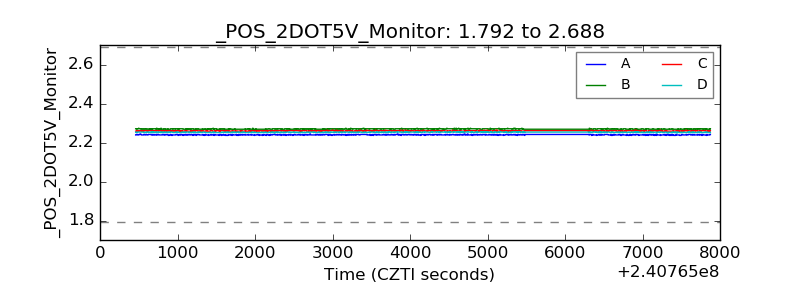 |
| +5 Volts monitor |  |
| _ROLL_ROT | 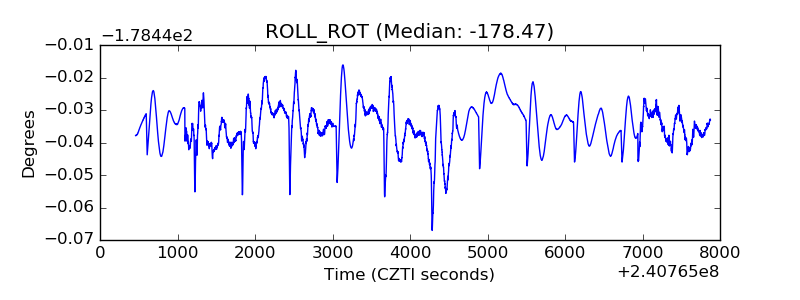 |
| _Roll_DEC | 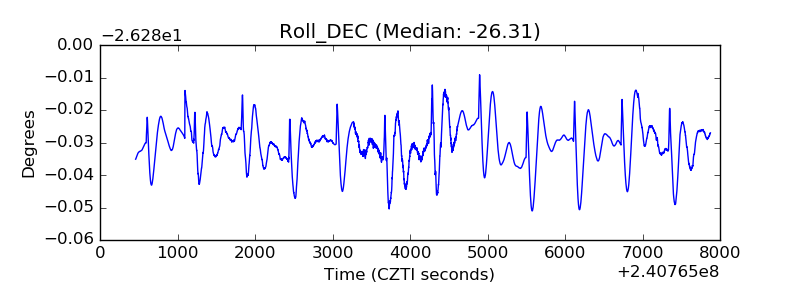 |
| _Roll_RA | 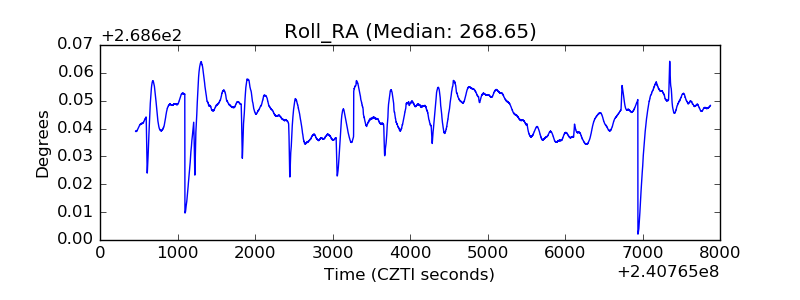 |
| Veto Counter | 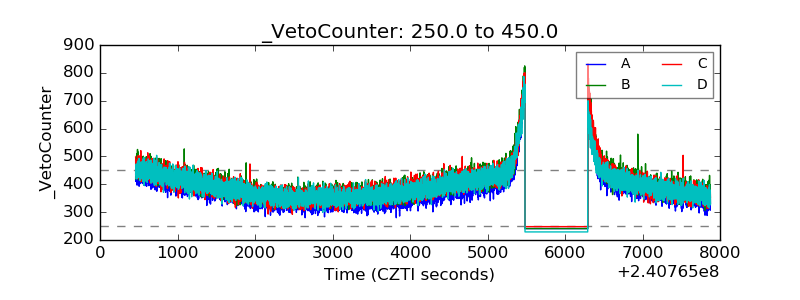 |