| Param | Original file | Final file |
|---|---|---|
| Filename | modeM0/AS1A03_099T01_9000001472_10222cztM0_level2.evt | modeM0/AS1A03_099T01_9000001472_10222cztM0_level2_quad_clean.evt |
| Size (bytes) | 520,142,400 | 98,700,480 |
| Size | 496.0 MB | 94.1 MB |
| Events in quadrant A | 4,156,013 | 625,758 |
| Events in quadrant B | 3,875,985 | 635,455 |
| Events in quadrant C | 3,268,579 | 630,116 |
| Events in quadrant D | 3,966,208 | 599,155 |
| Mode M0 | |||
|---|---|---|---|
| Quadrant | BADHDUFLAG | Total packets | Discarded packets |
| A | 0 | 17175 | 3 |
| B | 0 | 16160 | 2 |
| C | 0 | 14695 | 2 |
| D | 0 | 16584 | 2 |
| Mode SS | |||
|---|---|---|---|
| Quadrant | BADHDUFLAG | Total packets | Discarded packets |
| A | 0 | 146 | 0 |
| B | 0 | 146 | 0 |
| C | 0 | 146 | 0 |
| D | 0 | 146 | 0 |
| Mode M9 | |||
|---|---|---|---|
| Quadrant | BADHDUFLAG | Total packets | Discarded packets |
| A | 0 | 6 | 0 |
| B | 0 | 6 | 0 |
| C | 0 | 6 | 0 |
| D | 0 | 7 | 0 |
| Quadrant | Total seconds | Saturated seconds | Saturation percentage |
|---|---|---|---|
| A | 7154 | 187 | 2.613922% |
| B | 7154 | 88 | 1.230081% |
| C | 7154 | 7 | 0.097847% |
| D | 7154 | 89 | 1.244059% |
Noise dominated data is calculated using 1-second bins in cleaned event files. If a bin has >2000 counts, and if more than 50% of those come from <1% of pixels, then it is considered to be noise-dominated and hence unusable.
| Quadrant | # 1 sec bins | Bins with >0 counts | Bins with >2000 counts | High rate bins dominated by noise | Noise dominated (total time) | Noise dominated (detector-on time) | Marked lightcurve |
|---|---|---|---|---|---|---|---|
| A | 7629 | 7156 | 95 | 95 | 1.25% | 1.33% | 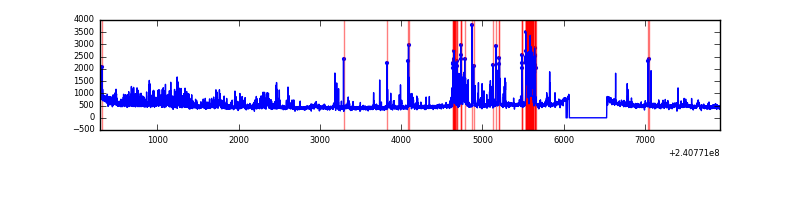 |
| B | 7629 | 7156 | 34 | 34 | 0.45% | 0.48% | 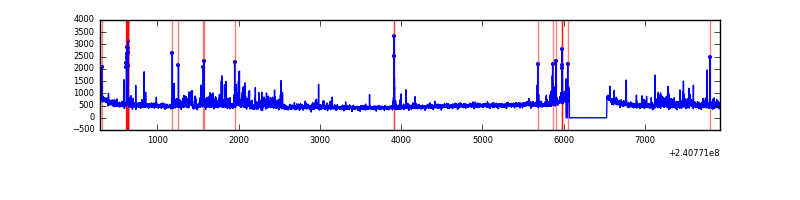 |
| C | 7629 | 7156 | 0 | 0 | 0.00% | 0.00% | 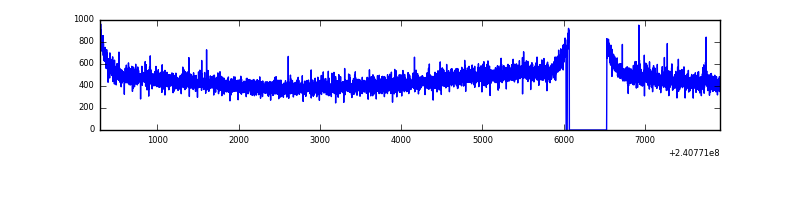 |
| D | 7629 | 7156 | 59 | 59 | 0.77% | 0.82% | 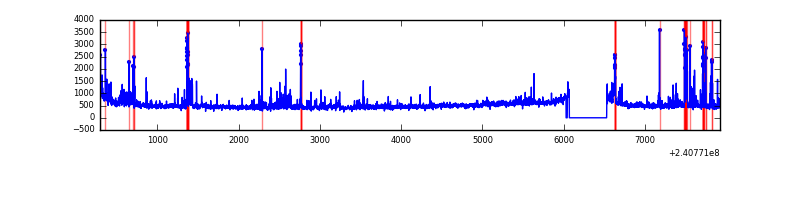 |
Top three noisy pixels from each quadrant. If the there are fewer than three noisy pixels in the level2.evt file, extra rows are filled as -1
| Pixel properties | Quadrant properties | ||||||
|---|---|---|---|---|---|---|---|
| Quadrant | DetID | PixID | Counts | Sigma | Mean | Median | Sigma |
| A | 8 | 15 | 353110 | 2047.18 | 849 | 832 | 172.1 |
| A | 15 | 223 | 345216 | 2001.31 | 849 | 832 | 172.1 |
| A | 15 | 239 | 143655 | 829.98 | 849 | 832 | 172.1 |
| B | 4 | 81 | 229696 | 1394.32 | 858 | 837 | 164.1 |
| B | 4 | 239 | 86937 | 524.56 | 858 | 837 | 164.1 |
| B | 11 | 51 | 86327 | 520.85 | 858 | 837 | 164.1 |
| C | 0 | 207 | 50932 | 260.74 | 823 | 825 | 192.2 |
| C | 13 | 61 | 6062 | 27.25 | 823 | 825 | 192.2 |
| C | 4 | 175 | 5441 | 24.02 | 823 | 825 | 192.2 |
| D | 1 | 52 | 397602 | 1992.69 | 822 | 801 | 199.1 |
| D | 8 | 195 | 226662 | 1134.25 | 822 | 801 | 199.1 |
| D | 2 | 33 | 74539 | 370.3 | 822 | 801 | 199.1 |
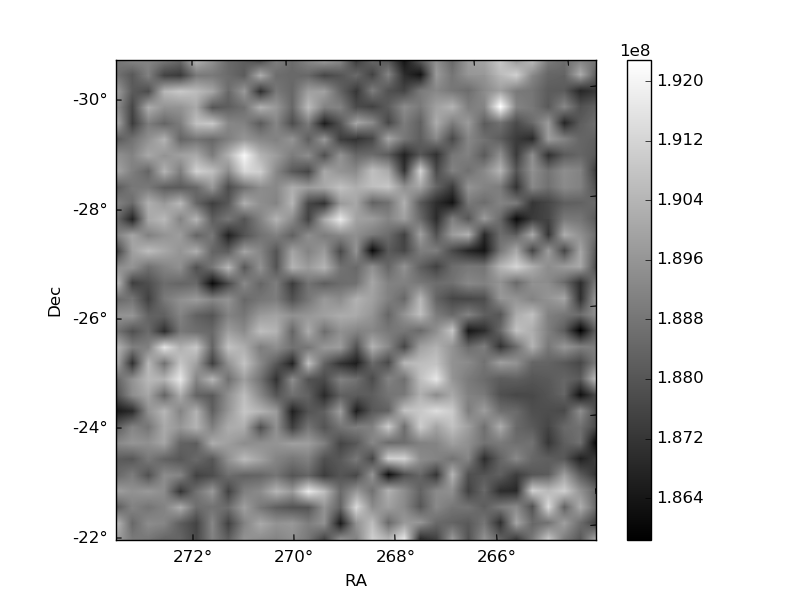
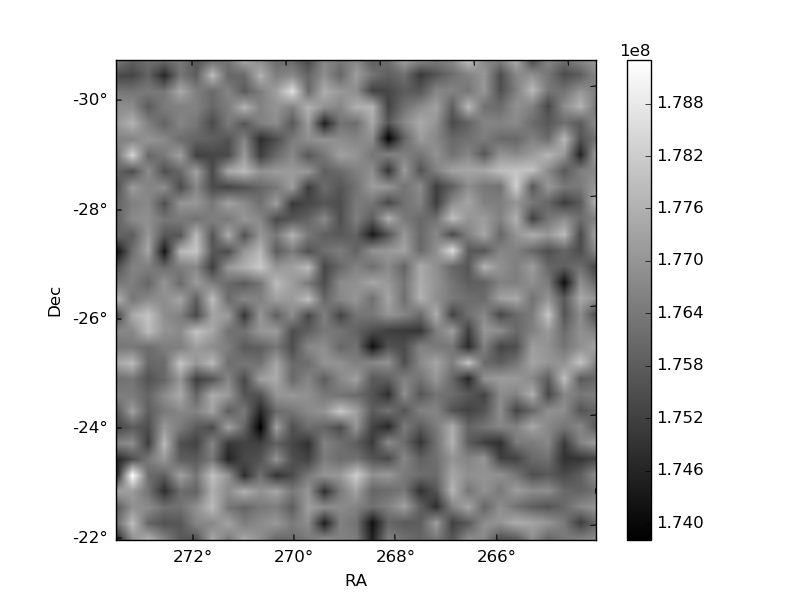
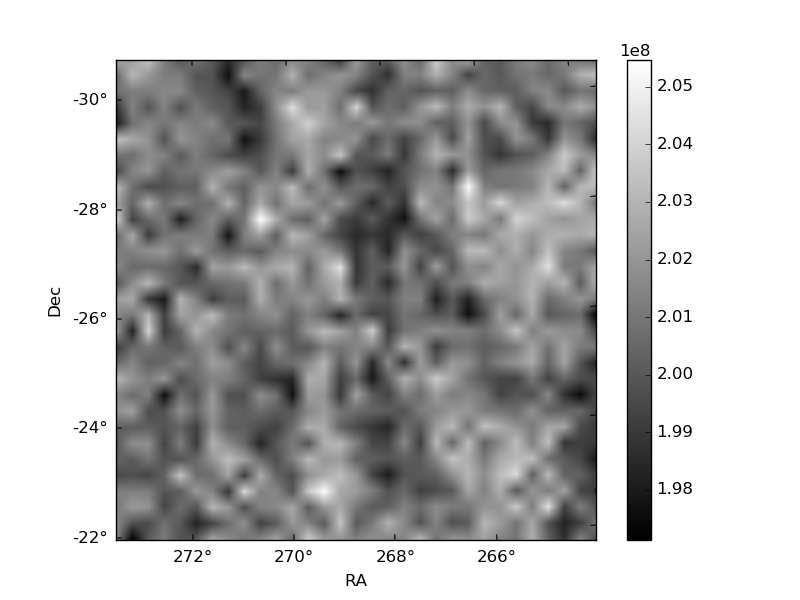
Histogram calculated using DETX and DETY for each event in the final _common_clean file
| Quadrant A | 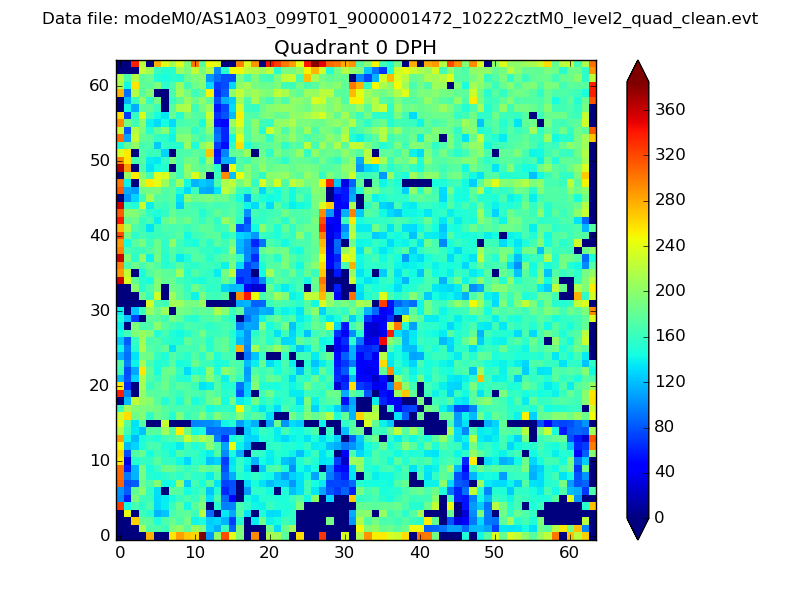 |
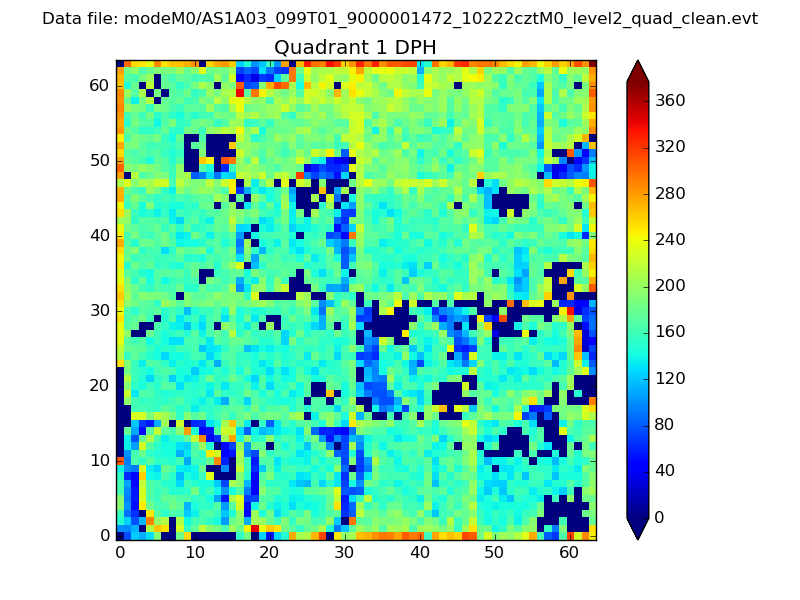 |
Quadrant B |
|---|---|---|---|
| Quadrant D | 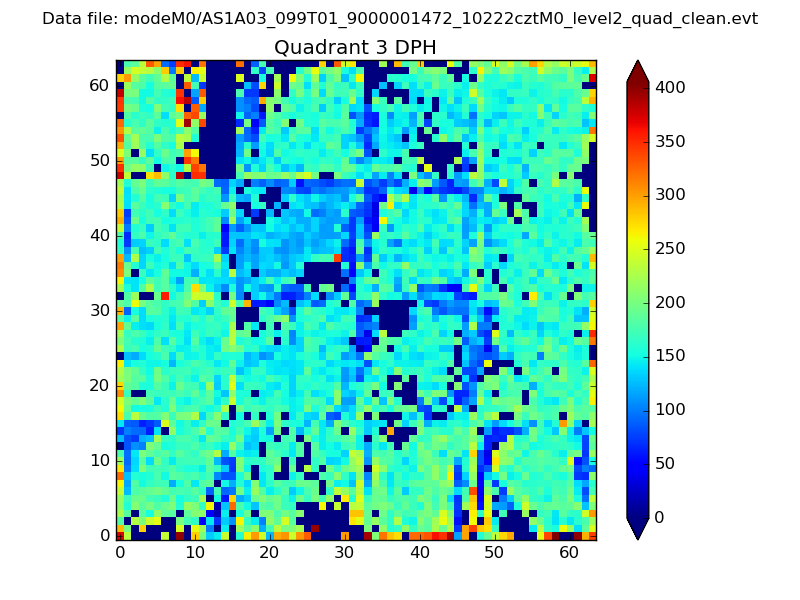 |
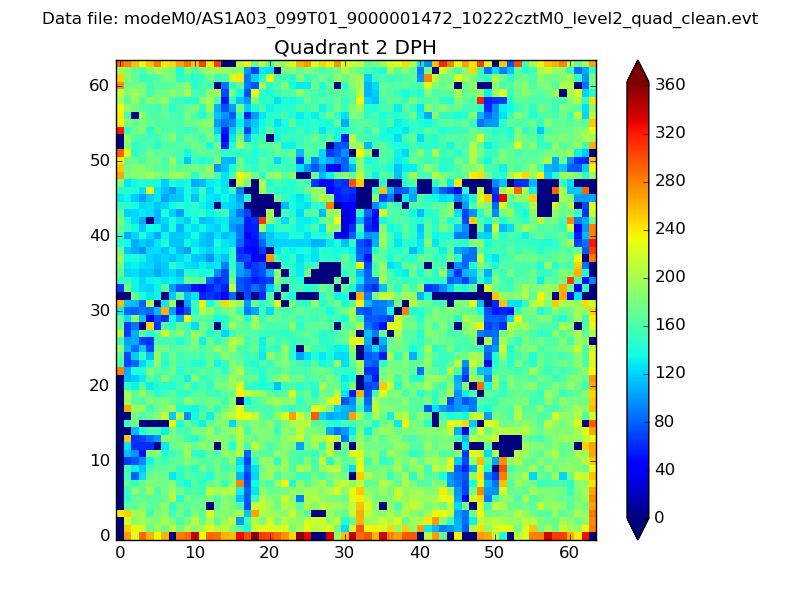 |
Quadrant C |
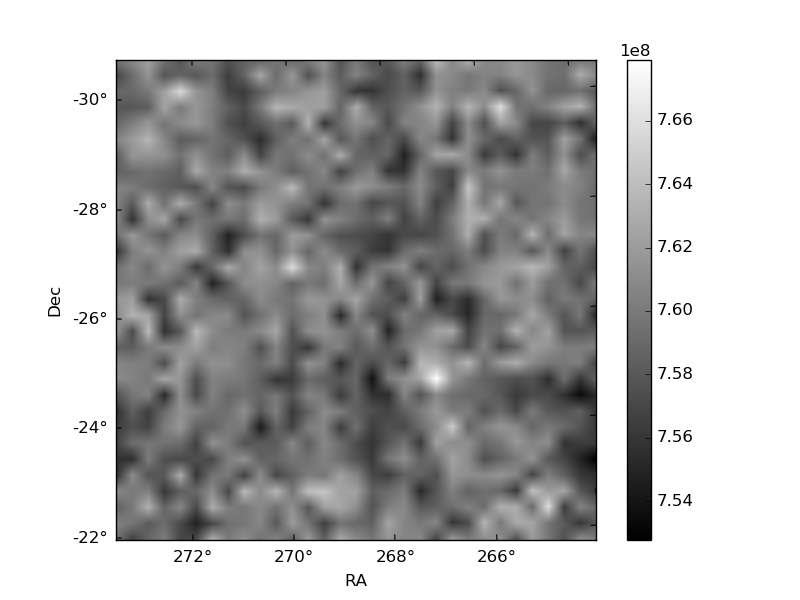
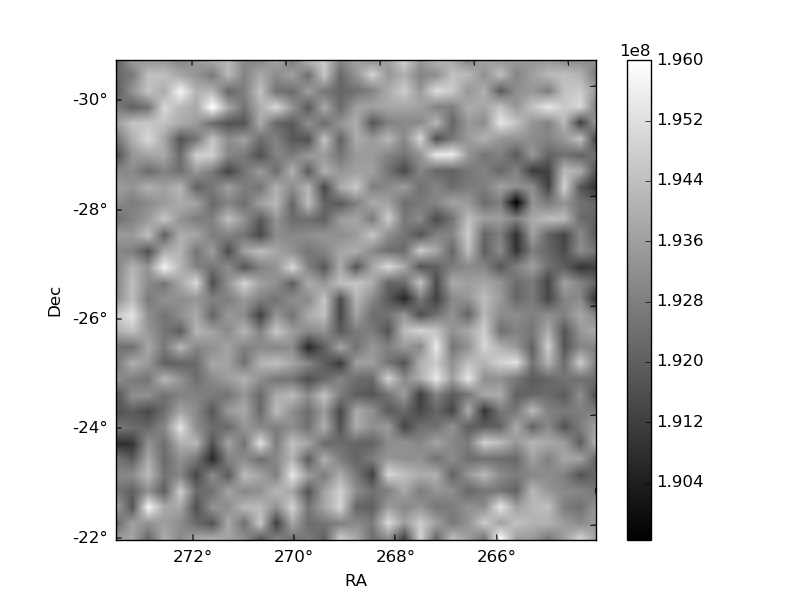
| Plot type | Count rate plots | Images |
|---|---|---|
| Comparison with Poisson distribution Blue bars denote a histogram of data divided into 1 sec bins. Red curve is a Poisson curve with rate = median count rate of data. |
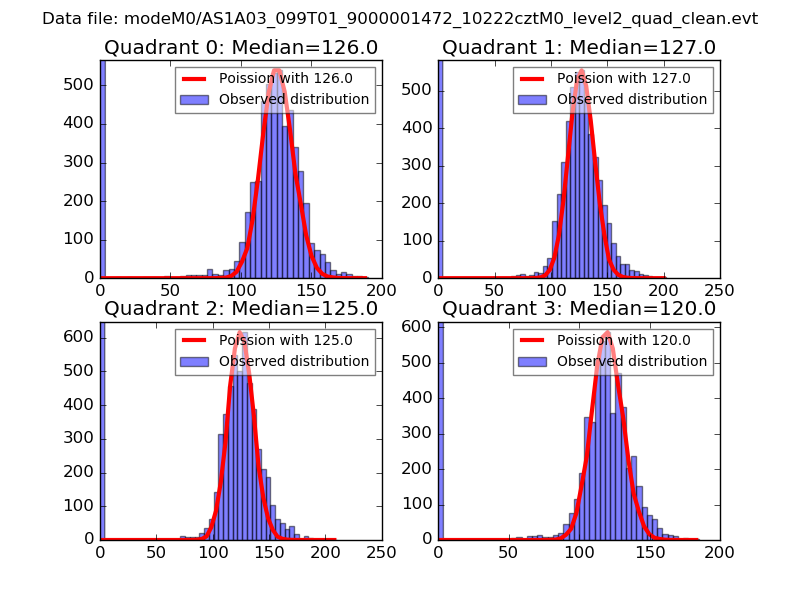 |
 |
| Quadrant-wise count rates Data is divided into 100 sec bins |
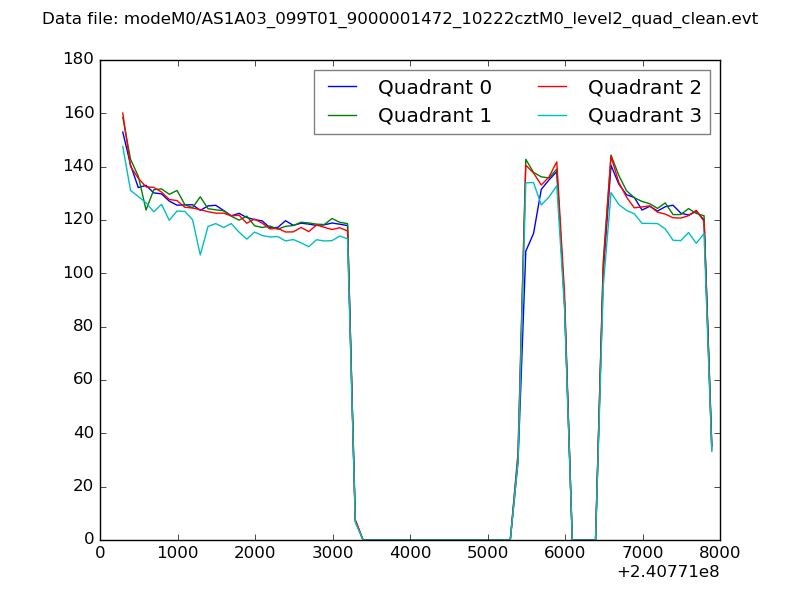 |
|
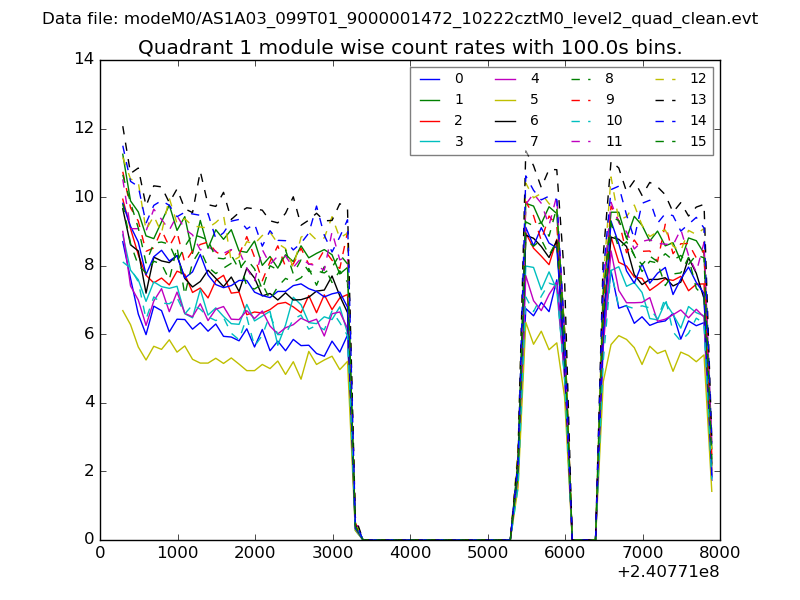
| Module-wise count rates for Quadrant A Data is divided into 100 sec bins |
 |
 |
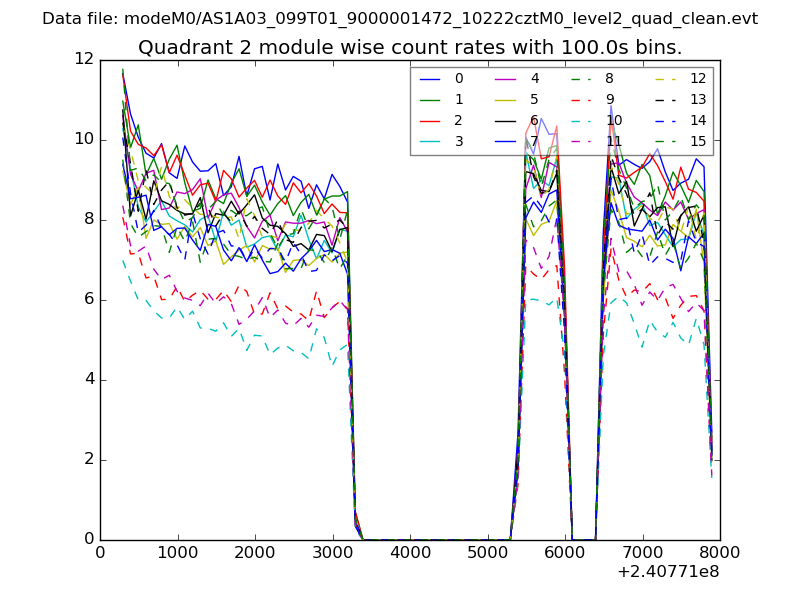
| Module-wise count rates for Quadrant B Data is divided into 100 sec bins |
 |
 |
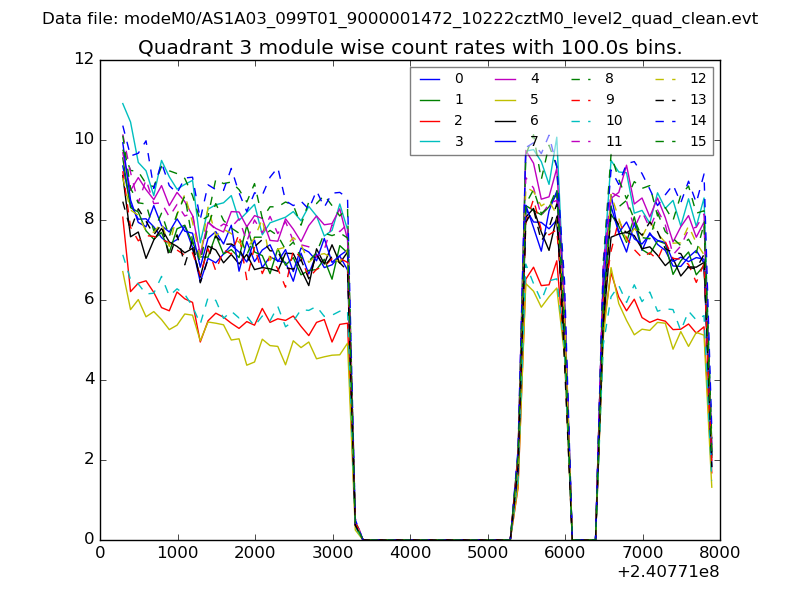
| Module-wise count rates for Quadrant C Data is divided into 100 sec bins |
 |
 |
| Module-wise count rates for Quadrant D Data is divided into 100 sec bins |
 |
 |
| Parameter | Plot |
|---|---|
| CZT HV Monitor | 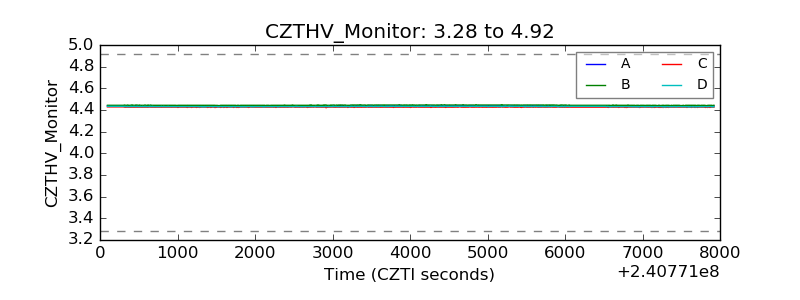 |
| D_VDD |  |
| Temperature 1 | 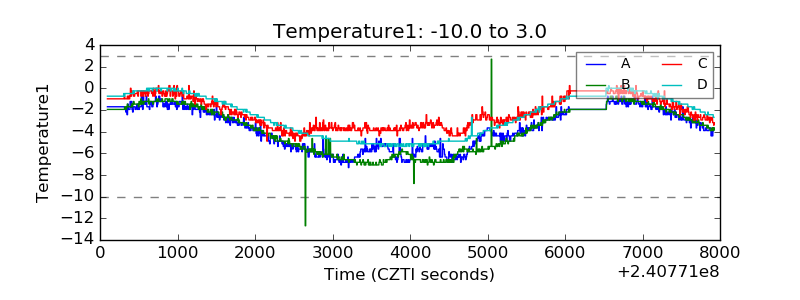 |
| Veto HV Monitor | 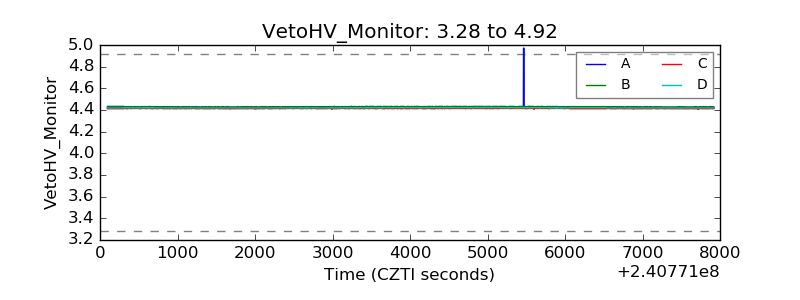 |
| Veto LLD |  |
| Alpha Counter | 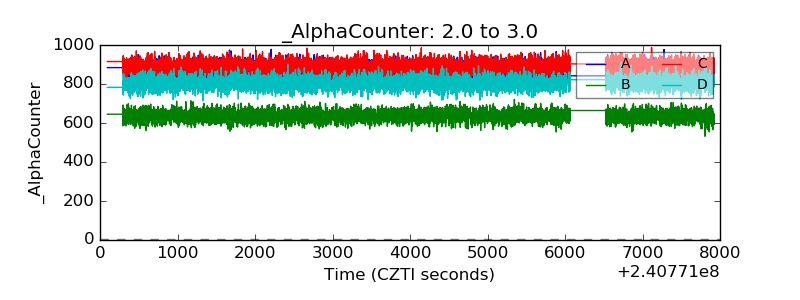 |
| _CPM_Rate | 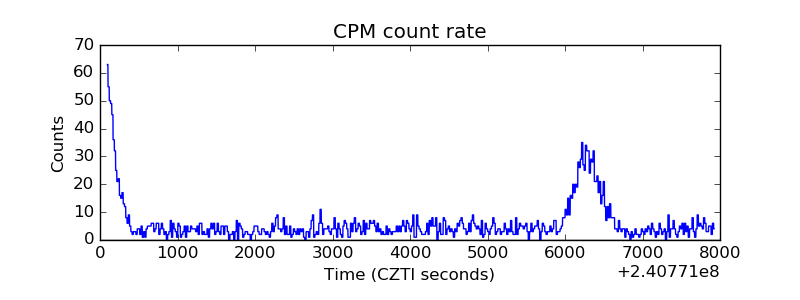 |
| CZT Counter | 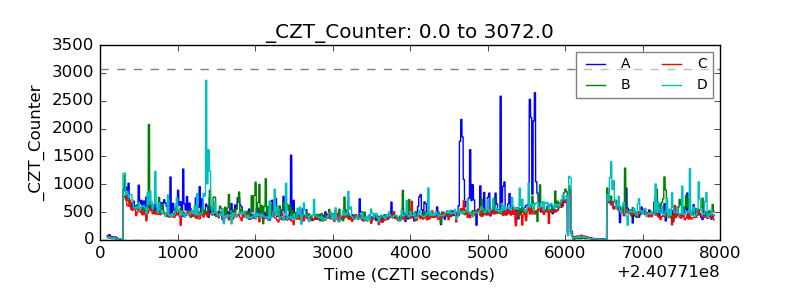 |
| +2.5 Volts monitor | 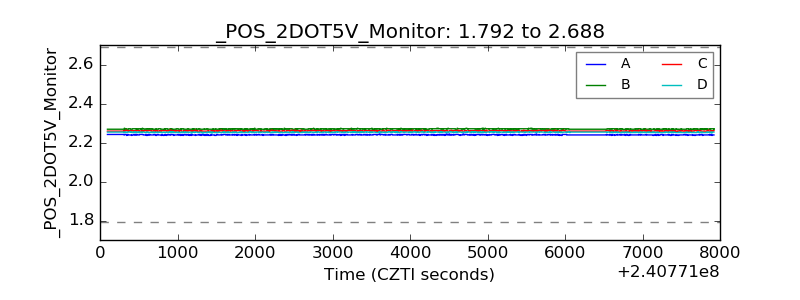 |
| +5 Volts monitor |  |
| _ROLL_ROT | 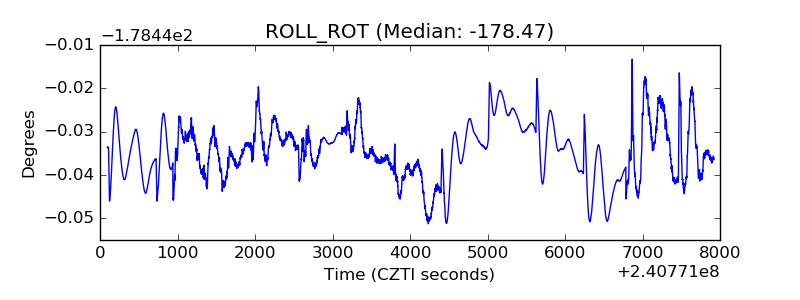 |
| _Roll_DEC | 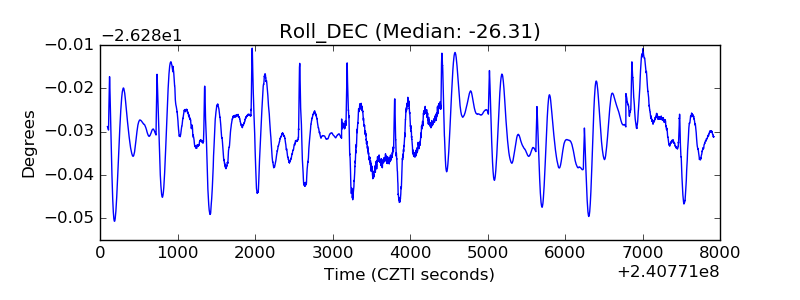 |
| _Roll_RA | 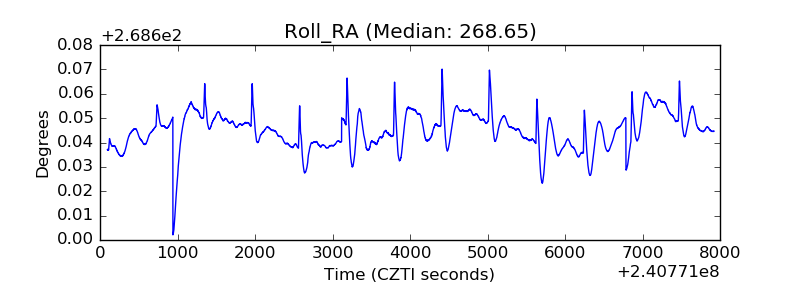 |
| Veto Counter | 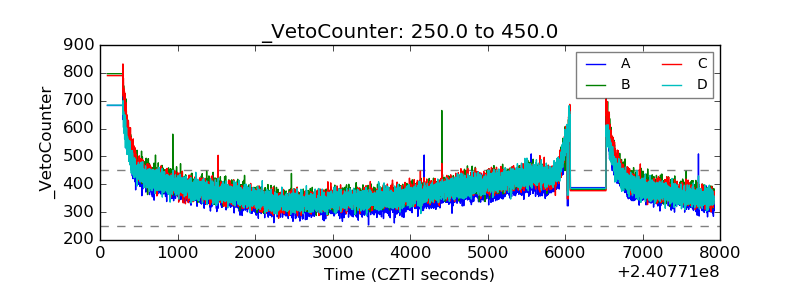 |