| Param | Original file | Final file |
|---|---|---|
| Filename | modeM0/AS1A03_099T01_9000001472_10227cztM0_level2.evt | modeM0/AS1A03_099T01_9000001472_10227cztM0_level2_quad_clean.evt |
| Size (bytes) | 1,993,593,600 | 355,412,160 |
| Size | 1.9 GB | 338.9 MB |
| Events in quadrant A | 14,054,945 | 2,184,386 |
| Events in quadrant B | 14,292,981 | 2,187,980 |
| Events in quadrant C | 12,769,161 | 2,216,867 |
| Events in quadrant D | 17,311,536 | 2,195,440 |
| Mode M0 | |||
|---|---|---|---|
| Quadrant | BADHDUFLAG | Total packets | Discarded packets |
| A | 0 | 93980 | 33035 |
| B | 0 | 96834 | 35443 |
| C | 0 | 90002 | 31788 |
| D | 0 | 104805 | 33488 |
| Mode SS | |||
|---|---|---|---|
| Quadrant | BADHDUFLAG | Total packets | Discarded packets |
| A | 0 | 904 | 301 |
| B | 0 | 904 | 299 |
| C | 0 | 904 | 295 |
| D | 0 | 876 | 276 |
| Mode M9 | |||
|---|---|---|---|
| Quadrant | BADHDUFLAG | Total packets | Discarded packets |
| A | 0 | 45 | 13 |
| B | 0 | 48 | 16 |
| C | 0 | 48 | 16 |
| D | 0 | 46 | 14 |
| Quadrant | Total seconds | Saturated seconds | Saturation percentage |
|---|---|---|---|
| A | 28324 | 242 | 0.854399% |
| B | 28269 | 249 | 0.880824% |
| C | 28638 | 50 | 0.174593% |
| D | 29992 | 348 | 1.160309% |
Noise dominated data is calculated using 1-second bins in cleaned event files. If a bin has >2000 counts, and if more than 50% of those come from <1% of pixels, then it is considered to be noise-dominated and hence unusable.
| Quadrant | # 1 sec bins | Bins with >0 counts | Bins with >2000 counts | High rate bins dominated by noise | Noise dominated (total time) | Noise dominated (detector-on time) | Marked lightcurve |
|---|---|---|---|---|---|---|---|
| A | 33956 | 30317 | 79 | 79 | 0.23% | 0.26% | 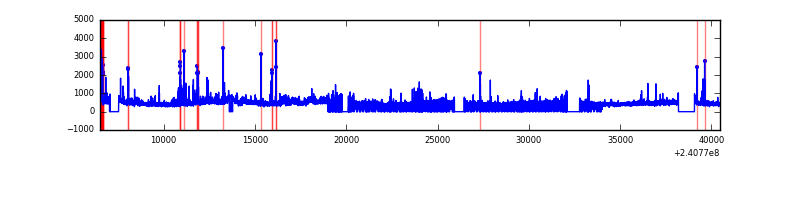 |
| B | 33956 | 30271 | 67 | 67 | 0.20% | 0.22% | 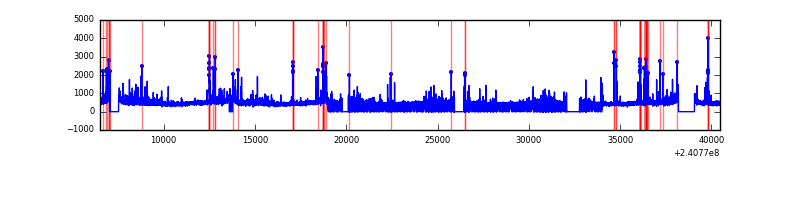 |
| C | 33956 | 30479 | 0 | 0 | 0.00% | 0.00% | 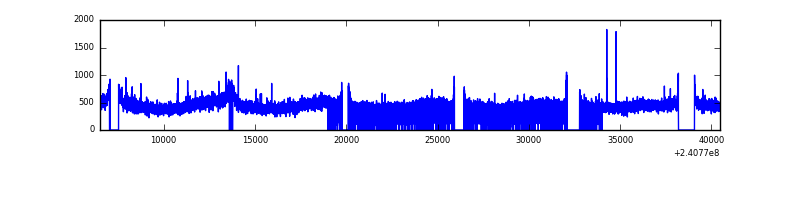 |
| D | 33956 | 30642 | 284 | 284 | 0.84% | 0.93% | 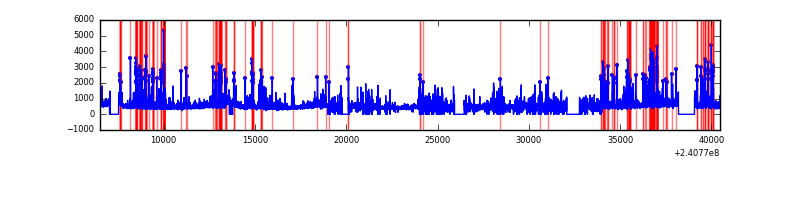 |
Top three noisy pixels from each quadrant. If the there are fewer than three noisy pixels in the level2.evt file, extra rows are filled as -1
| Pixel properties | Quadrant properties | ||||||
|---|---|---|---|---|---|---|---|
| Quadrant | DetID | PixID | Counts | Sigma | Mean | Median | Sigma |
| A | 8 | 15 | 618832 | 921.59 | 3307 | 3234 | 668.0 |
| A | 15 | 223 | 426702 | 633.96 | 3307 | 3234 | 668.0 |
| A | 15 | 239 | 193646 | 285.06 | 3307 | 3234 | 668.0 |
| B | 4 | 239 | 506967 | 798.92 | 3320 | 3242 | 630.5 |
| B | 0 | 214 | 250467 | 392.1 | 3320 | 3242 | 630.5 |
| B | 11 | 51 | 215279 | 336.29 | 3320 | 3242 | 630.5 |
| C | 0 | 207 | 59762 | 75.32 | 3246 | 3260 | 750.1 |
| C | 14 | 67 | 29151 | 34.51 | 3246 | 3260 | 750.1 |
| C | 13 | 61 | 24717 | 28.6 | 3246 | 3260 | 750.1 |
| D | 1 | 52 | 2479816 | 3060.4 | 3368 | 3270 | 809.2 |
| D | 8 | 195 | 1364743 | 1682.45 | 3368 | 3270 | 809.2 |
| D | 7 | 71 | 238572 | 290.78 | 3368 | 3270 | 809.2 |
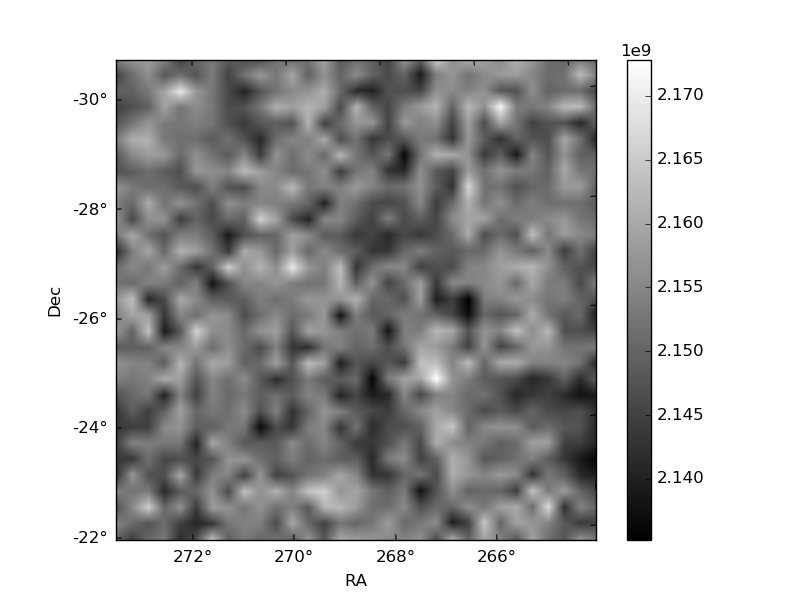
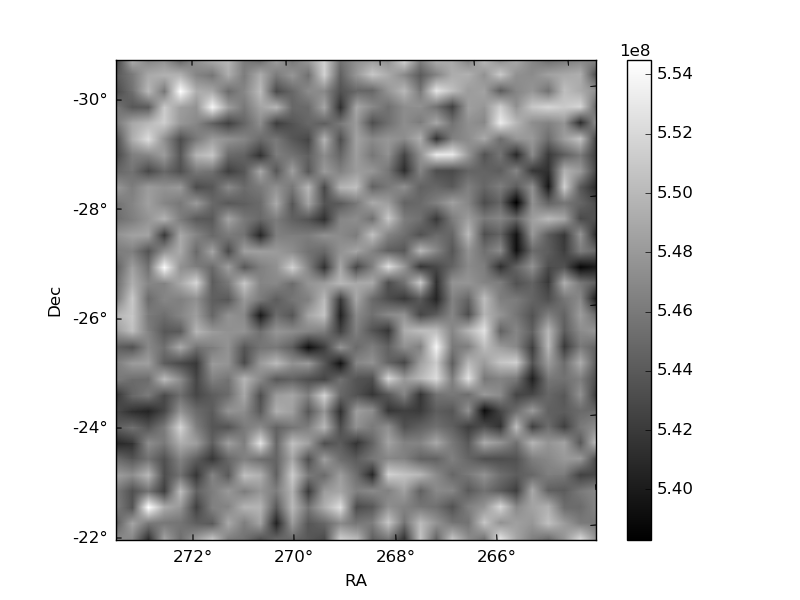
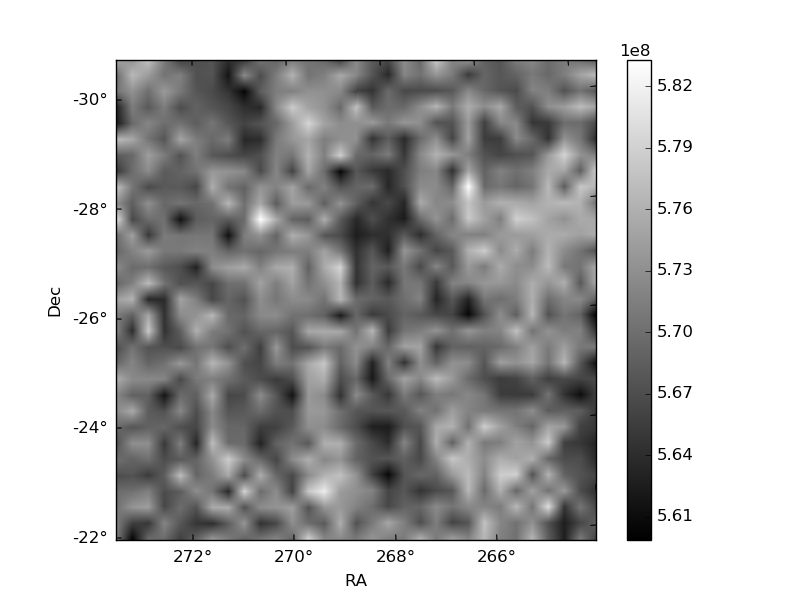
Histogram calculated using DETX and DETY for each event in the final _common_clean file
| Quadrant A | 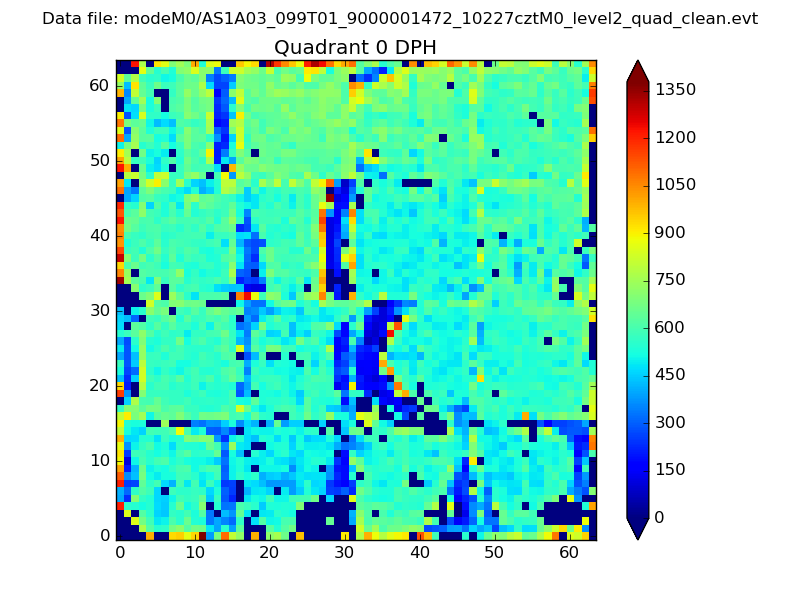 |
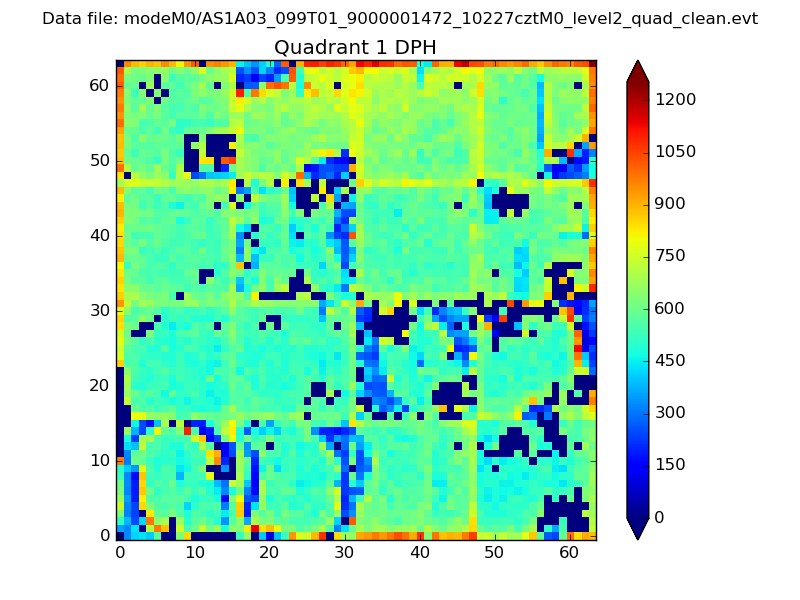 |
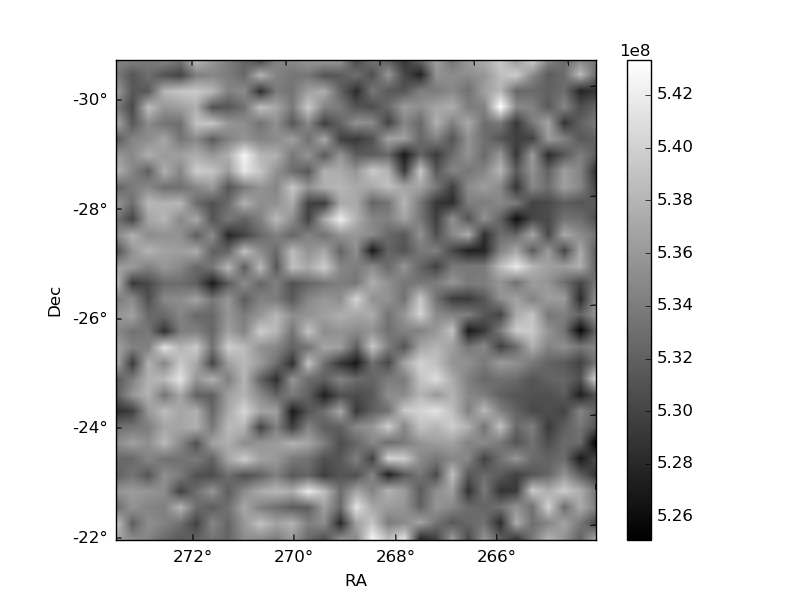
Quadrant B |
|---|---|---|---|
| Quadrant D | 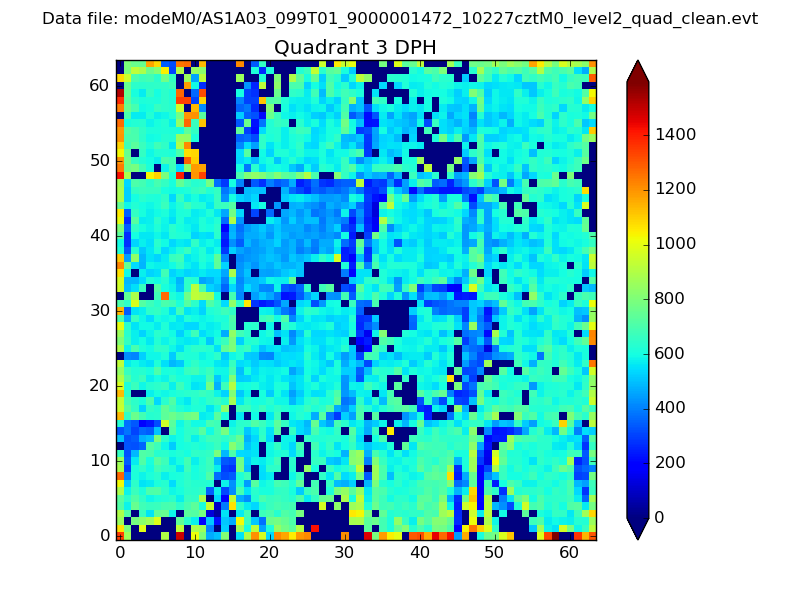 |
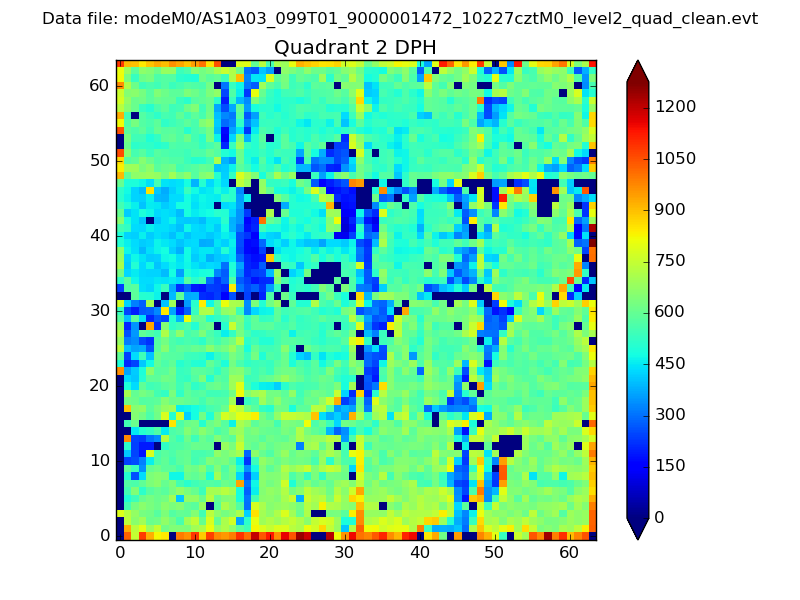 |
Quadrant C |
| Plot type | Count rate plots | Images |
|---|---|---|
| Comparison with Poisson distribution Blue bars denote a histogram of data divided into 1 sec bins. Red curve is a Poisson curve with rate = median count rate of data. |
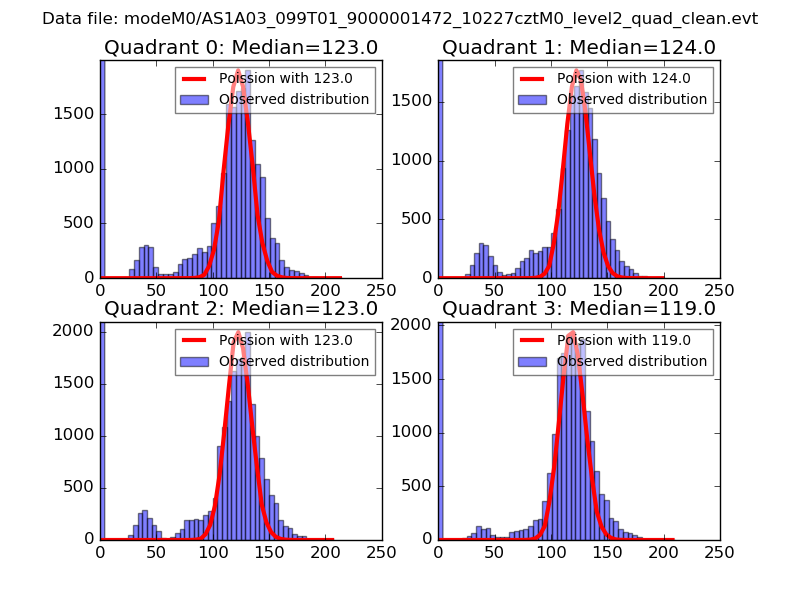 |
 |
| Quadrant-wise count rates Data is divided into 100 sec bins |
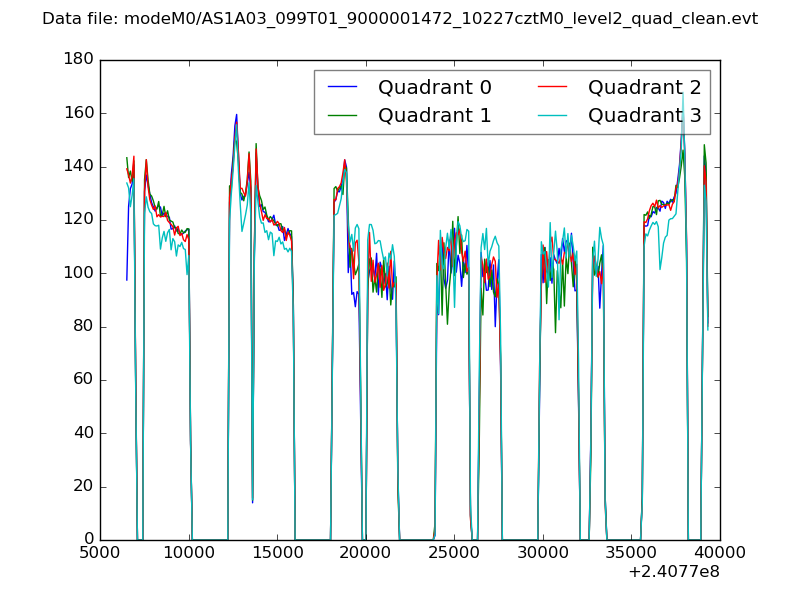 |
|
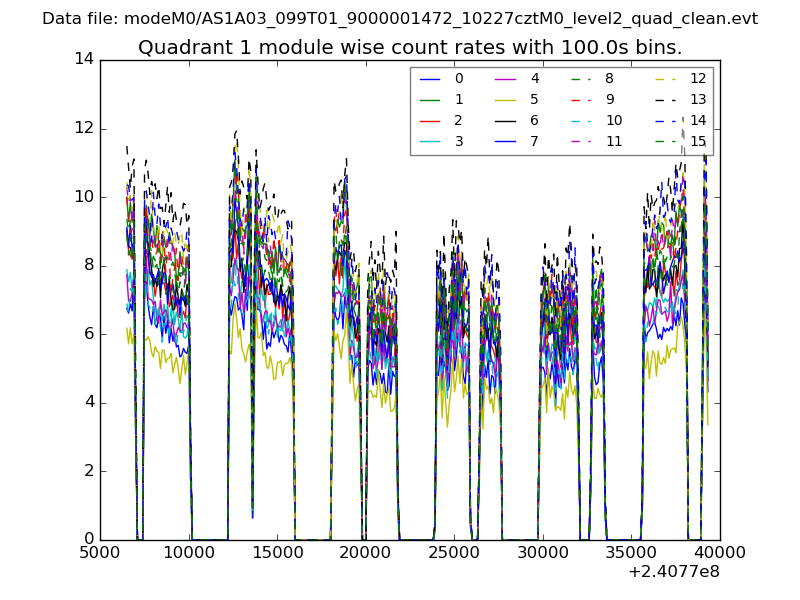
| Module-wise count rates for Quadrant A Data is divided into 100 sec bins |
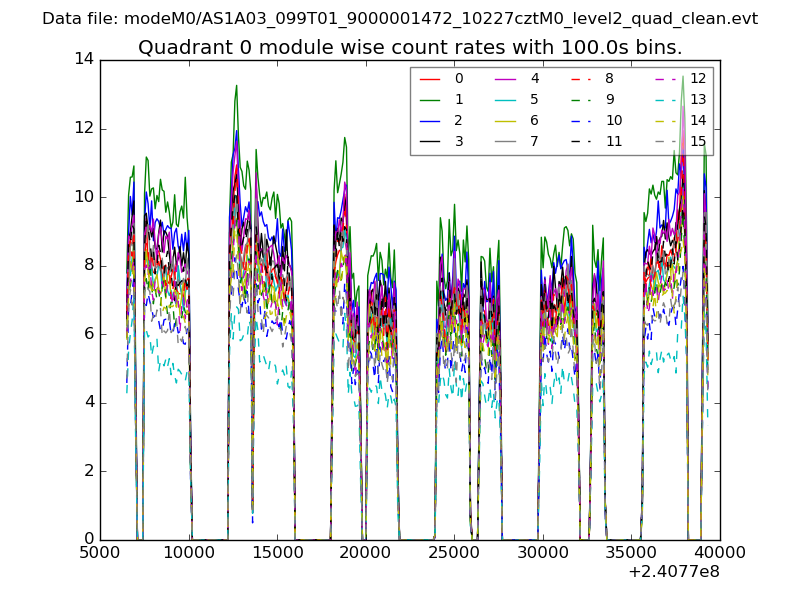 |
 |
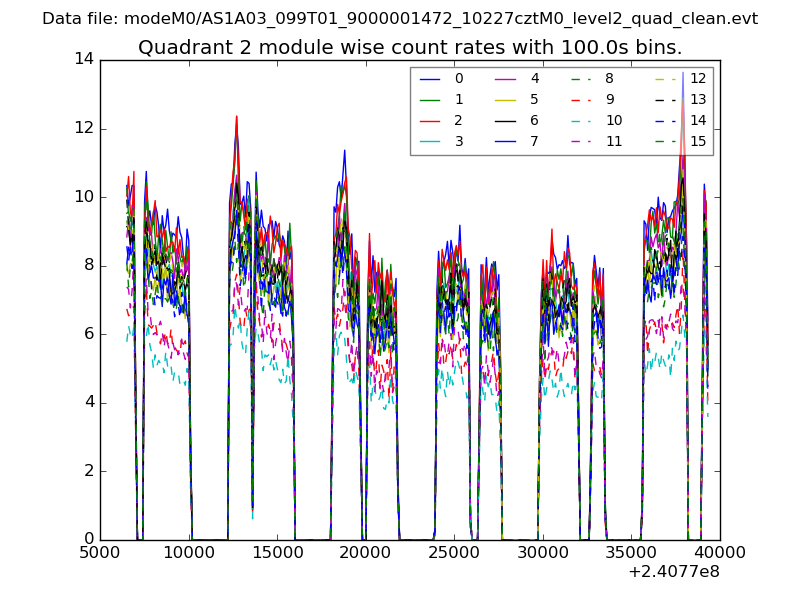
| Module-wise count rates for Quadrant B Data is divided into 100 sec bins |
 |
 |
| Module-wise count rates for Quadrant C Data is divided into 100 sec bins |
 |
 |
| Module-wise count rates for Quadrant D Data is divided into 100 sec bins |
 |
 |
| Parameter | Plot |
|---|---|
| CZT HV Monitor | 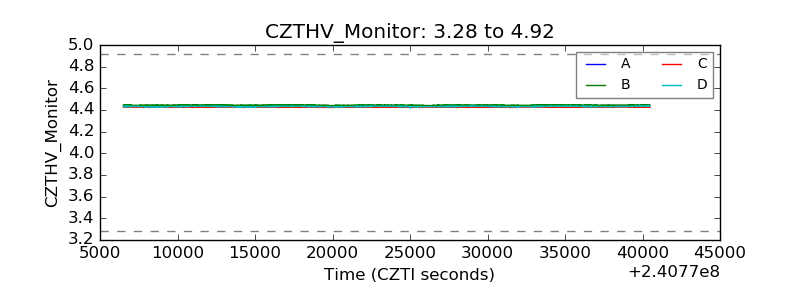 |
| D_VDD | 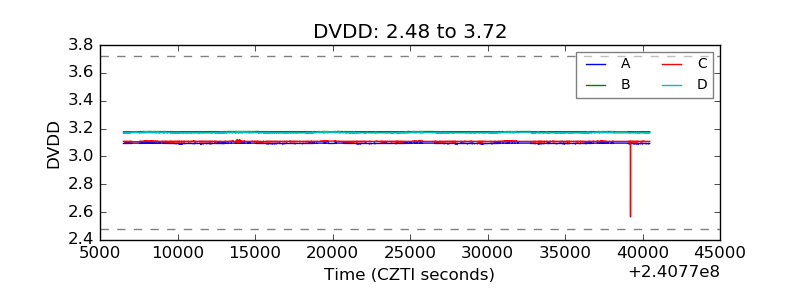 |
| Temperature 1 | 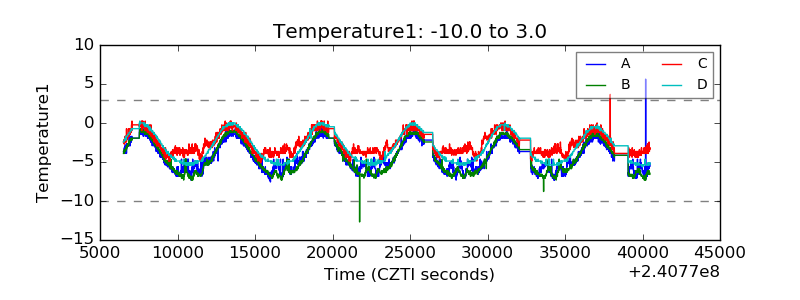 |
| Veto HV Monitor | 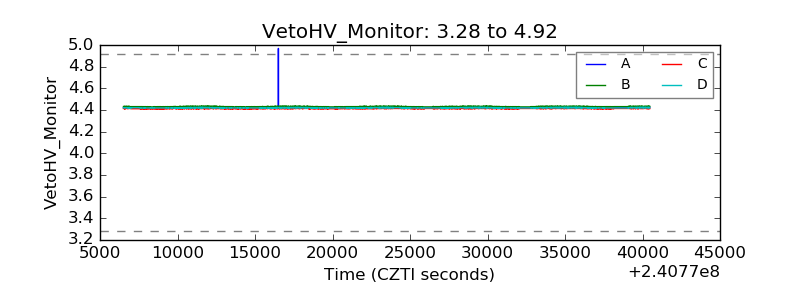 |
| Veto LLD | 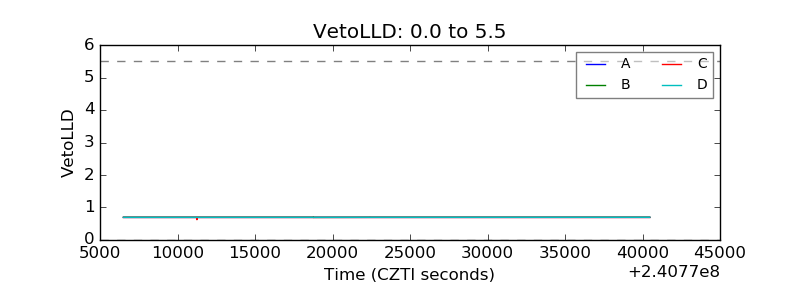 |
| Alpha Counter | 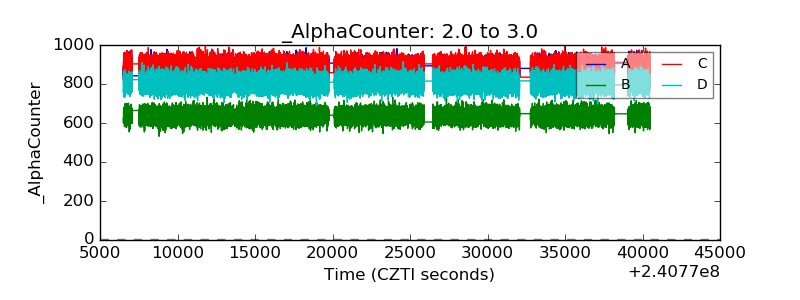 |
| _CPM_Rate | 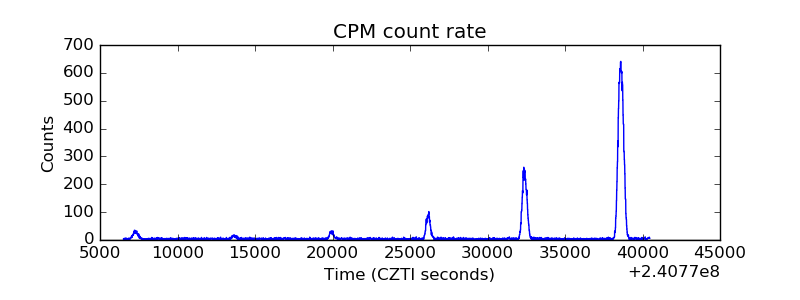 |
| CZT Counter | 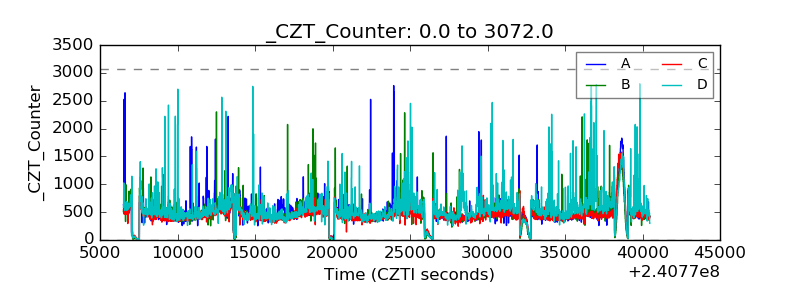 |
| +2.5 Volts monitor |  |
| +5 Volts monitor |  |
| _ROLL_ROT | 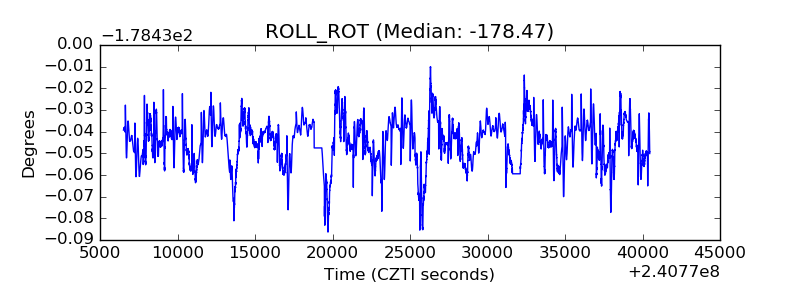 |
| _Roll_DEC |  |
| _Roll_RA | 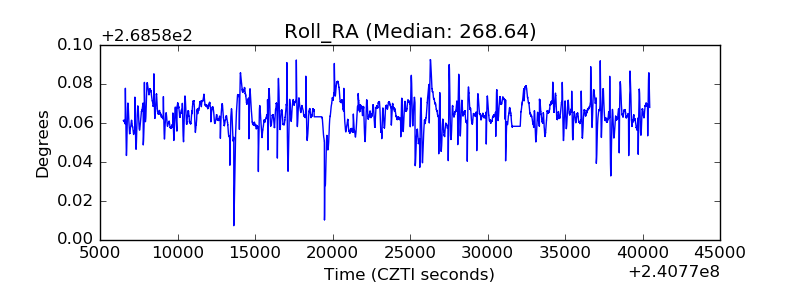 |
| Veto Counter |  |