| Param | Original file | Final file |
|---|---|---|
| Filename | modeM0/AS1A03_099T01_9000001472_10230cztM0_level2.evt | modeM0/AS1A03_099T01_9000001472_10230cztM0_level2_quad_clean.evt |
| Size (bytes) | 502,024,320 | 69,845,760 |
| Size | 478.8 MB | 66.6 MB |
| Events in quadrant A | 3,380,187 | 420,795 |
| Events in quadrant B | 3,372,782 | 435,363 |
| Events in quadrant C | 3,012,838 | 432,628 |
| Events in quadrant D | 5,013,793 | 389,381 |
| Mode M0 | |||
|---|---|---|---|
| Quadrant | BADHDUFLAG | Total packets | Discarded packets |
| A | 0 | 14069 | 2 |
| B | 0 | 14004 | 3 |
| C | 0 | 13124 | 3 |
| D | 0 | 19101 | 22 |
| Mode SS | |||
|---|---|---|---|
| Quadrant | BADHDUFLAG | Total packets | Discarded packets |
| A | 0 | 126 | 0 |
| B | 0 | 126 | 0 |
| C | 0 | 126 | 0 |
| D | 0 | 126 | 0 |
| Mode M9 | |||
|---|---|---|---|
| Quadrant | BADHDUFLAG | Total packets | Discarded packets |
| A | 0 | 12 | 0 |
| B | 0 | 12 | 0 |
| C | 0 | 12 | 0 |
| D | 0 | 12 | 0 |
| Quadrant | Total seconds | Saturated seconds | Saturation percentage |
|---|---|---|---|
| A | 6260 | 97 | 1.549521% |
| B | 6259 | 61 | 0.974597% |
| C | 6259 | 29 | 0.463333% |
| D | 6255 | 362 | 5.787370% |
Noise dominated data is calculated using 1-second bins in cleaned event files. If a bin has >2000 counts, and if more than 50% of those come from <1% of pixels, then it is considered to be noise-dominated and hence unusable.
| Quadrant | # 1 sec bins | Bins with >0 counts | Bins with >2000 counts | High rate bins dominated by noise | Noise dominated (total time) | Noise dominated (detector-on time) | Marked lightcurve |
|---|---|---|---|---|---|---|---|
| A | 7410 | 6260 | 49 | 49 | 0.66% | 0.78% | 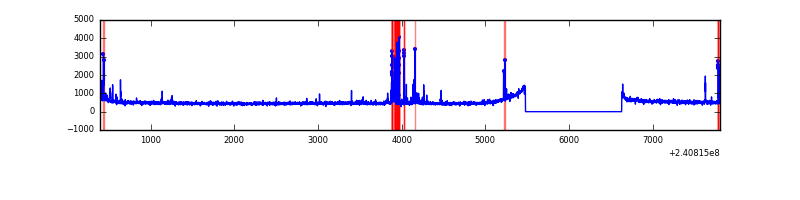 |
| B | 7410 | 6260 | 17 | 17 | 0.23% | 0.27% | 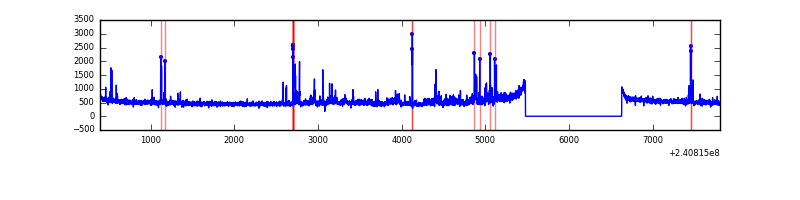 |
| C | 7410 | 6261 | 1 | 1 | 0.01% | 0.02% | 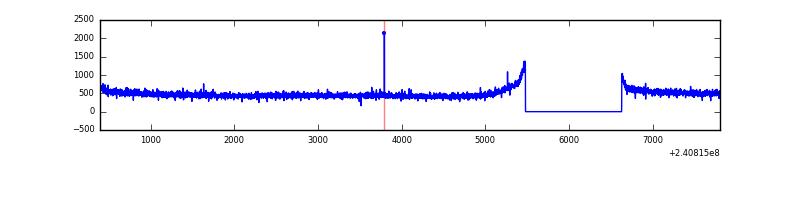 |
| D | 7410 | 6259 | 304 | 304 | 4.10% | 4.86% | 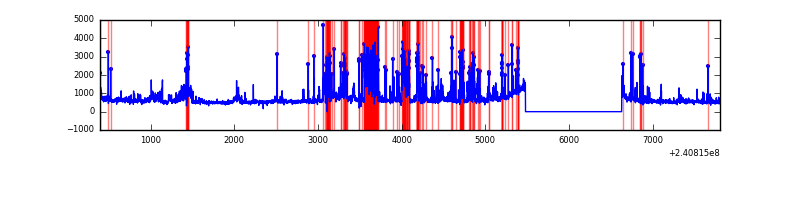 |
Top three noisy pixels from each quadrant. If the there are fewer than three noisy pixels in the level2.evt file, extra rows are filled as -1
| Pixel properties | Quadrant properties | ||||||
|---|---|---|---|---|---|---|---|
| Quadrant | DetID | PixID | Counts | Sigma | Mean | Median | Sigma |
| A | 15 | 223 | 178458 | 1092.08 | 800 | 788 | 162.7 |
| A | 15 | 239 | 76740 | 466.85 | 800 | 788 | 162.7 |
| A | 8 | 15 | 21152 | 125.17 | 800 | 788 | 162.7 |
| B | 4 | 239 | 119818 | 801.44 | 788 | 772 | 148.5 |
| B | 11 | 51 | 59860 | 397.79 | 788 | 772 | 148.5 |
| B | 10 | 224 | 48816 | 323.44 | 788 | 772 | 148.5 |
| C | 13 | 61 | 5810 | 27.92 | 770 | 775 | 180.3 |
| C | 0 | 207 | 4515 | 20.74 | 770 | 775 | 180.3 |
| C | 14 | 67 | 4444 | 20.35 | 770 | 775 | 180.3 |
| D | 1 | 52 | 1482529 | 8112.6 | 758 | 739 | 182.7 |
| D | 8 | 195 | 503045 | 2750.05 | 758 | 739 | 182.7 |
| D | 2 | 16 | 34351 | 184.02 | 758 | 739 | 182.7 |
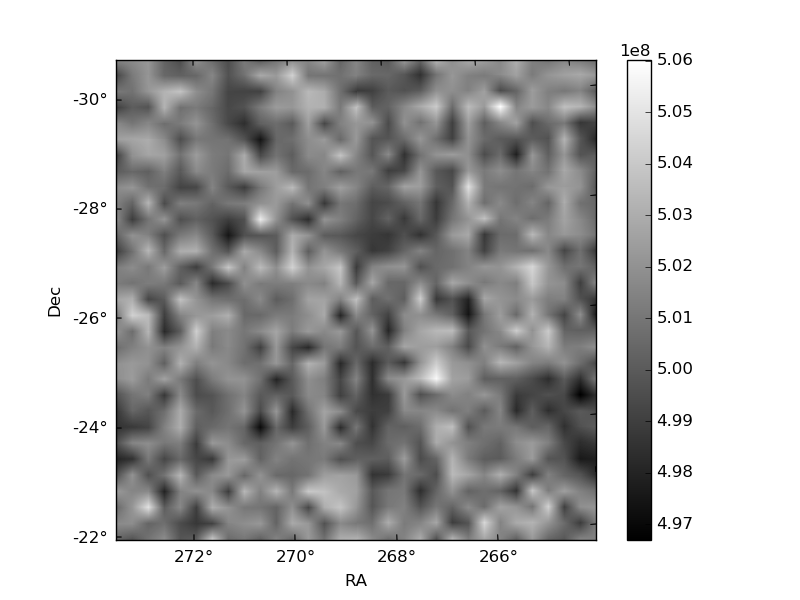
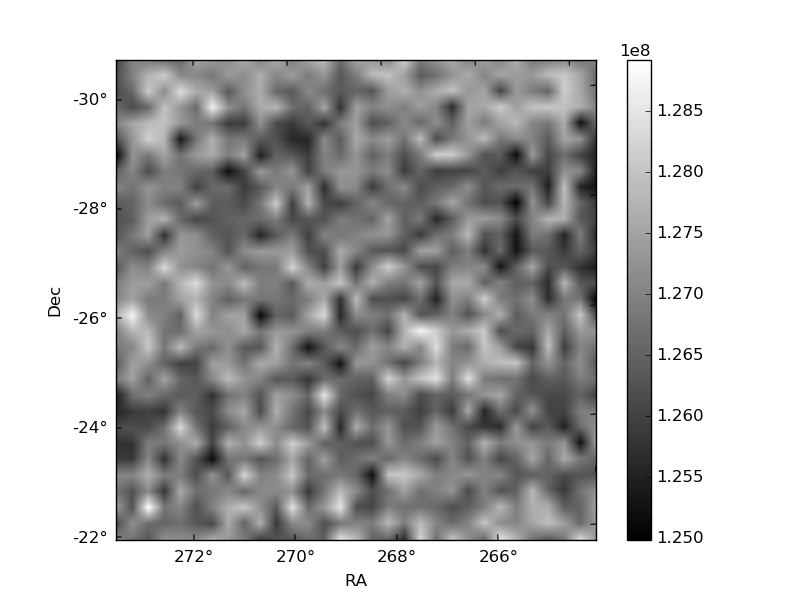
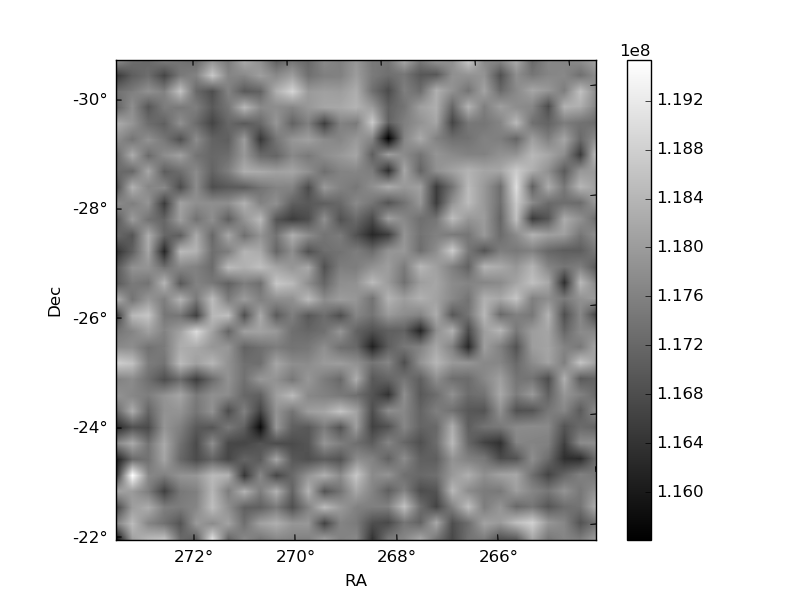
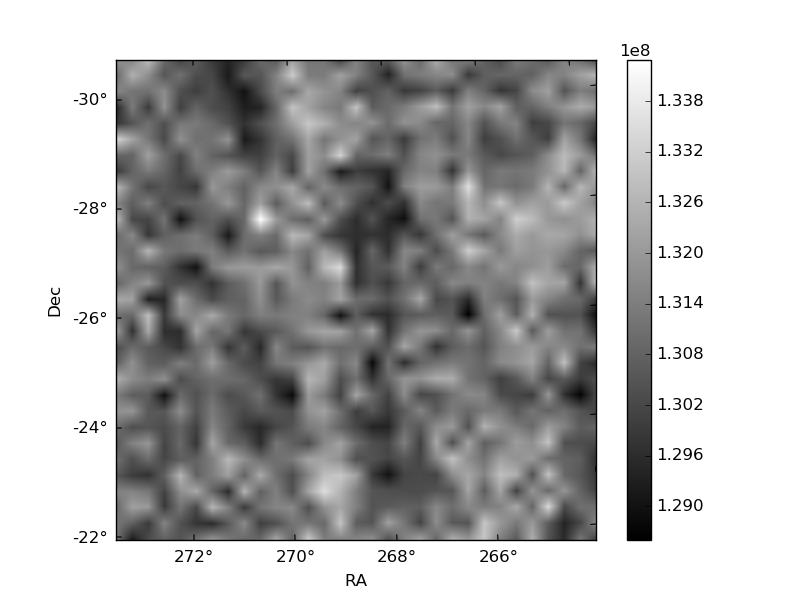
Histogram calculated using DETX and DETY for each event in the final _common_clean file
| Quadrant A | 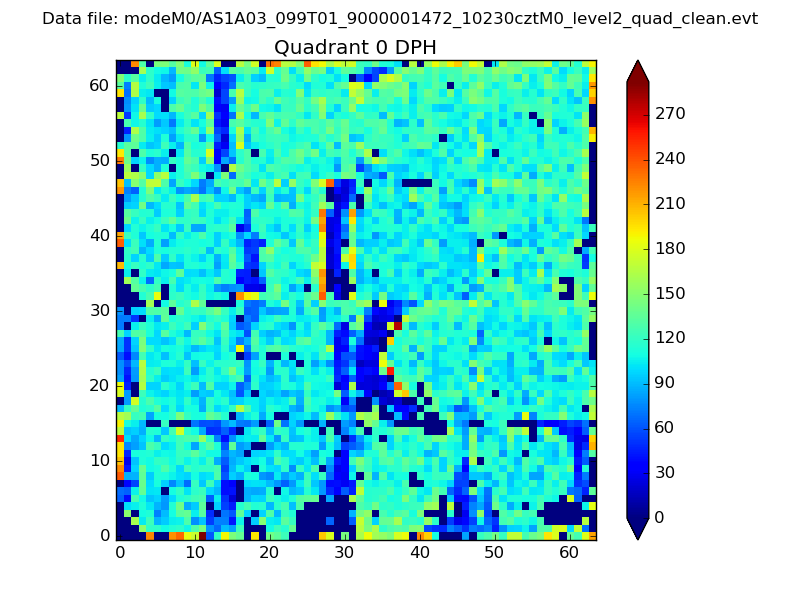 |
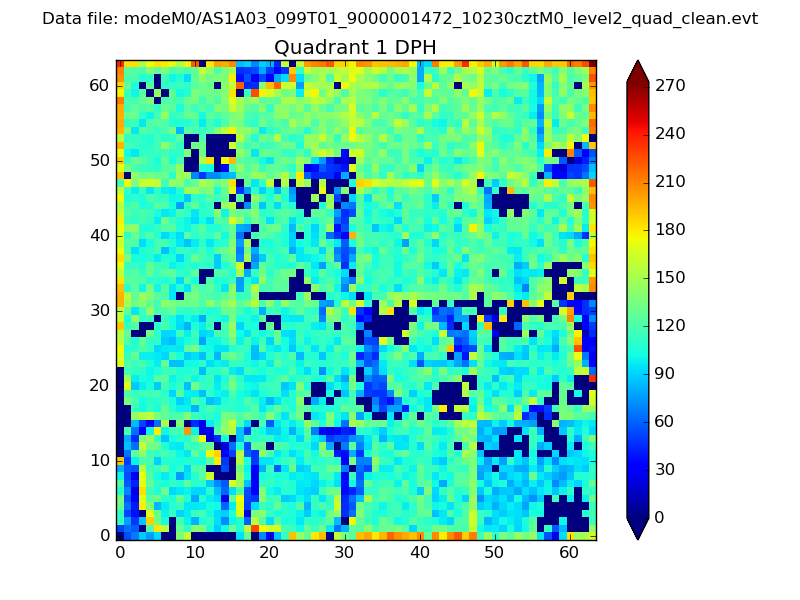 |
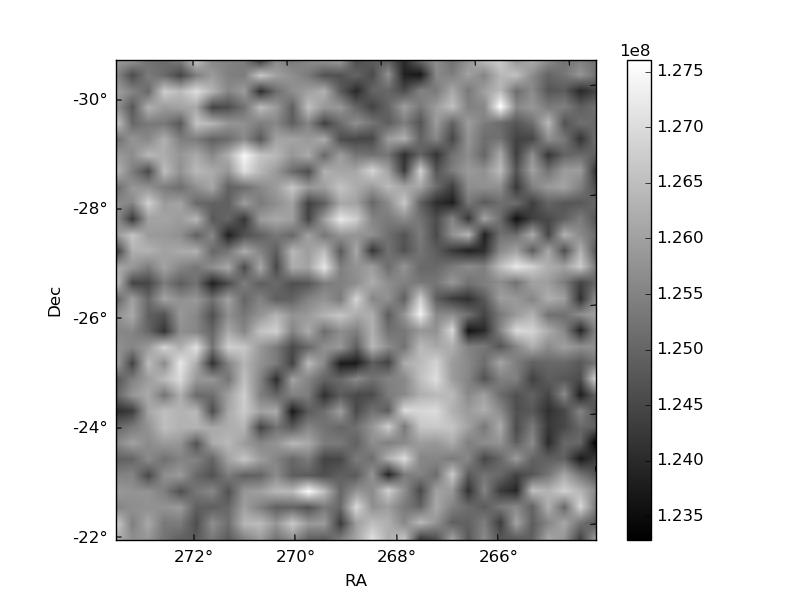
Quadrant B |
|---|---|---|---|
| Quadrant D | 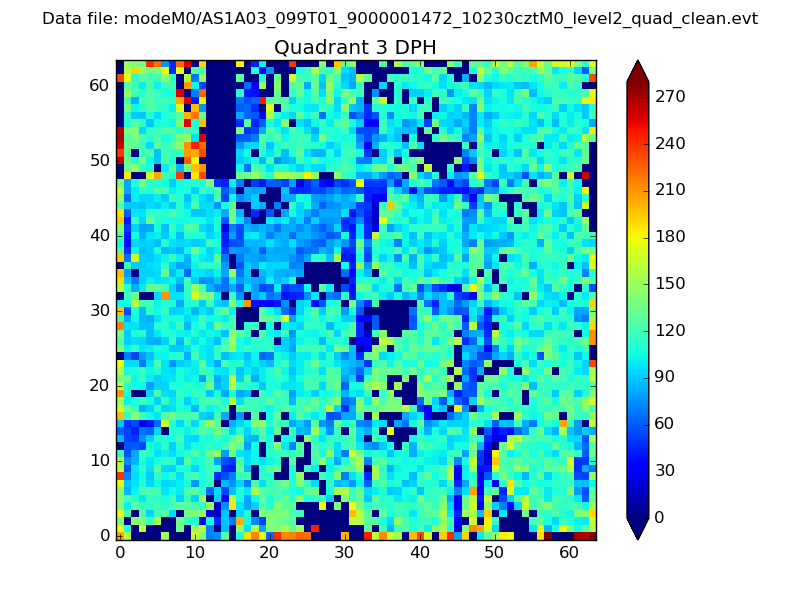 |
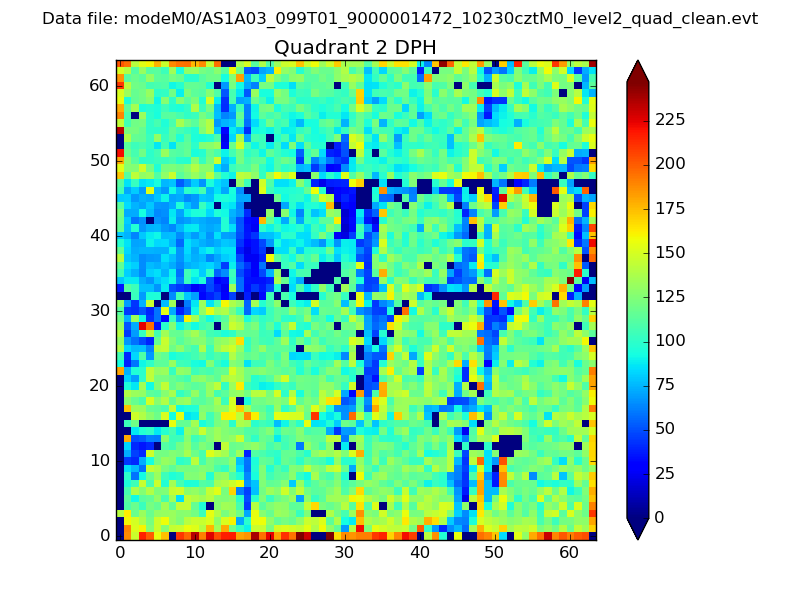 |
Quadrant C |
| Plot type | Count rate plots | Images |
|---|---|---|
| Comparison with Poisson distribution Blue bars denote a histogram of data divided into 1 sec bins. Red curve is a Poisson curve with rate = median count rate of data. |
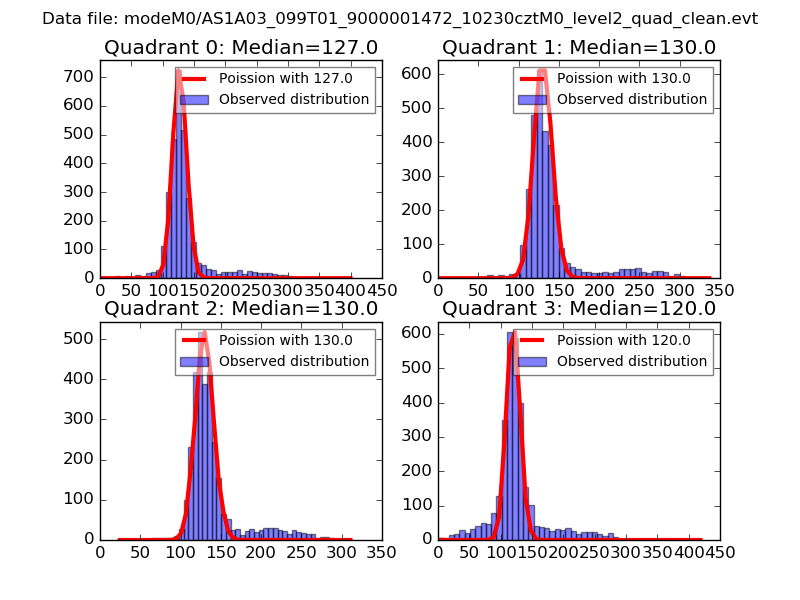 |
 |
| Quadrant-wise count rates Data is divided into 100 sec bins |
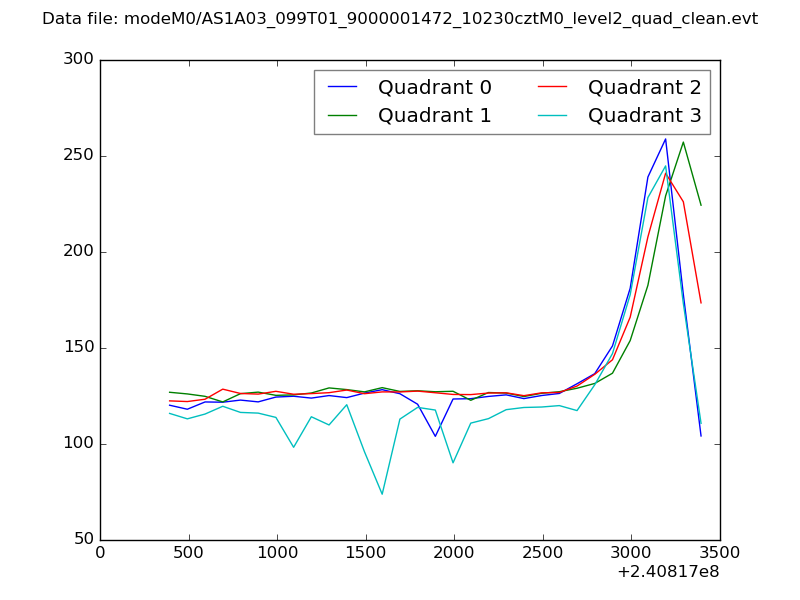 |
|
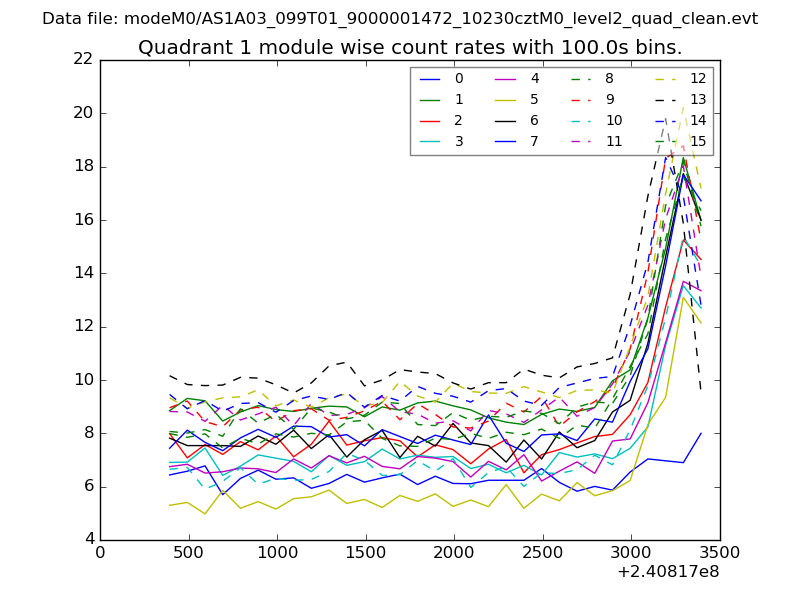
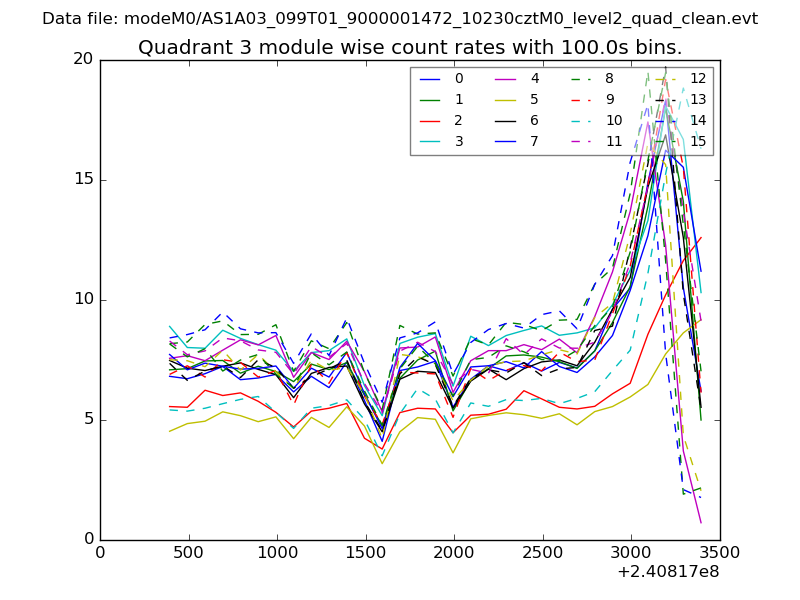
| Module-wise count rates for Quadrant A Data is divided into 100 sec bins |
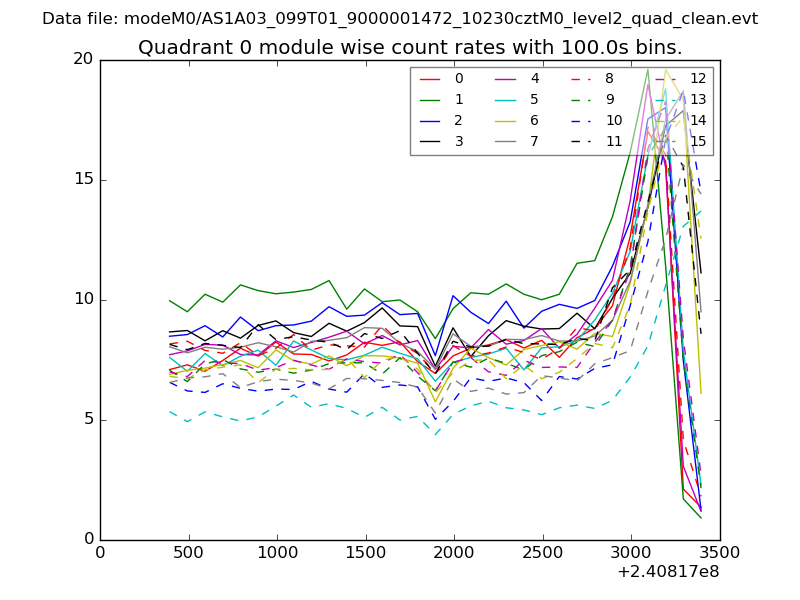 |
 |
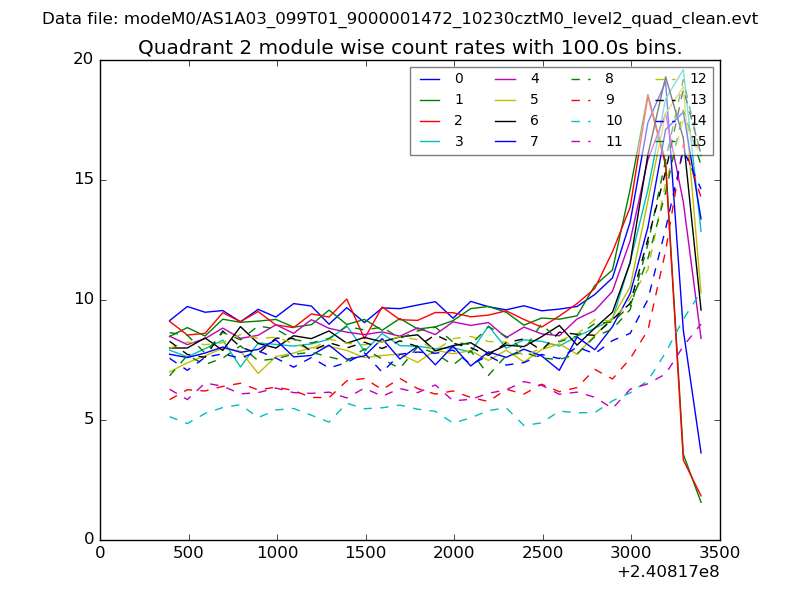
| Module-wise count rates for Quadrant B Data is divided into 100 sec bins |
 |
 |
| Module-wise count rates for Quadrant C Data is divided into 100 sec bins |
 |
 |
| Module-wise count rates for Quadrant D Data is divided into 100 sec bins |
 |
 |
| Parameter | Plot |
|---|---|
| CZT HV Monitor | 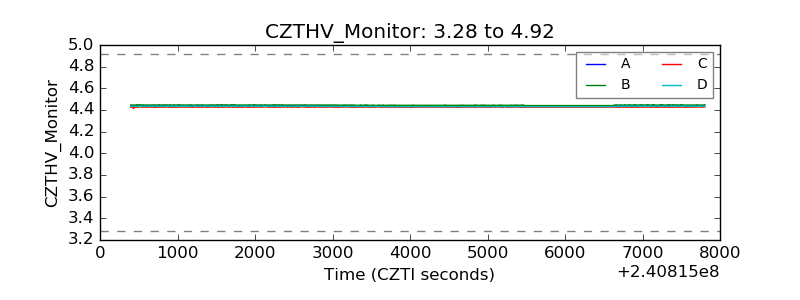 |
| D_VDD | 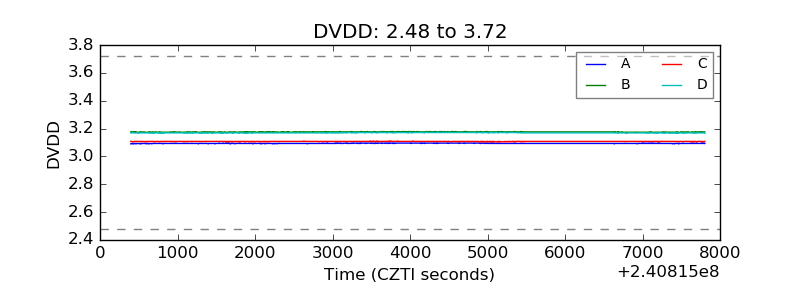 |
| Temperature 1 | 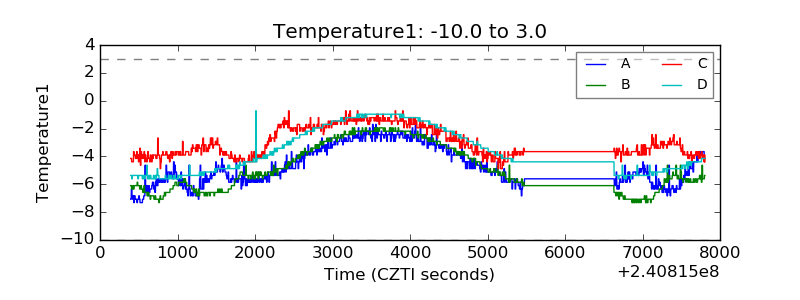 |
| Veto HV Monitor | 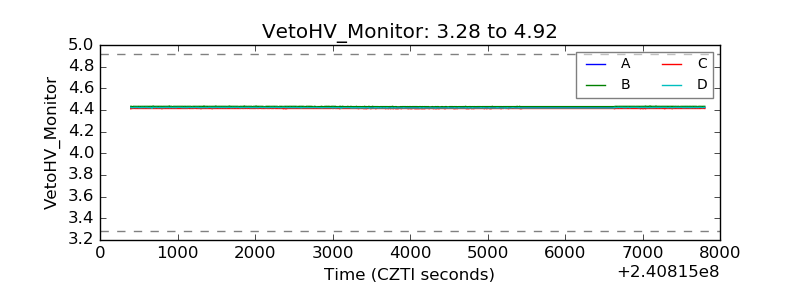 |
| Veto LLD | 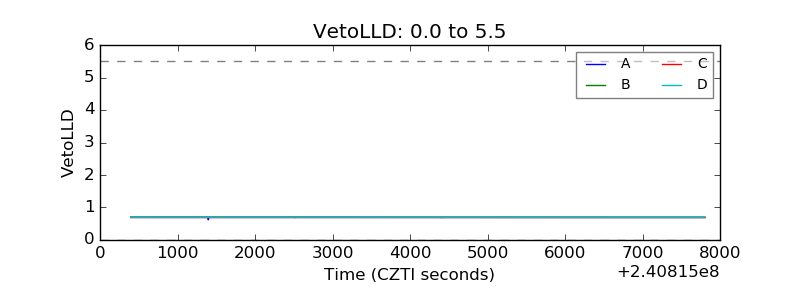 |
| Alpha Counter | 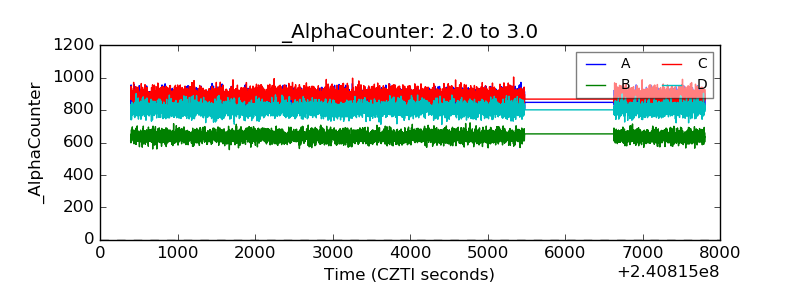 |
| _CPM_Rate | 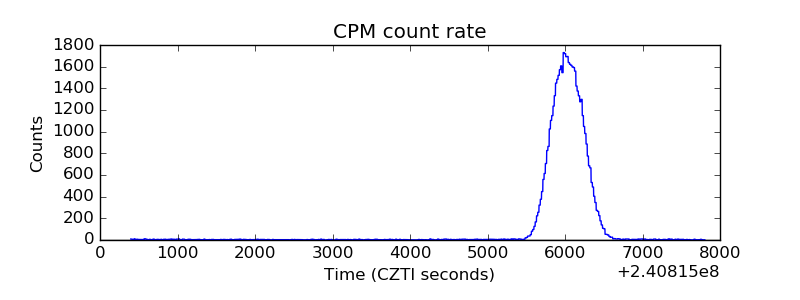 |
| CZT Counter | 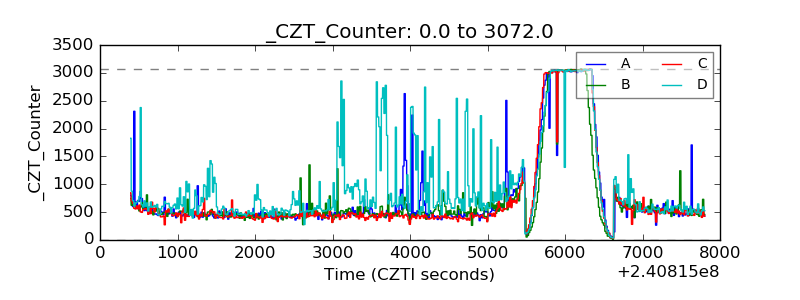 |
| +2.5 Volts monitor |  |
| +5 Volts monitor | 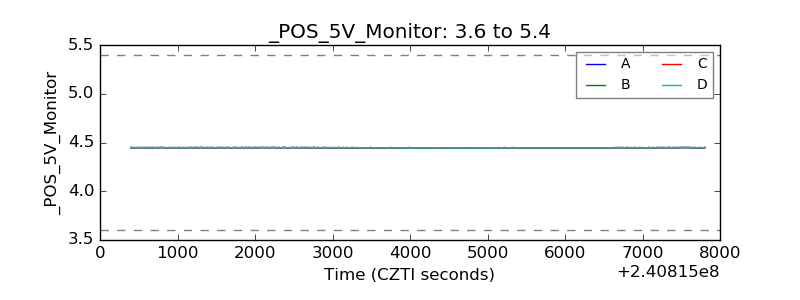 |
| _ROLL_ROT | 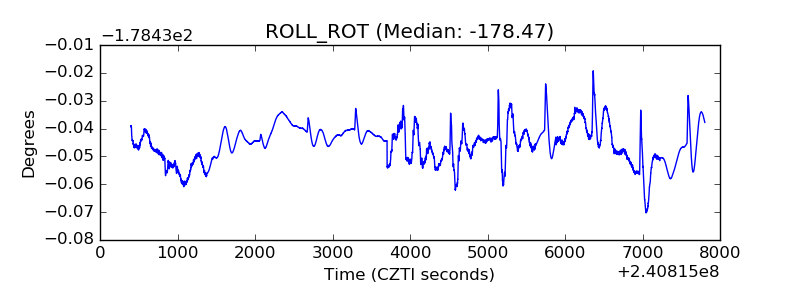 |
| _Roll_DEC |  |
| _Roll_RA | 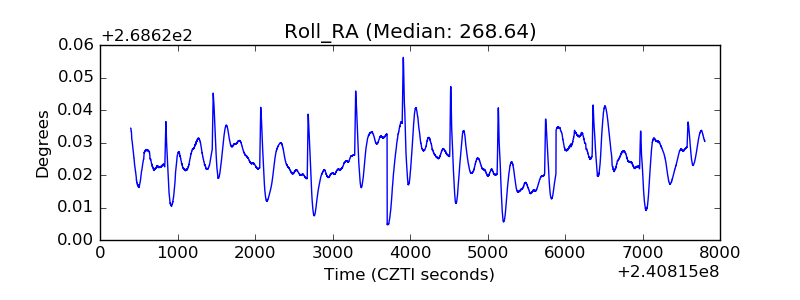 |
| Veto Counter | 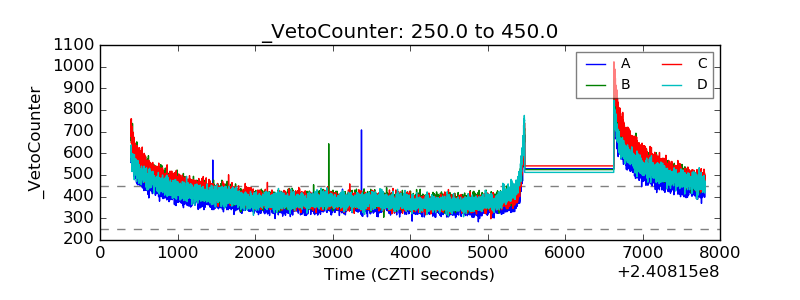 |