| Param | Original file | Final file |
|---|---|---|
| Filename | modeM0/AS1A03_099T01_9000001472_10233cztM0_level2.evt | modeM0/AS1A03_099T01_9000001472_10233cztM0_level2_quad_clean.evt |
| Size (bytes) | 498,087,360 | 100,137,600 |
| Size | 475.0 MB | 95.5 MB |
| Events in quadrant A | 3,431,948 | 659,259 |
| Events in quadrant B | 3,844,068 | 658,955 |
| Events in quadrant C | 3,243,719 | 652,540 |
| Events in quadrant D | 4,134,164 | 619,084 |
| Mode M0 | |||
|---|---|---|---|
| Quadrant | BADHDUFLAG | Total packets | Discarded packets |
| A | 0 | 14046 | 3 |
| B | 0 | 15387 | 4 |
| C | 0 | 13667 | 2 |
| D | 0 | 16400 | 6 |
| Mode SS | |||
|---|---|---|---|
| Quadrant | BADHDUFLAG | Total packets | Discarded packets |
| A | 0 | 132 | 0 |
| B | 0 | 132 | 0 |
| C | 0 | 132 | 0 |
| D | 0 | 132 | 0 |
| Mode M9 | |||
|---|---|---|---|
| Quadrant | BADHDUFLAG | Total packets | Discarded packets |
| A | 0 | 26 | 0 |
| B | 0 | 26 | 0 |
| C | 0 | 26 | 0 |
| D | 0 | 26 | 0 |
| Quadrant | Total seconds | Saturated seconds | Saturation percentage |
|---|---|---|---|
| A | 6342 | 175 | 2.759382% |
| B | 6341 | 280 | 4.415707% |
| C | 6342 | 159 | 2.507096% |
| D | 6340 | 291 | 4.589905% |
Noise dominated data is calculated using 1-second bins in cleaned event files. If a bin has >2000 counts, and if more than 50% of those come from <1% of pixels, then it is considered to be noise-dominated and hence unusable.
| Quadrant | # 1 sec bins | Bins with >0 counts | Bins with >2000 counts | High rate bins dominated by noise | Noise dominated (total time) | Noise dominated (detector-on time) | Marked lightcurve |
|---|---|---|---|---|---|---|---|
| A | 8947 | 6342 | 2 | 2 | 0.02% | 0.03% | 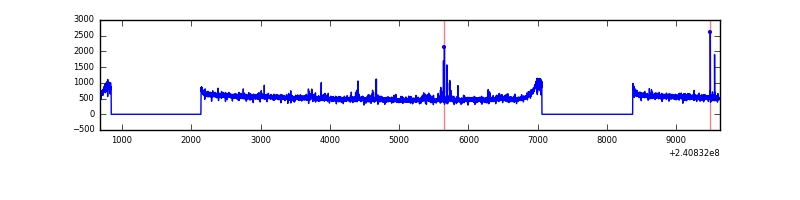 |
| B | 8947 | 6342 | 67 | 67 | 0.75% | 1.06% | 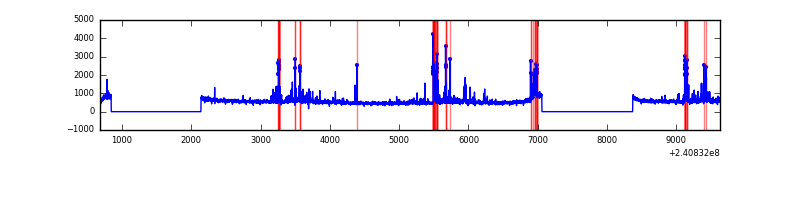 |
| C | 8947 | 6342 | 0 | 0 | 0.00% | 0.00% | 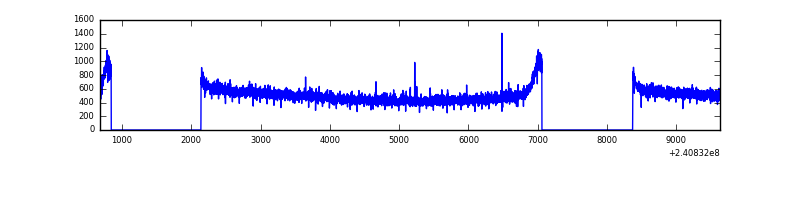 |
| D | 8947 | 6342 | 101 | 101 | 1.13% | 1.59% | 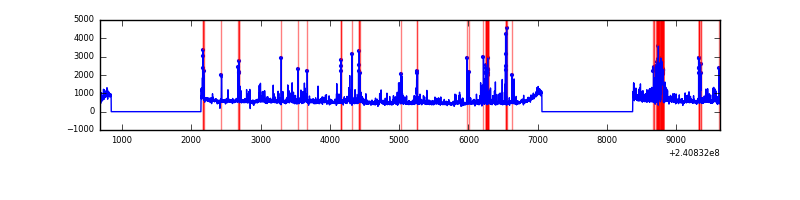 |
Top three noisy pixels from each quadrant. If the there are fewer than three noisy pixels in the level2.evt file, extra rows are filled as -1
| Pixel properties | Quadrant properties | ||||||
|---|---|---|---|---|---|---|---|
| Quadrant | DetID | PixID | Counts | Sigma | Mean | Median | Sigma |
| A | 8 | 15 | 62638 | 357.8 | 865 | 848 | 172.7 |
| A | 15 | 223 | 20399 | 113.21 | 865 | 848 | 172.7 |
| A | 15 | 239 | 8635 | 45.09 | 865 | 848 | 172.7 |
| B | 4 | 239 | 291683 | 1830.64 | 846 | 830 | 158.9 |
| B | 0 | 85 | 79899 | 497.66 | 846 | 830 | 158.9 |
| B | 0 | 214 | 77842 | 484.72 | 846 | 830 | 158.9 |
| C | 13 | 61 | 6263 | 28.47 | 829 | 835 | 190.6 |
| C | 1 | 0 | 3893 | 16.04 | 829 | 835 | 190.6 |
| C | 14 | 67 | 3207 | 12.44 | 829 | 835 | 190.6 |
| D | 1 | 52 | 563548 | 2881.83 | 829 | 810 | 195.3 |
| D | 2 | 14 | 169565 | 864.21 | 829 | 810 | 195.3 |
| D | 2 | 152 | 156504 | 797.32 | 829 | 810 | 195.3 |
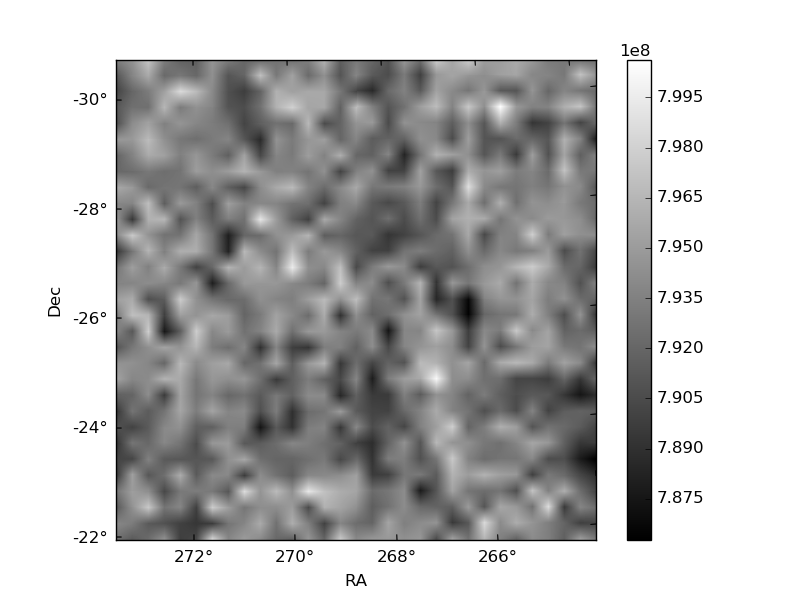
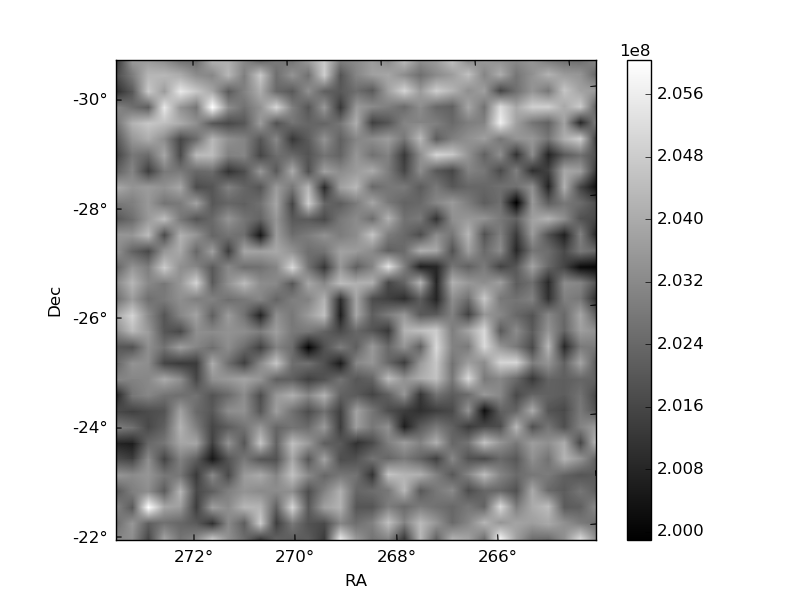
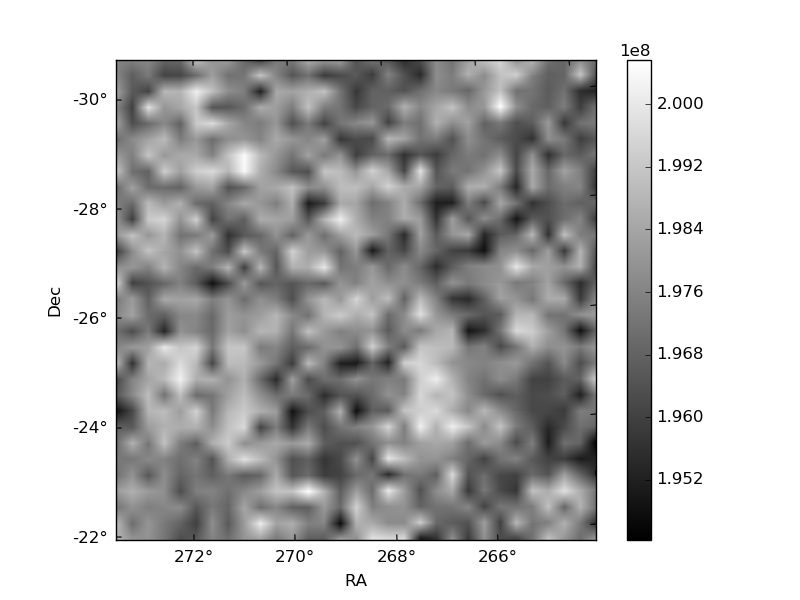
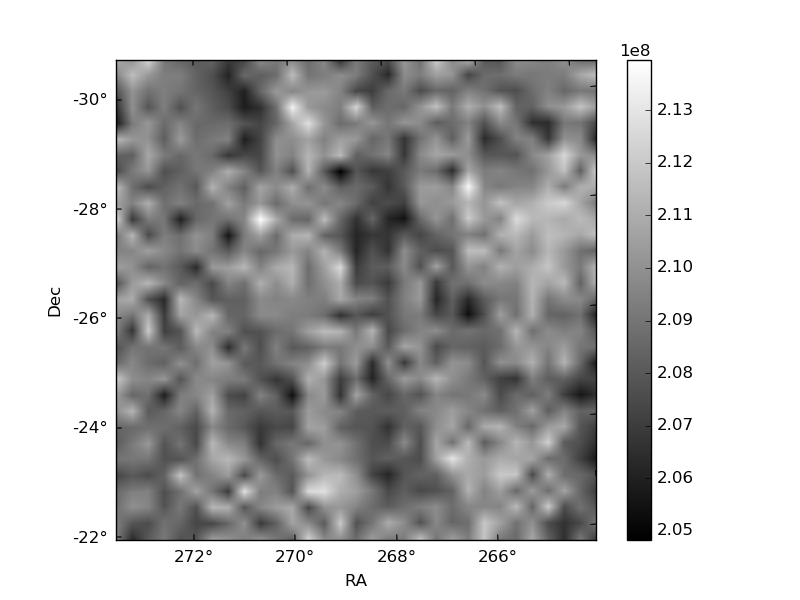
Histogram calculated using DETX and DETY for each event in the final _common_clean file
| Quadrant A | 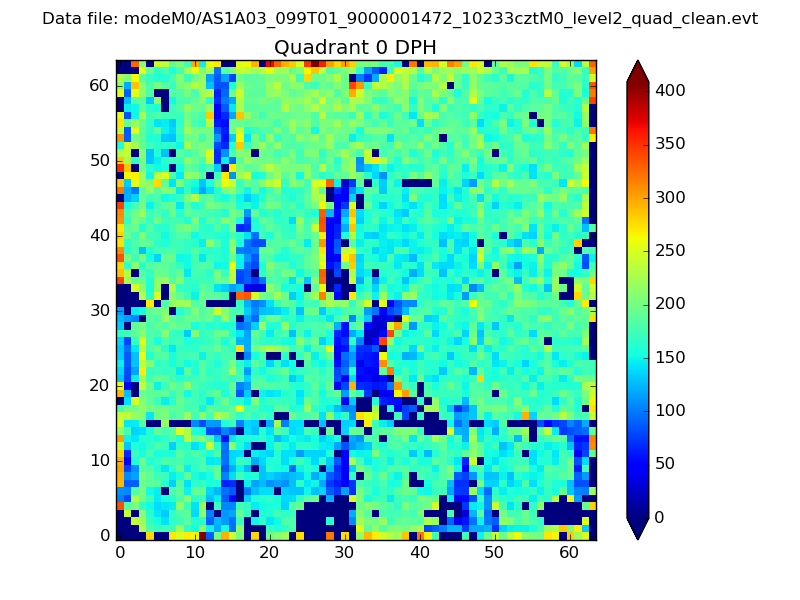 |
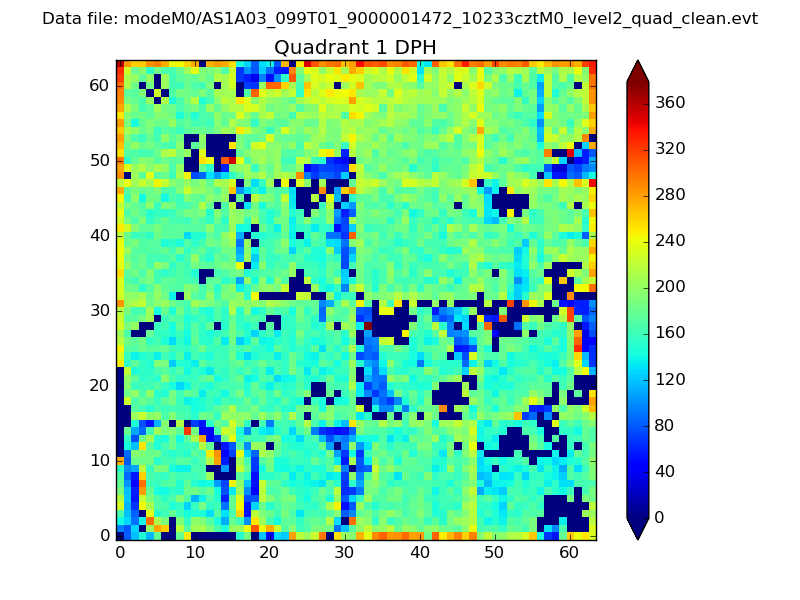 |
Quadrant B |
|---|---|---|---|
| Quadrant D | 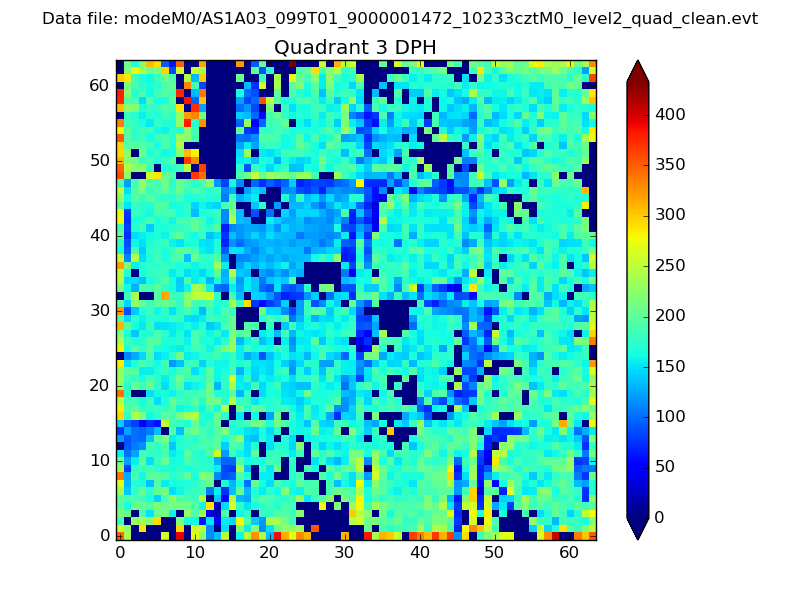 |
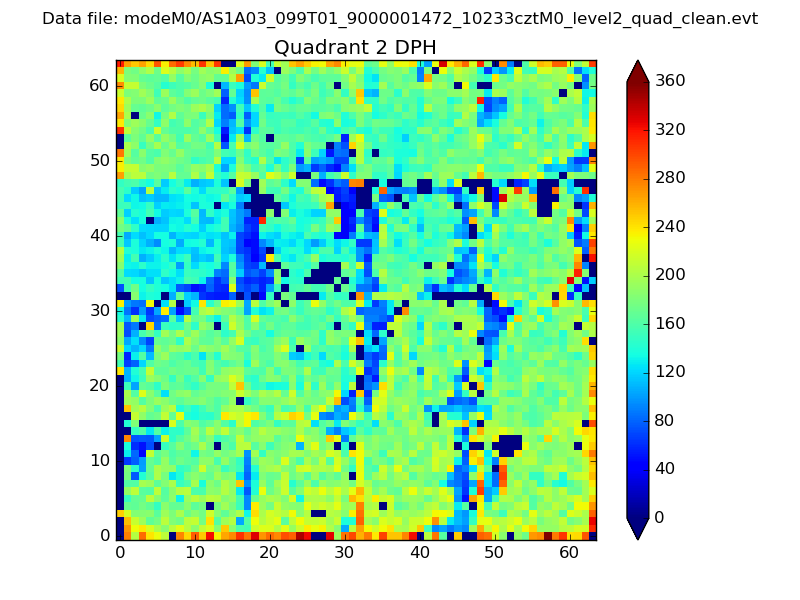 |
Quadrant C |
| Plot type | Count rate plots | Images |
|---|---|---|
| Comparison with Poisson distribution Blue bars denote a histogram of data divided into 1 sec bins. Red curve is a Poisson curve with rate = median count rate of data. |
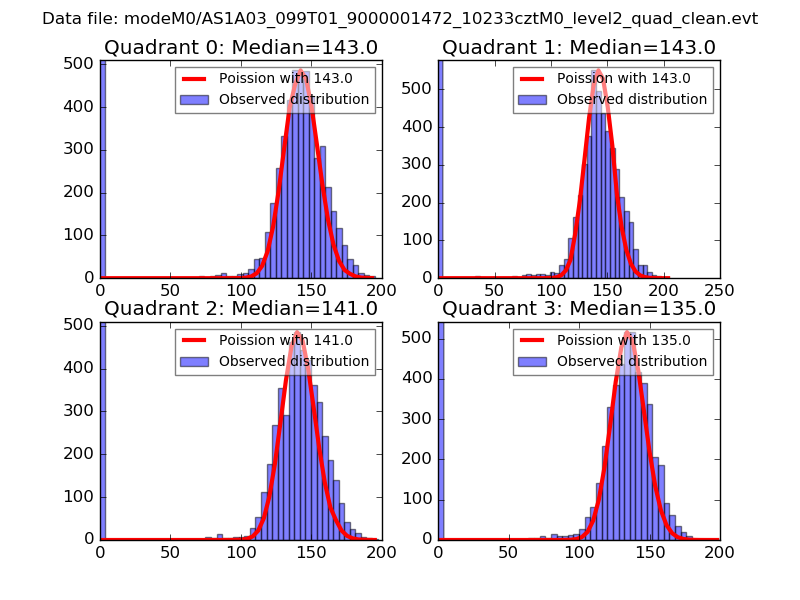 |
 |
| Quadrant-wise count rates Data is divided into 100 sec bins |
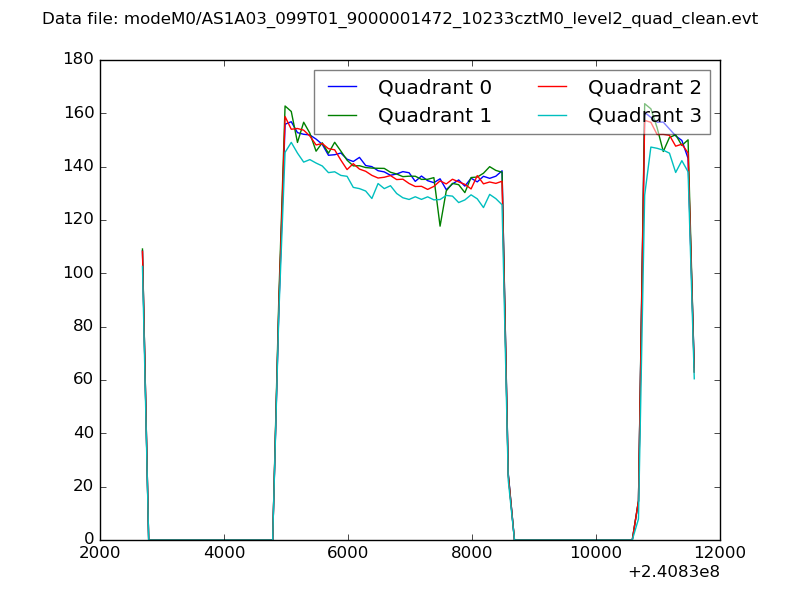 |
|
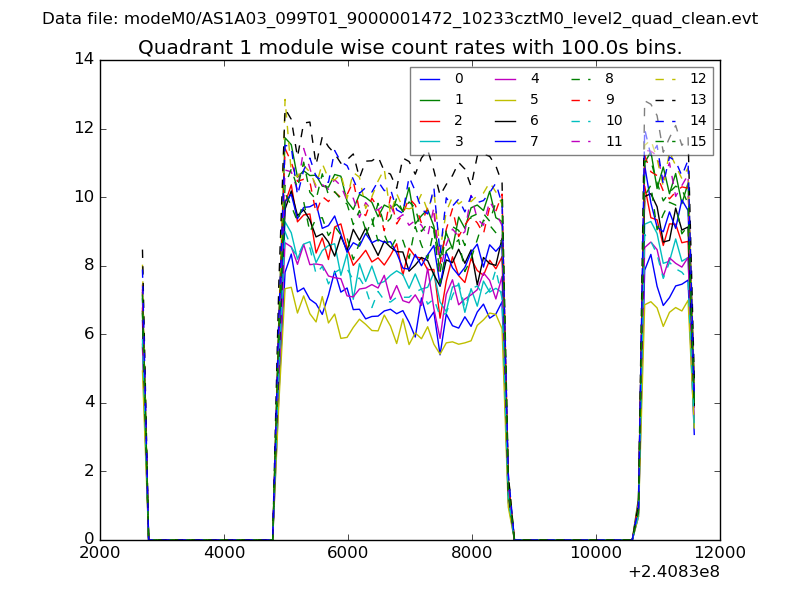
| Module-wise count rates for Quadrant A Data is divided into 100 sec bins |
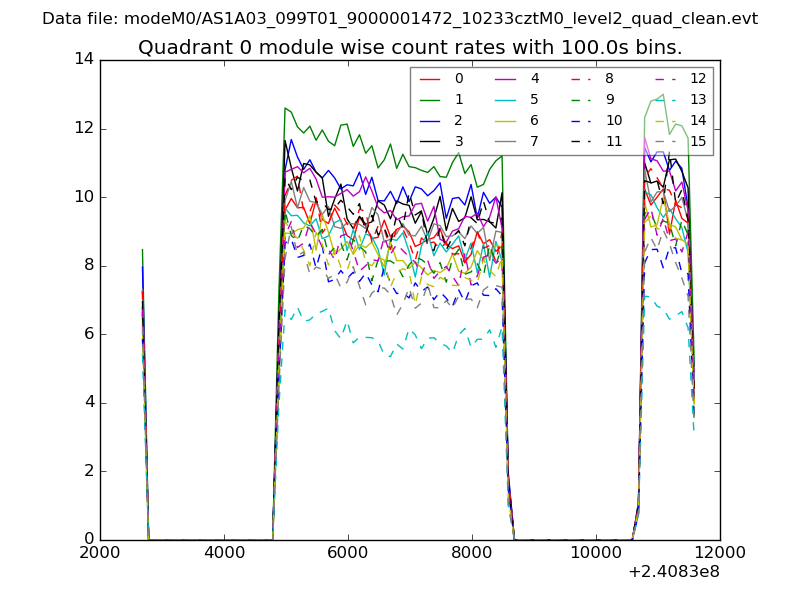 |
 |
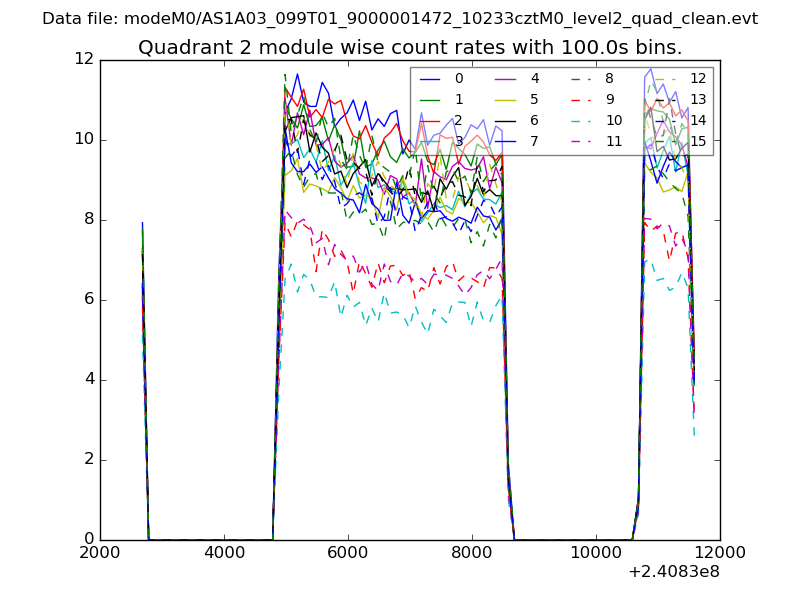
| Module-wise count rates for Quadrant B Data is divided into 100 sec bins |
 |
 |
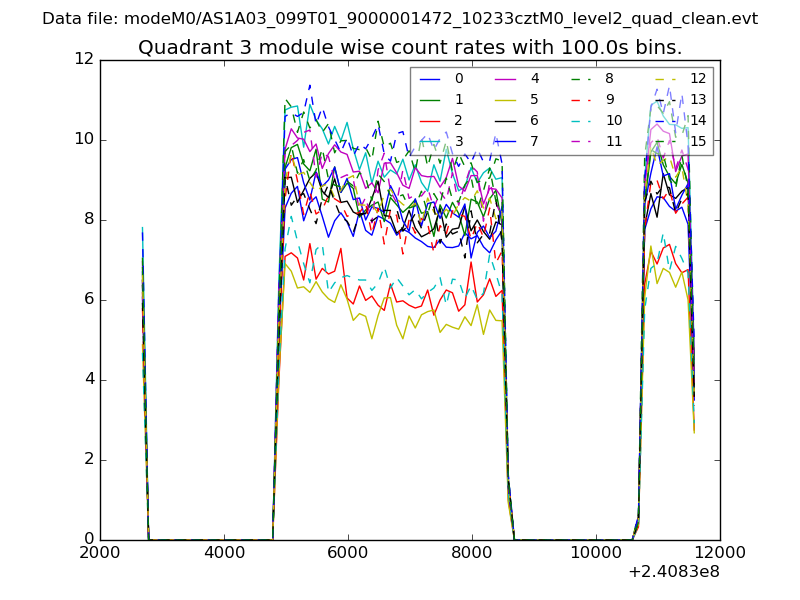
| Module-wise count rates for Quadrant C Data is divided into 100 sec bins |
 |
 |
| Module-wise count rates for Quadrant D Data is divided into 100 sec bins |
 |
 |
| Parameter | Plot |
|---|---|
| CZT HV Monitor | 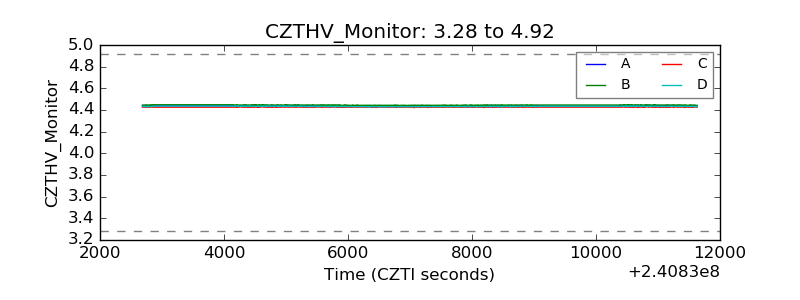 |
| D_VDD | 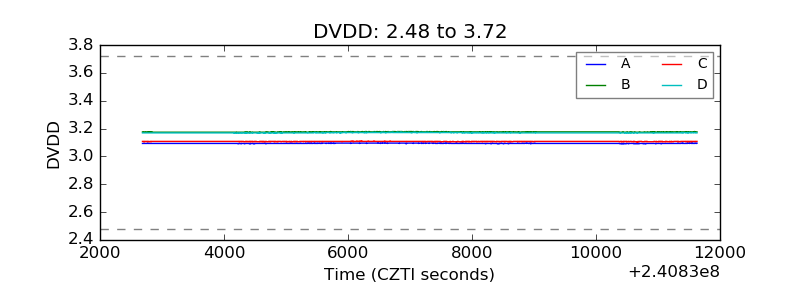 |
| Temperature 1 | 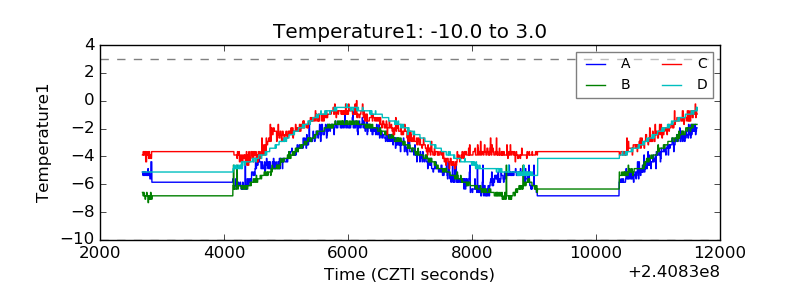 |
| Veto HV Monitor | 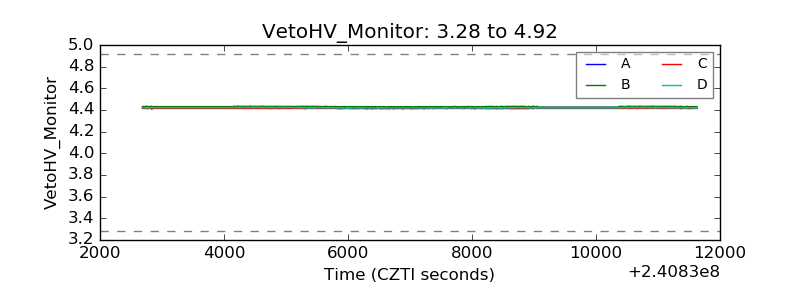 |
| Veto LLD |  |
| Alpha Counter | 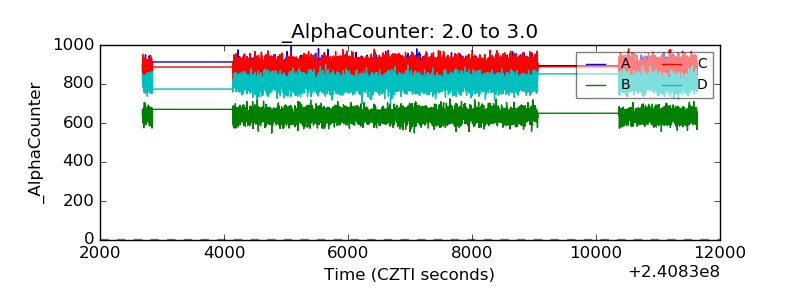 |
| _CPM_Rate | 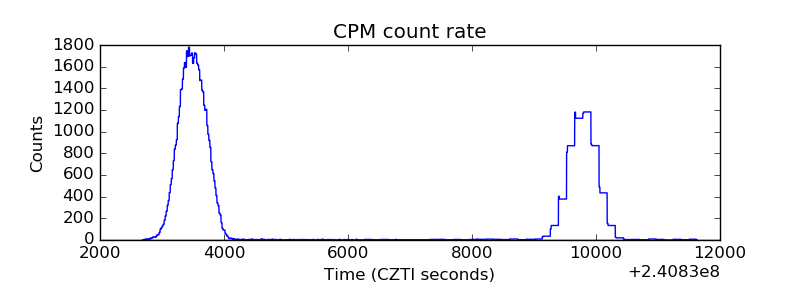 |
| CZT Counter | 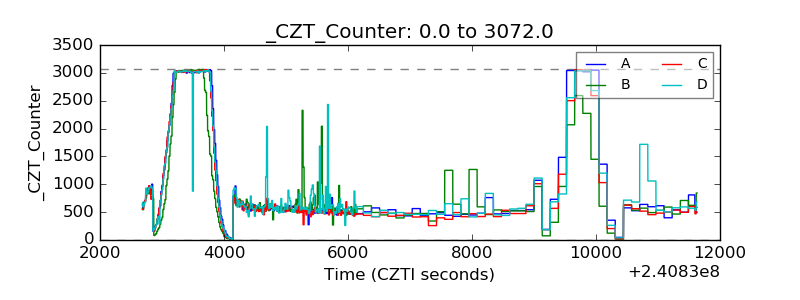 |
| +2.5 Volts monitor |  |
| +5 Volts monitor | 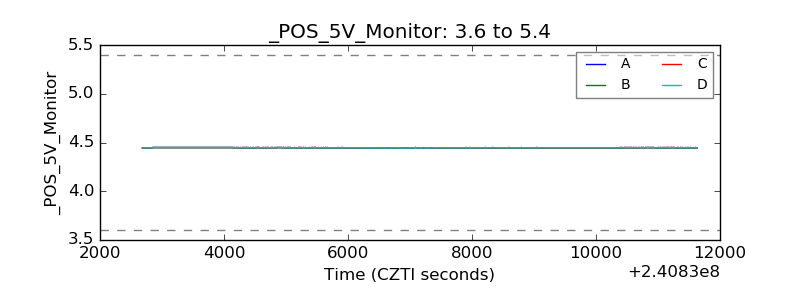 |
| _ROLL_ROT | 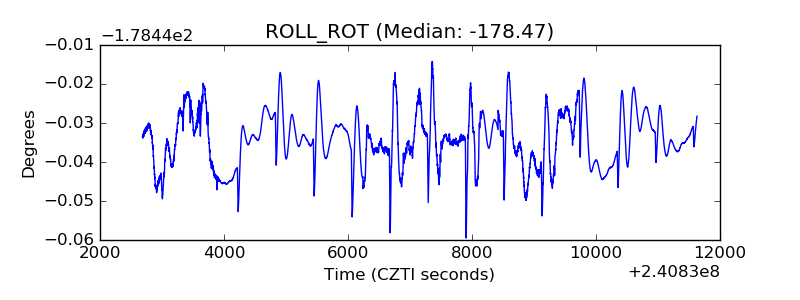 |
| _Roll_DEC | 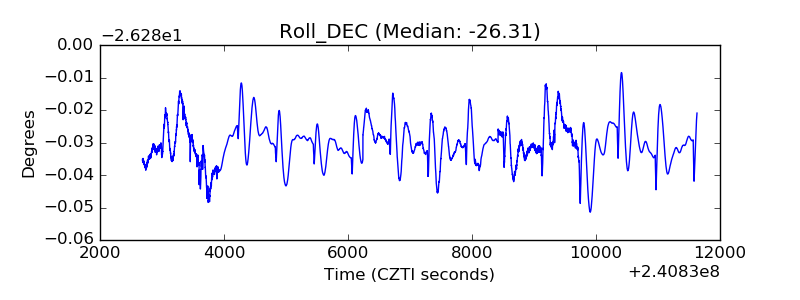 |
| _Roll_RA | 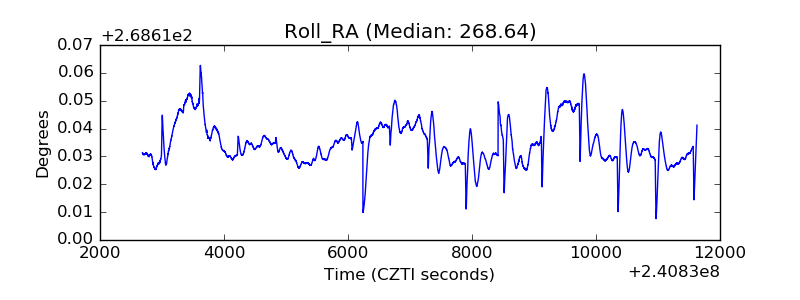 |
| Veto Counter | 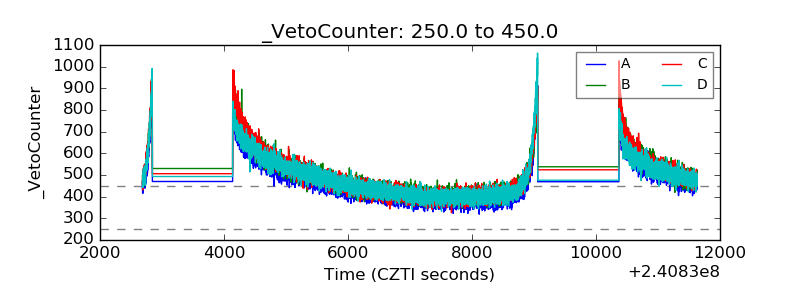 |