| Param | Original file | Final file |
|---|---|---|
| Filename | modeM0/AS1A03_099T01_9000001472_10234cztM0_level2.evt | modeM0/AS1A03_099T01_9000001472_10234cztM0_level2_quad_clean.evt |
| Size (bytes) | 1,044,144,000 | 241,695,360 |
| Size | 995.8 MB | 230.5 MB |
| Events in quadrant A | 7,144,288 | 1,591,278 |
| Events in quadrant B | 7,855,526 | 1,583,165 |
| Events in quadrant C | 6,715,637 | 1,594,487 |
| Events in quadrant D | 8,955,937 | 1,582,266 |
| Mode M0 | |||
|---|---|---|---|
| Quadrant | BADHDUFLAG | Total packets | Discarded packets |
| A | 0 | 46418 | 16743 |
| B | 0 | 50095 | 18216 |
| C | 0 | 44692 | 15584 |
| D | 0 | 52591 | 16540 |
| Mode SS | |||
|---|---|---|---|
| Quadrant | BADHDUFLAG | Total packets | Discarded packets |
| A | 0 | 436 | 137 |
| B | 0 | 436 | 142 |
| C | 0 | 436 | 141 |
| D | 0 | 426 | 128 |
| Mode M9 | |||
|---|---|---|---|
| Quadrant | BADHDUFLAG | Total packets | Discarded packets |
| A | 0 | 52 | 14 |
| B | 0 | 53 | 15 |
| C | 0 | 53 | 15 |
| D | 0 | 52 | 14 |
| Quadrant | Total seconds | Saturated seconds | Saturation percentage |
|---|---|---|---|
| A | 13807 | 257 | 1.861375% |
| B | 13751 | 383 | 2.785252% |
| C | 13960 | 225 | 1.611748% |
| D | 14611 | 416 | 2.847170% |
Noise dominated data is calculated using 1-second bins in cleaned event files. If a bin has >2000 counts, and if more than 50% of those come from <1% of pixels, then it is considered to be noise-dominated and hence unusable.
| Quadrant | # 1 sec bins | Bins with >0 counts | Bins with >2000 counts | High rate bins dominated by noise | Noise dominated (total time) | Noise dominated (detector-on time) | Marked lightcurve |
|---|---|---|---|---|---|---|---|
| A | 18917 | 14728 | 1 | 1 | 0.01% | 0.01% | 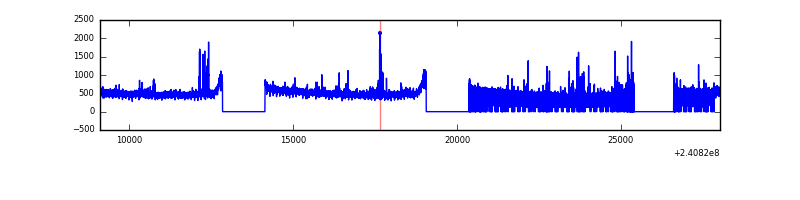 |
| B | 18917 | 14717 | 76 | 76 | 0.40% | 0.52% | 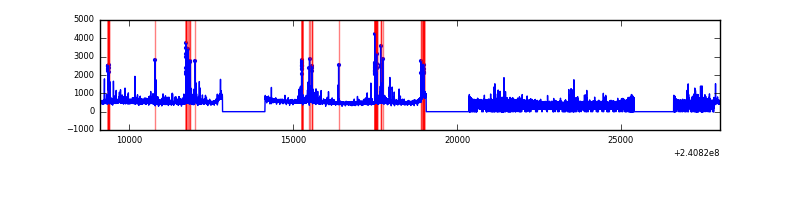 |
| C | 18917 | 14828 | 0 | 0 | 0.00% | 0.00% | 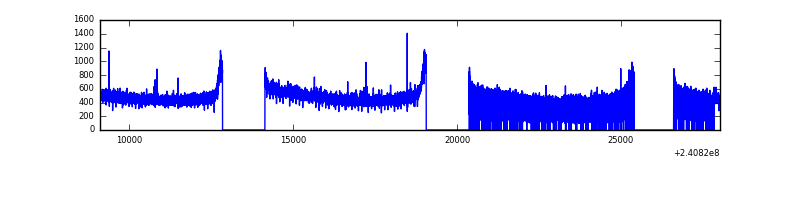 |
| D | 18917 | 14945 | 137 | 137 | 0.72% | 0.92% | 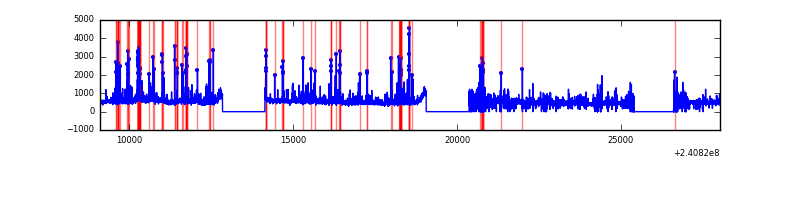 |
Top three noisy pixels from each quadrant. If the there are fewer than three noisy pixels in the level2.evt file, extra rows are filled as -1
| Pixel properties | Quadrant properties | ||||||
|---|---|---|---|---|---|---|---|
| Quadrant | DetID | PixID | Counts | Sigma | Mean | Median | Sigma |
| A | 8 | 15 | 170638 | 479.57 | 1771 | 1738 | 352.2 |
| A | 15 | 223 | 98760 | 275.48 | 1771 | 1738 | 352.2 |
| A | 15 | 239 | 34011 | 91.63 | 1771 | 1738 | 352.2 |
| B | 4 | 239 | 454442 | 1395.01 | 1740 | 1710 | 324.5 |
| B | 0 | 214 | 226224 | 691.8 | 1740 | 1710 | 324.5 |
| B | 11 | 51 | 118899 | 361.1 | 1740 | 1710 | 324.5 |
| C | 13 | 61 | 12935 | 28.65 | 1716 | 1728 | 391.1 |
| C | 0 | 207 | 11560 | 25.14 | 1716 | 1728 | 391.1 |
| C | 14 | 67 | 9674 | 20.31 | 1716 | 1728 | 391.1 |
| D | 1 | 52 | 1129572 | 2671.69 | 1797 | 1754 | 422.1 |
| D | 8 | 195 | 395999 | 933.93 | 1797 | 1754 | 422.1 |
| D | 2 | 14 | 320496 | 755.07 | 1797 | 1754 | 422.1 |
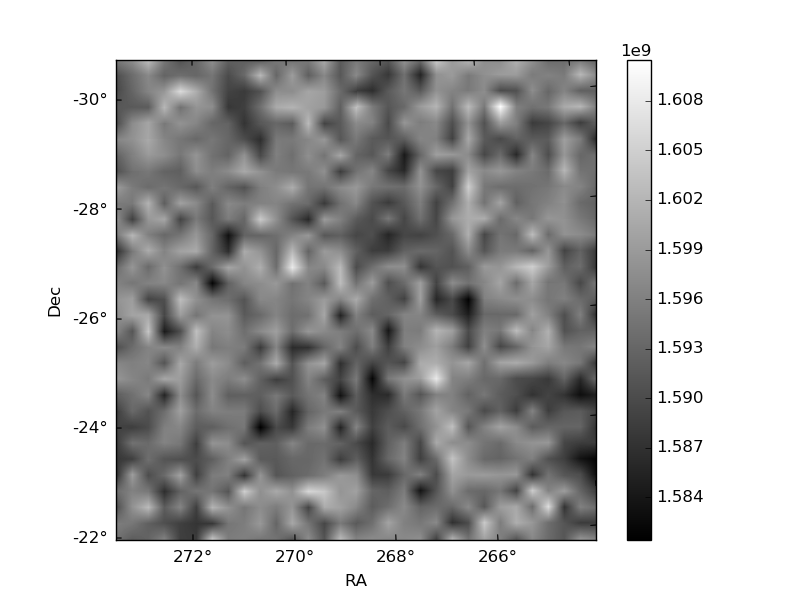
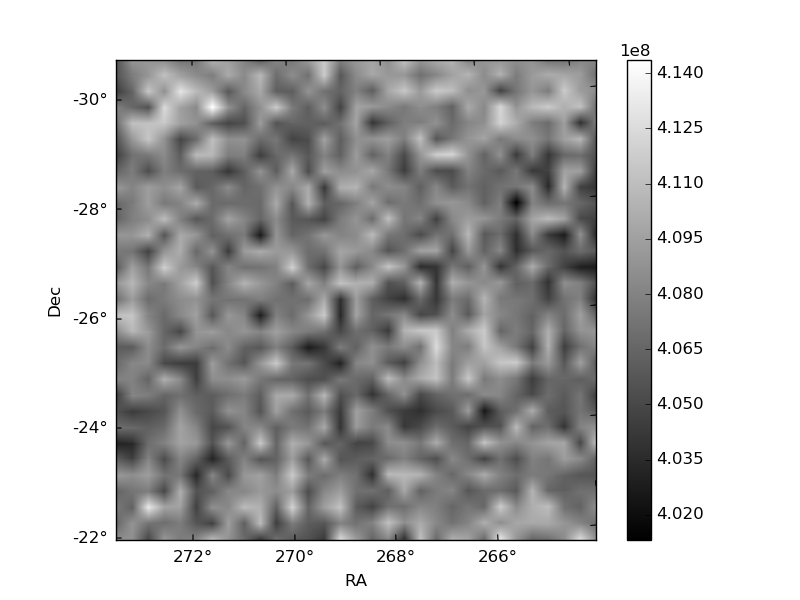
Histogram calculated using DETX and DETY for each event in the final _common_clean file
| Quadrant A | 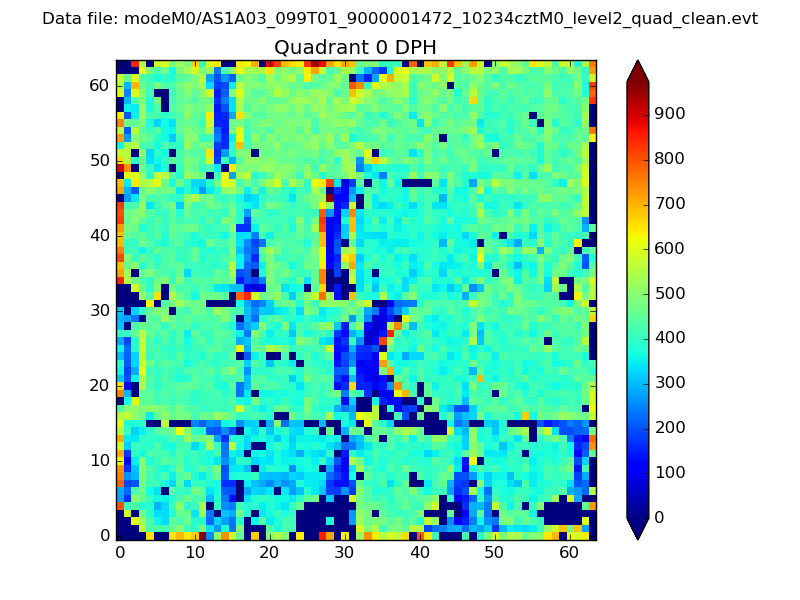 |
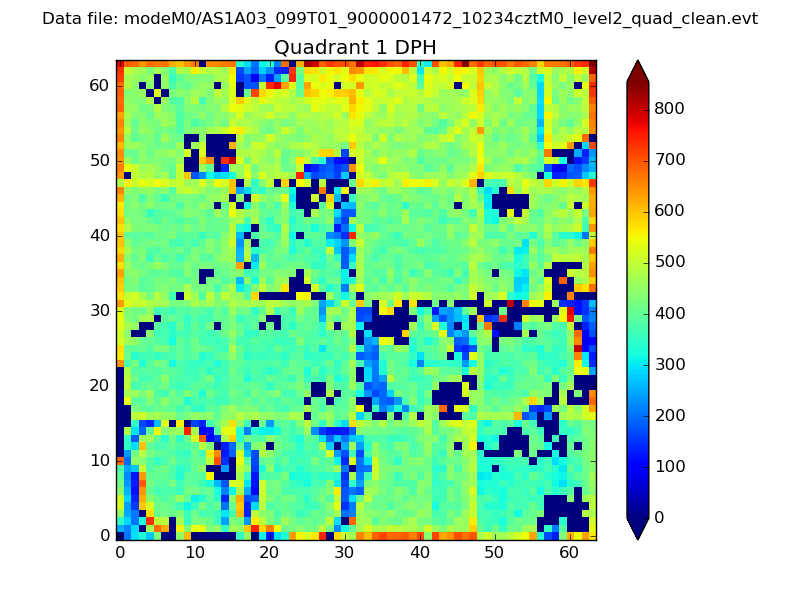 |
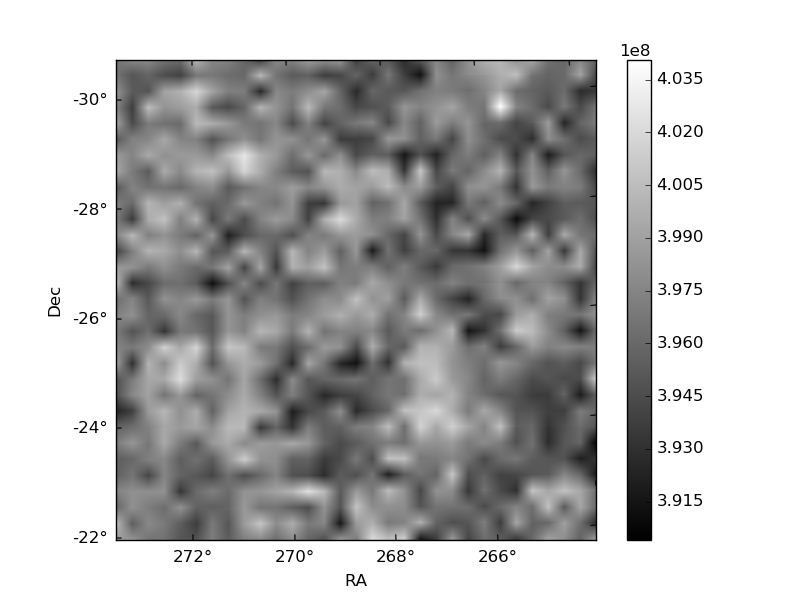
Quadrant B |
|---|---|---|---|
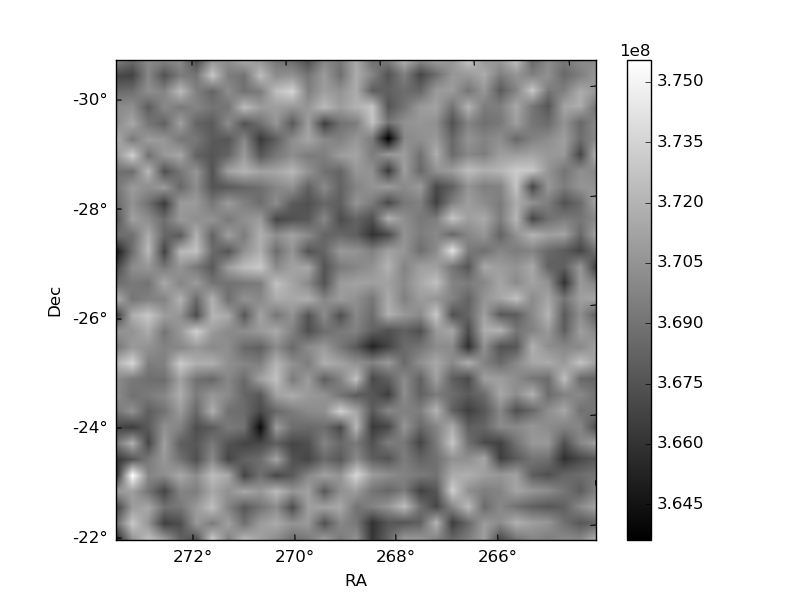
| Quadrant D | 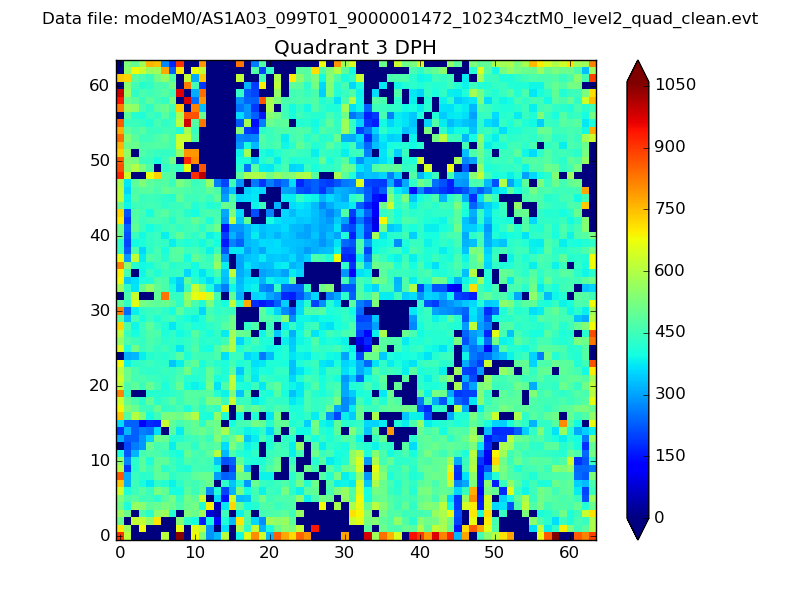 |
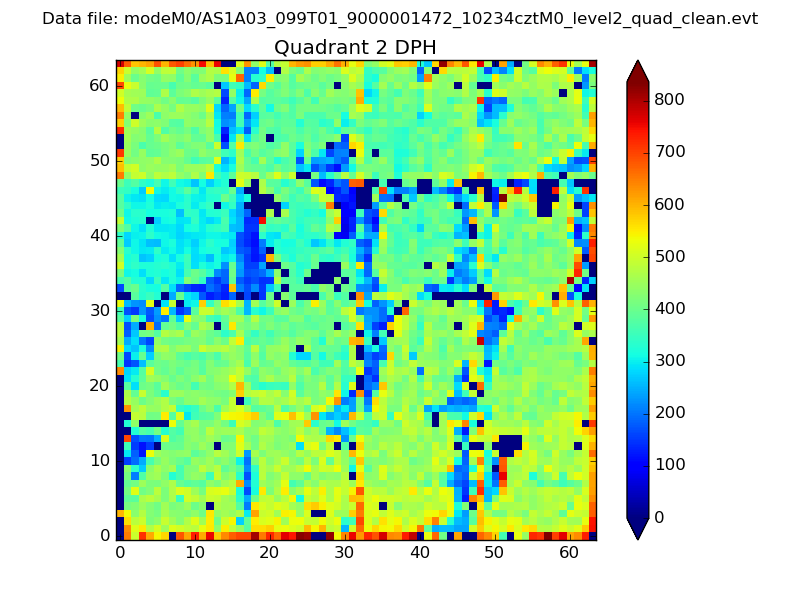 |
Quadrant C |
| Plot type | Count rate plots | Images |
|---|---|---|
| Comparison with Poisson distribution Blue bars denote a histogram of data divided into 1 sec bins. Red curve is a Poisson curve with rate = median count rate of data. |
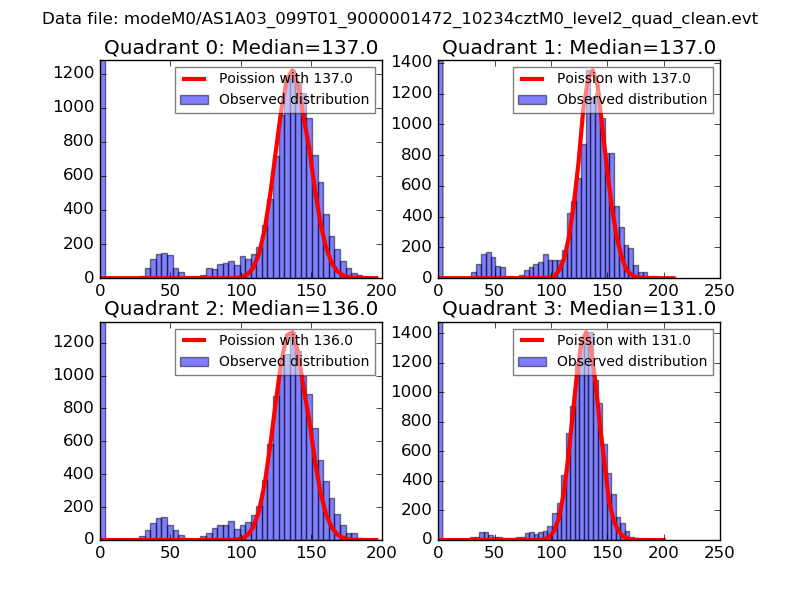 |
 |
| Quadrant-wise count rates Data is divided into 100 sec bins |
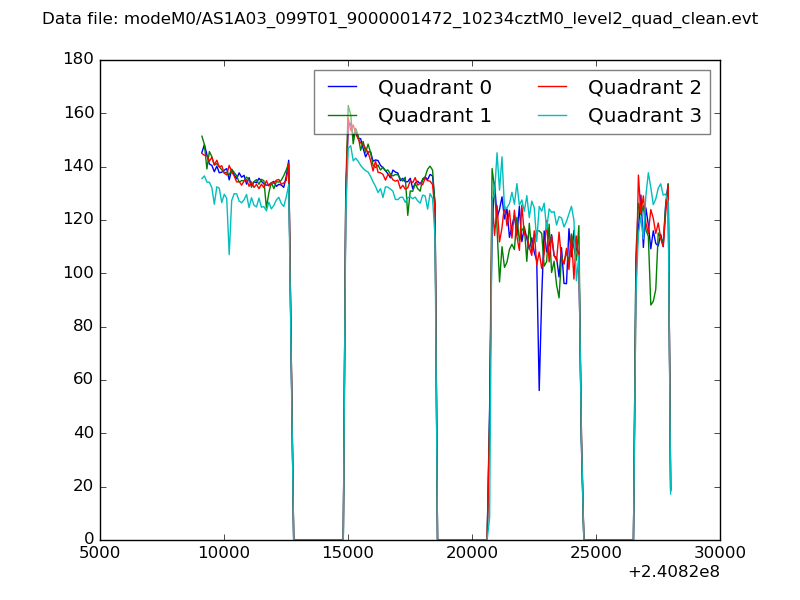 |
|
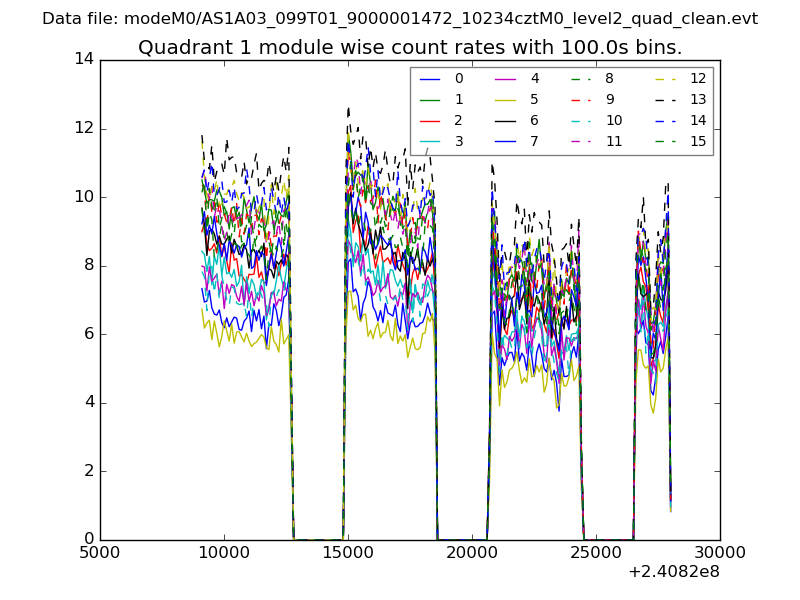
| Module-wise count rates for Quadrant A Data is divided into 100 sec bins |
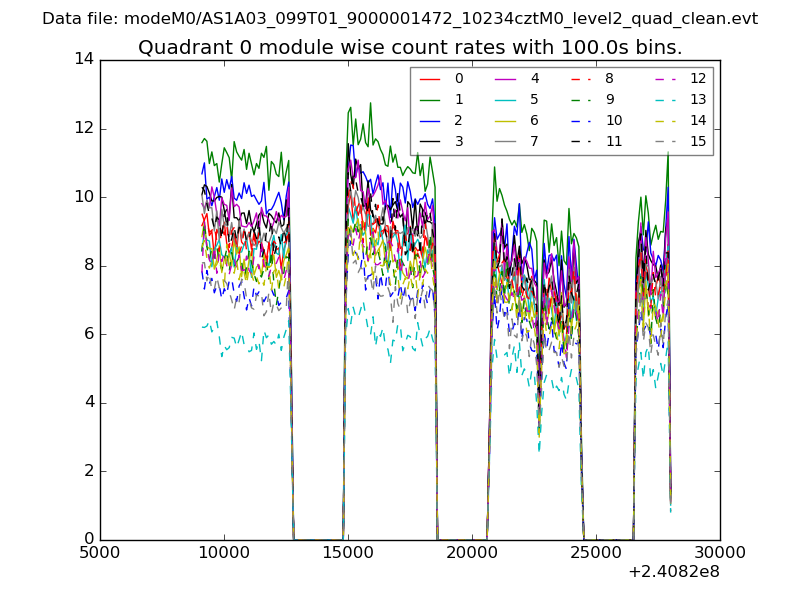 |
 |
| Module-wise count rates for Quadrant B Data is divided into 100 sec bins |
 |
 |
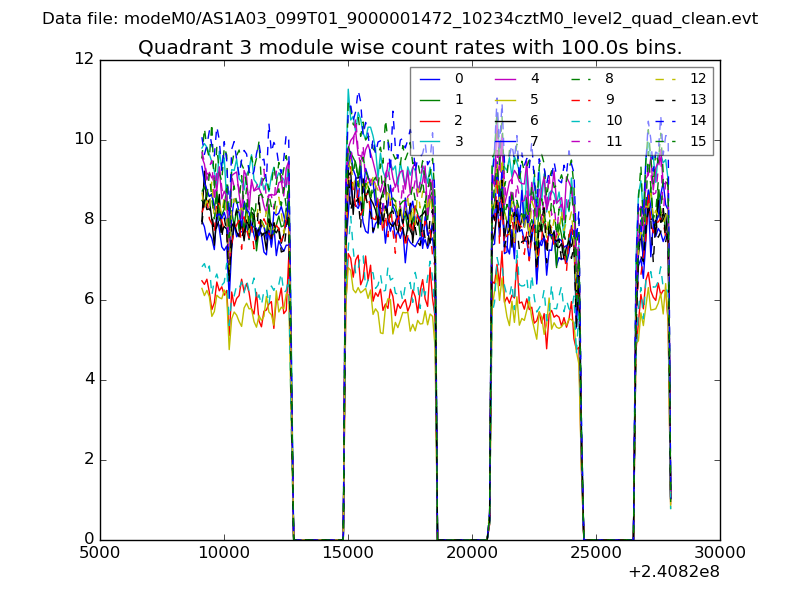
| Module-wise count rates for Quadrant C Data is divided into 100 sec bins |
 |
 |
| Module-wise count rates for Quadrant D Data is divided into 100 sec bins |
 |
 |
| Parameter | Plot |
|---|---|
| CZT HV Monitor |  |
| D_VDD | 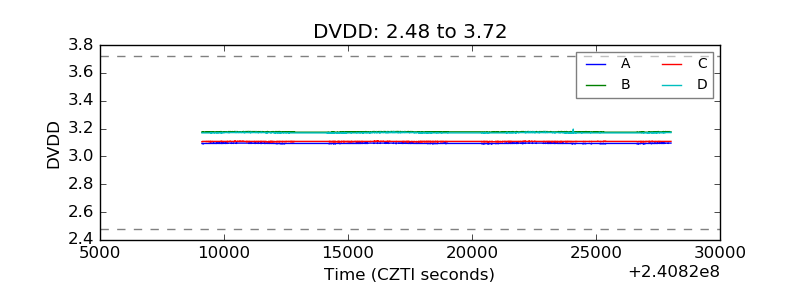 |
| Temperature 1 | 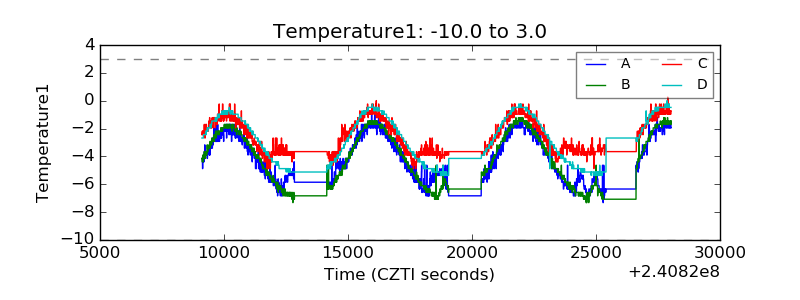 |
| Veto HV Monitor | 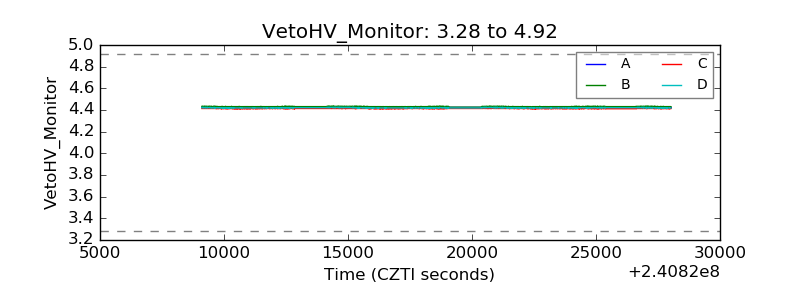 |
| Veto LLD |  |
| Alpha Counter | 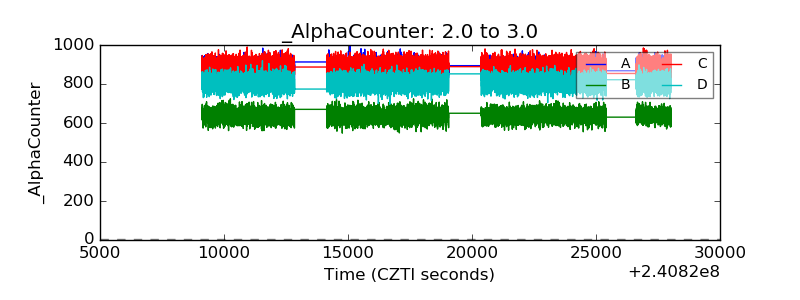 |
| _CPM_Rate | 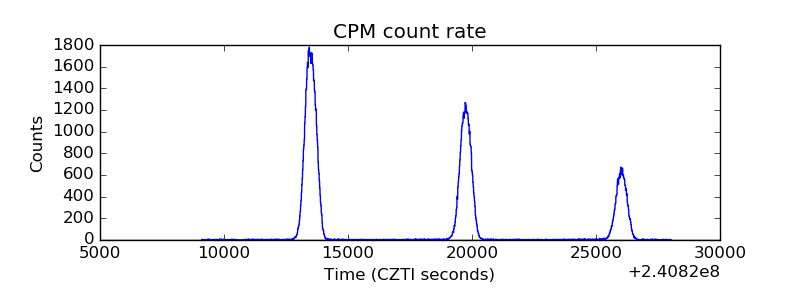 |
| CZT Counter | 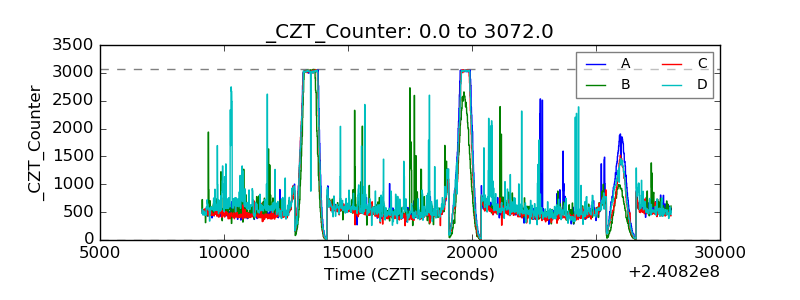 |
| +2.5 Volts monitor |  |
| +5 Volts monitor | 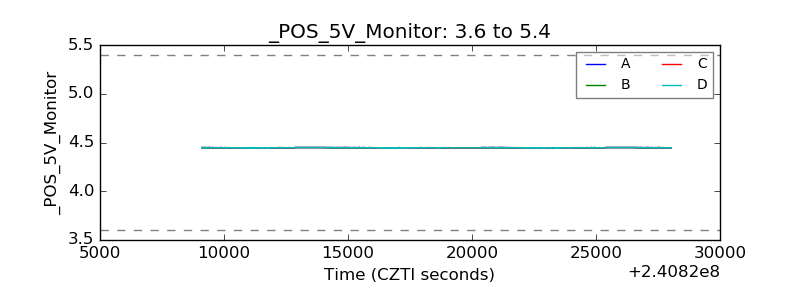 |
| _ROLL_ROT | 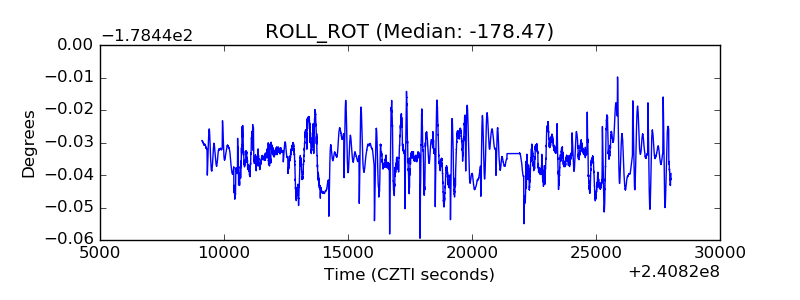 |
| _Roll_DEC | 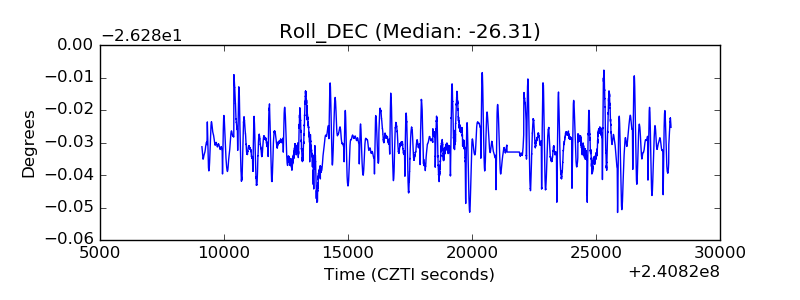 |
| _Roll_RA | 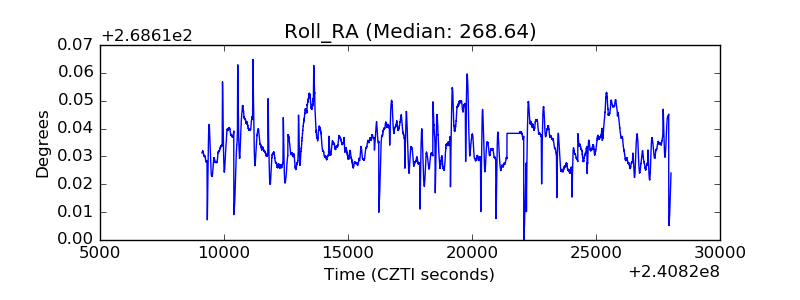 |
| Veto Counter |  |