| Param | Original file | Final file |
|---|---|---|
| Filename | modeM0/AS1A03_099T01_9000001472_10236cztM0_level2.evt | modeM0/AS1A03_099T01_9000001472_10236cztM0_level2_quad_clean.evt |
| Size (bytes) | 135,241,920 | 36,475,200 |
| Size | 129.0 MB | 34.8 MB |
| Events in quadrant A | 971,487 | 244,674 |
| Events in quadrant B | 1,004,464 | 246,779 |
| Events in quadrant C | 869,702 | 244,108 |
| Events in quadrant D | 1,119,965 | 231,674 |
| Mode M0 | |||
|---|---|---|---|
| Quadrant | BADHDUFLAG | Total packets | Discarded packets |
| A | 0 | 4055 | 1 |
| B | 0 | 4211 | 1 |
| C | 0 | 3864 | 1 |
| D | 0 | 4441 | 1 |
| Mode SS | |||
|---|---|---|---|
| Quadrant | BADHDUFLAG | Total packets | Discarded packets |
| A | 0 | 38 | 0 |
| B | 0 | 38 | 0 |
| C | 0 | 38 | 0 |
| D | 0 | 38 | 0 |
| Mode M9 | |||
|---|---|---|---|
| Quadrant | BADHDUFLAG | Total packets | Discarded packets |
| A | 0 | 2 | 0 |
| B | 0 | 2 | 0 |
| C | 0 | 2 | 0 |
| D | 0 | 3 | 0 |
| Quadrant | Total seconds | Saturated seconds | Saturation percentage |
|---|---|---|---|
| A | 1875 | 15 | 0.800000% |
| B | 1875 | 19 | 1.013333% |
| C | 1875 | 6 | 0.320000% |
| D | 1875 | 32 | 1.706667% |
Noise dominated data is calculated using 1-second bins in cleaned event files. If a bin has >2000 counts, and if more than 50% of those come from <1% of pixels, then it is considered to be noise-dominated and hence unusable.
| Quadrant | # 1 sec bins | Bins with >0 counts | Bins with >2000 counts | High rate bins dominated by noise | Noise dominated (total time) | Noise dominated (detector-on time) | Marked lightcurve |
|---|---|---|---|---|---|---|---|
| A | 1875 | 1875 | 3 | 3 | 0.16% | 0.16% | 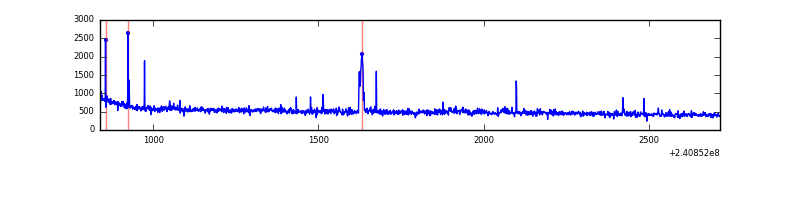 |
| B | 1875 | 1875 | 4 | 4 | 0.21% | 0.21% | 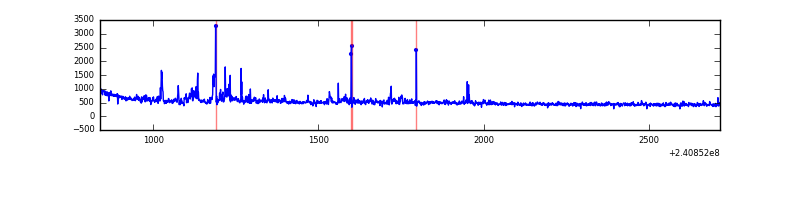 |
| C | 1875 | 1875 | 0 | 0 | 0.00% | 0.00% | 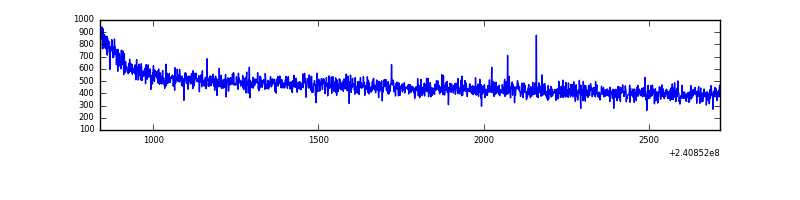 |
| D | 1875 | 1875 | 21 | 21 | 1.12% | 1.12% | 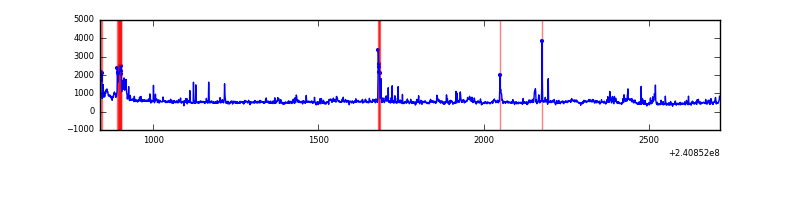 |
Top three noisy pixels from each quadrant. If the there are fewer than three noisy pixels in the level2.evt file, extra rows are filled as -1
| Pixel properties | Quadrant properties | ||||||
|---|---|---|---|---|---|---|---|
| Quadrant | DetID | PixID | Counts | Sigma | Mean | Median | Sigma |
| A | 15 | 239 | 26625 | 531.61 | 235 | 231 | 49.6 |
| A | 8 | 15 | 24525 | 489.31 | 235 | 231 | 49.6 |
| A | 15 | 223 | 11075 | 218.41 | 235 | 231 | 49.6 |
| B | 4 | 239 | 39749 | 848.15 | 230 | 225 | 46.6 |
| B | 0 | 214 | 32939 | 702.01 | 230 | 225 | 46.6 |
| B | 10 | 247 | 9263 | 193.95 | 230 | 225 | 46.6 |
| C | 13 | 61 | 1658 | 26.69 | 222 | 224 | 53.7 |
| C | 0 | 207 | 722 | 9.27 | 222 | 224 | 53.7 |
| C | 14 | 67 | 592 | 6.85 | 222 | 224 | 53.7 |
| D | 1 | 52 | 133043 | 2386.9 | 224 | 218 | 55.6 |
| D | 2 | 16 | 54108 | 968.42 | 224 | 218 | 55.6 |
| D | 8 | 195 | 44938 | 803.63 | 224 | 218 | 55.6 |
Histogram calculated using DETX and DETY for each event in the final _common_clean file
| Quadrant A | 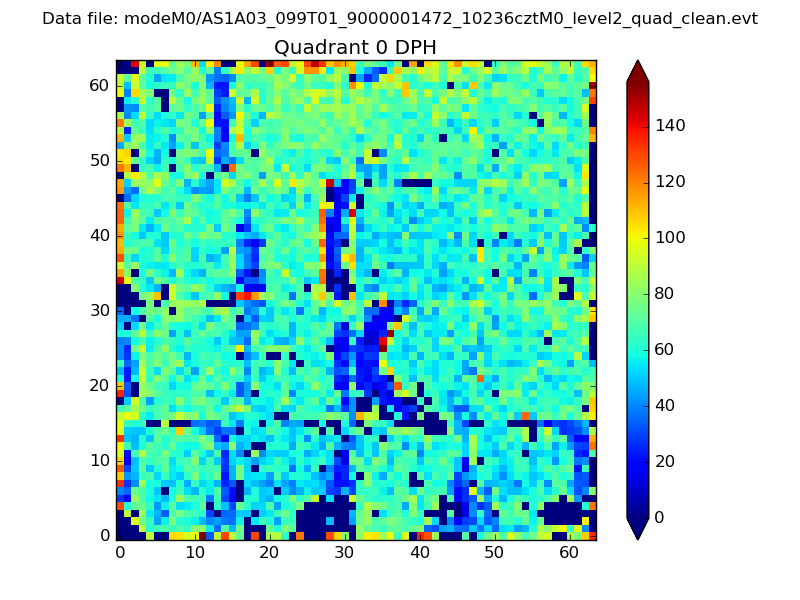 |
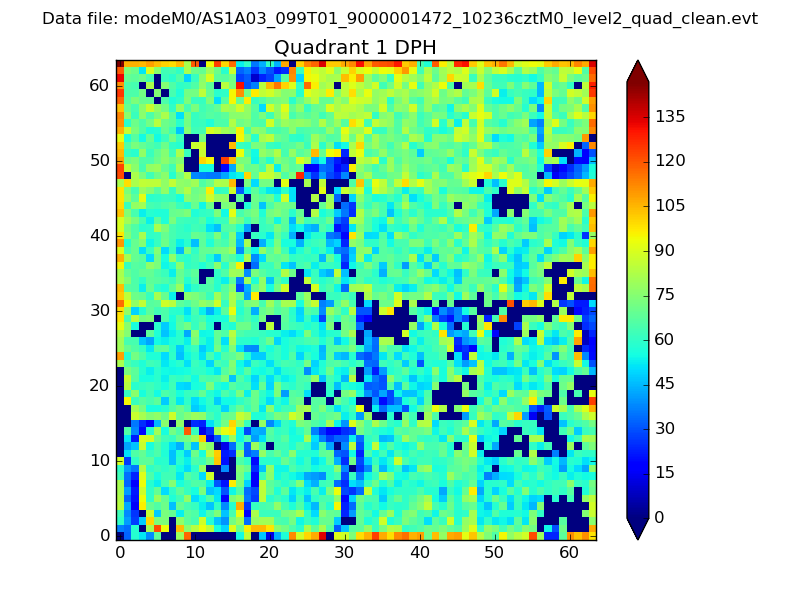 |
Quadrant B |
|---|---|---|---|
| Quadrant D | 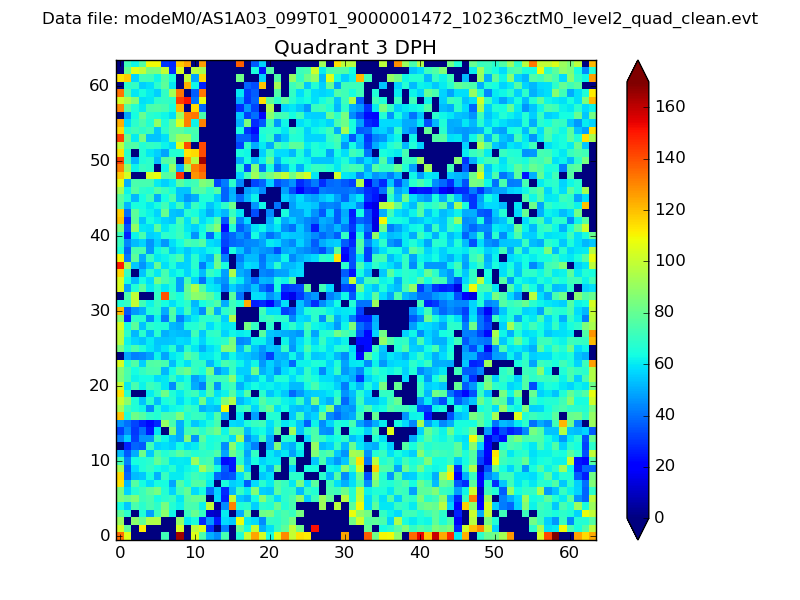 |
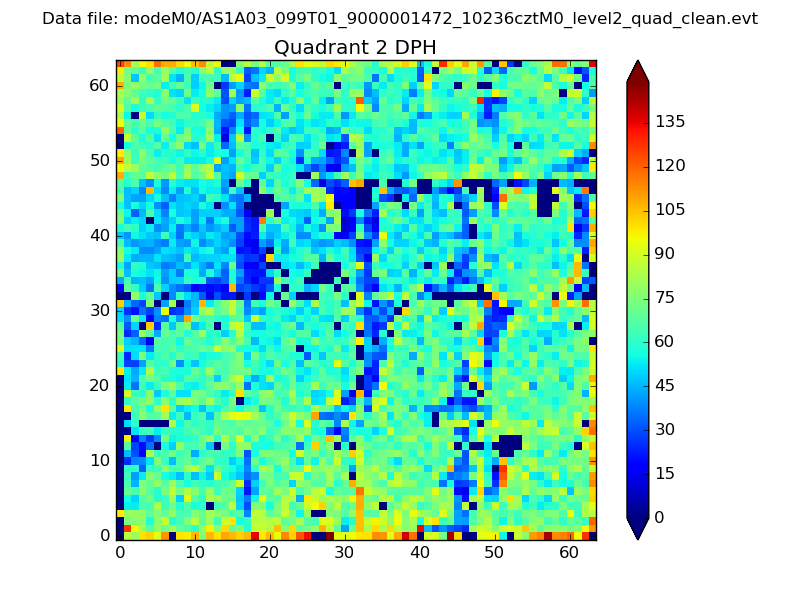 |
Quadrant C |
| Plot type | Count rate plots | Images |
|---|---|---|
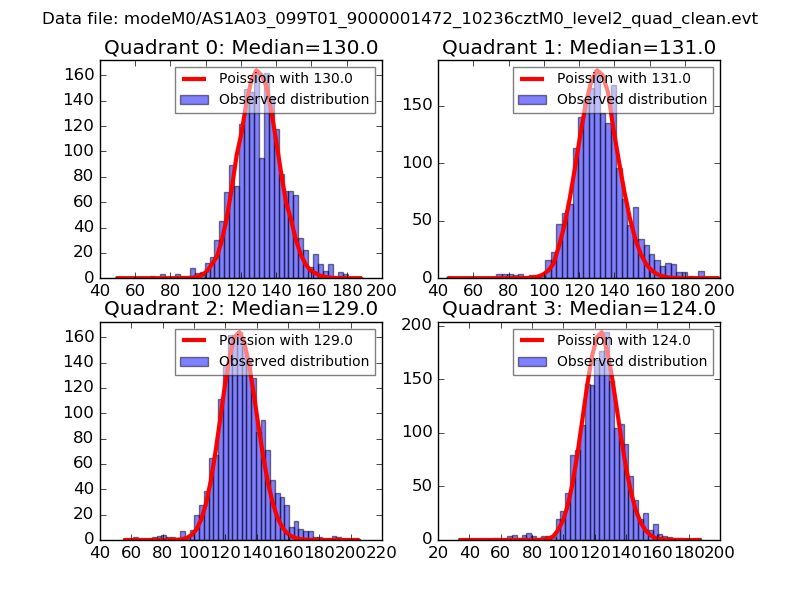
| Comparison with Poisson distribution Blue bars denote a histogram of data divided into 1 sec bins. Red curve is a Poisson curve with rate = median count rate of data. |
 |
 |
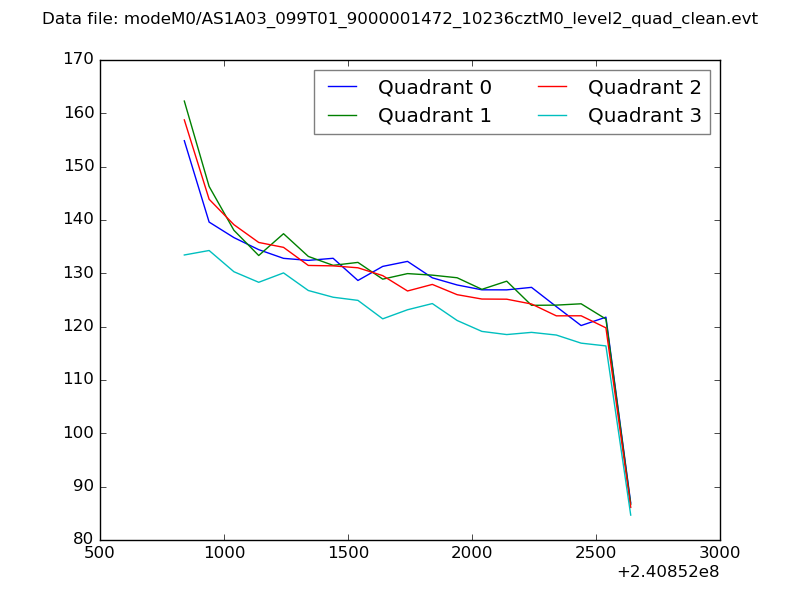
| Quadrant-wise count rates Data is divided into 100 sec bins |
 |
|
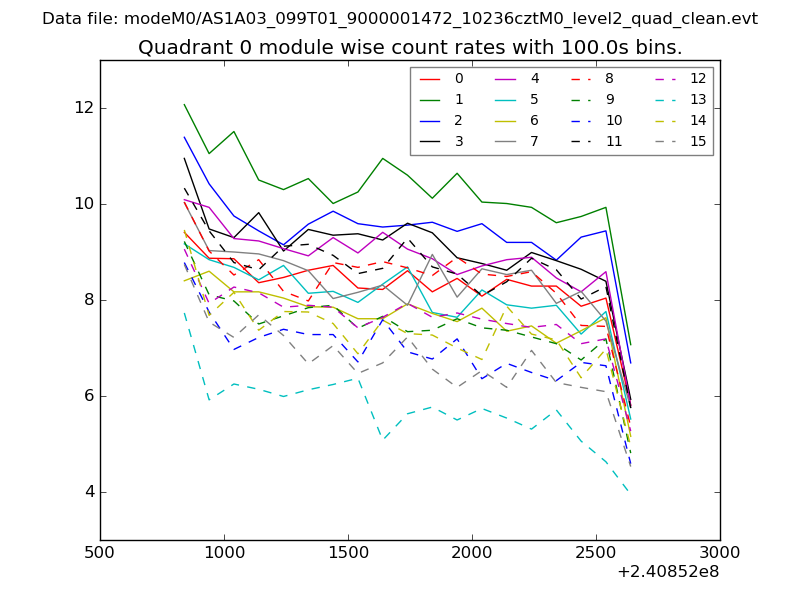
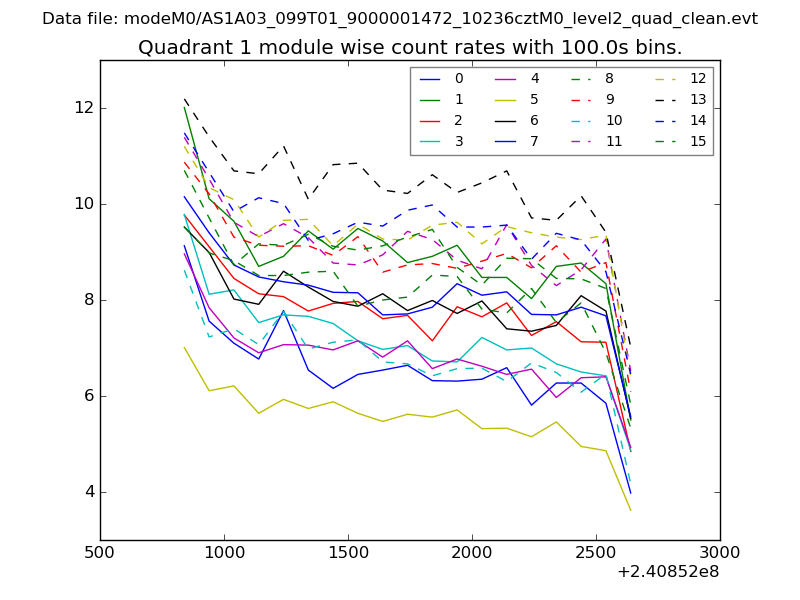
| Module-wise count rates for Quadrant A Data is divided into 100 sec bins |
 |
 |
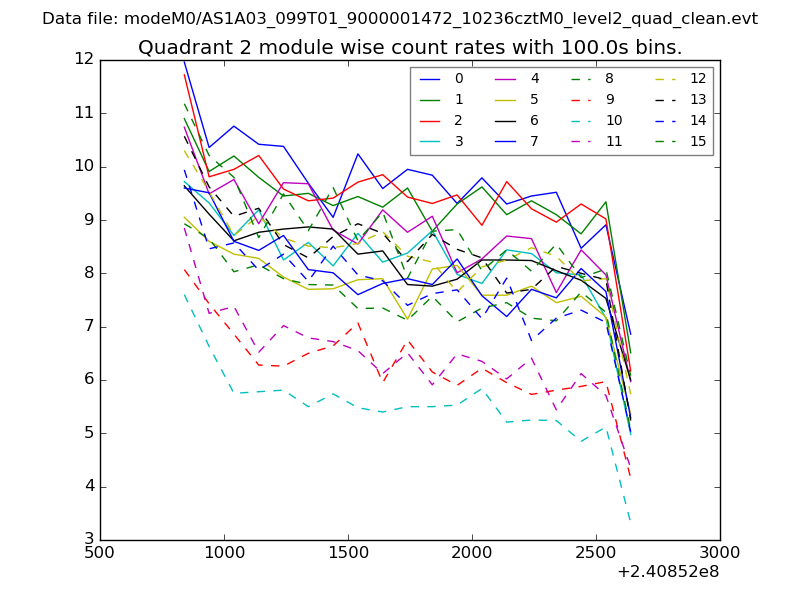
| Module-wise count rates for Quadrant B Data is divided into 100 sec bins |
 |
 |
| Module-wise count rates for Quadrant C Data is divided into 100 sec bins |
 |
 |
| Module-wise count rates for Quadrant D Data is divided into 100 sec bins |
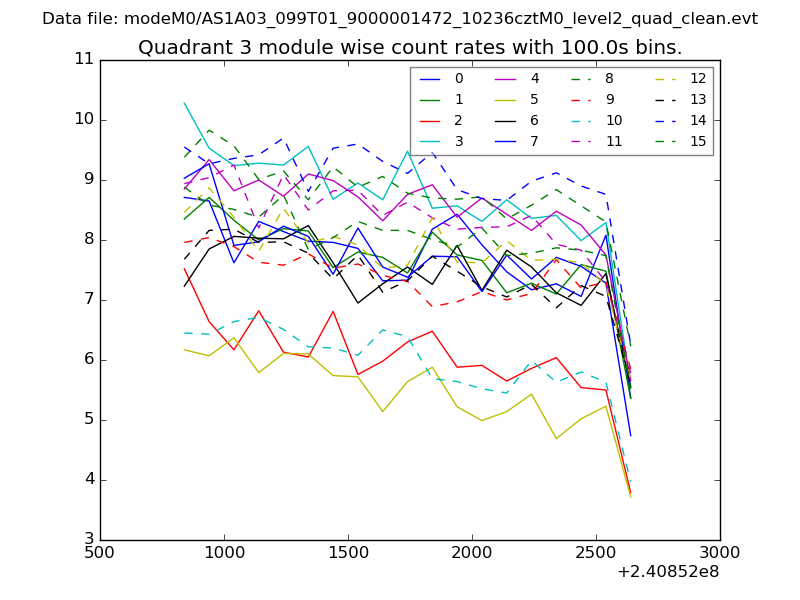 |
 |
| Parameter | Plot |
|---|---|
| CZT HV Monitor | 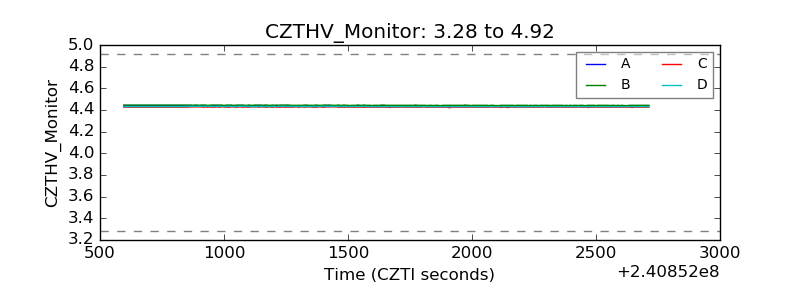 |
| D_VDD | 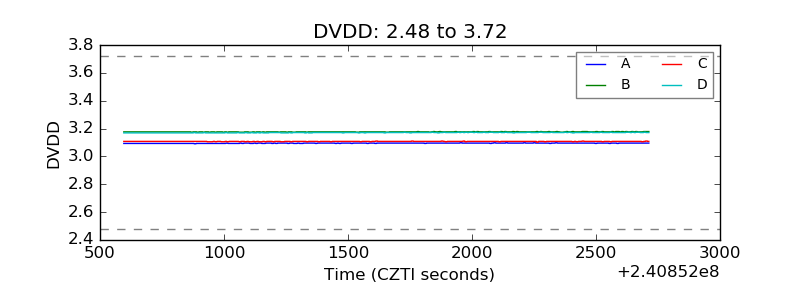 |
| Temperature 1 | 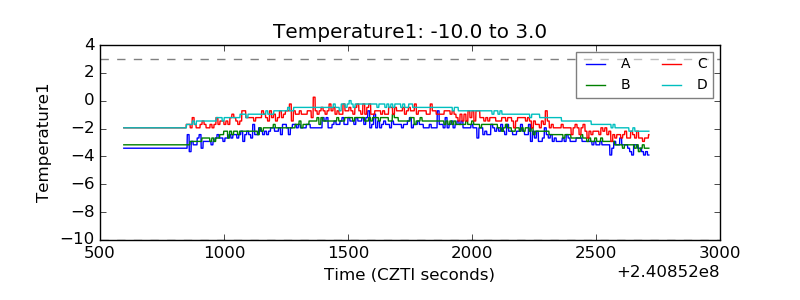 |
| Veto HV Monitor | 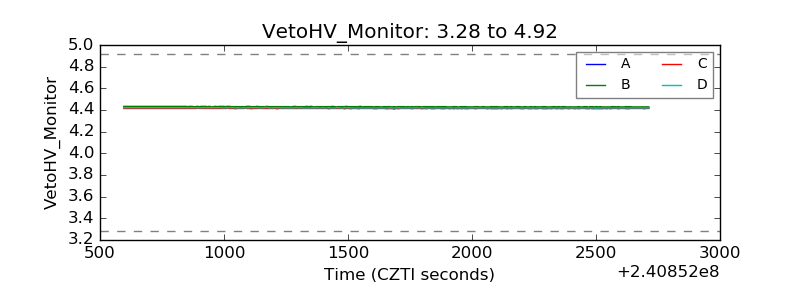 |
| Veto LLD | 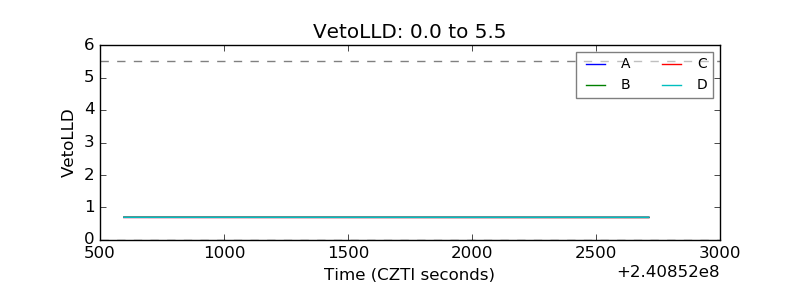 |
| Alpha Counter | 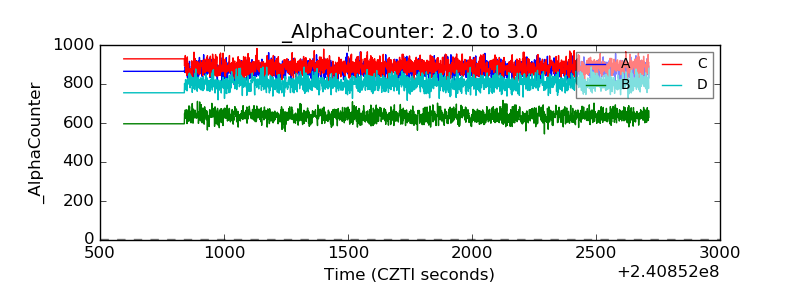 |
| _CPM_Rate | 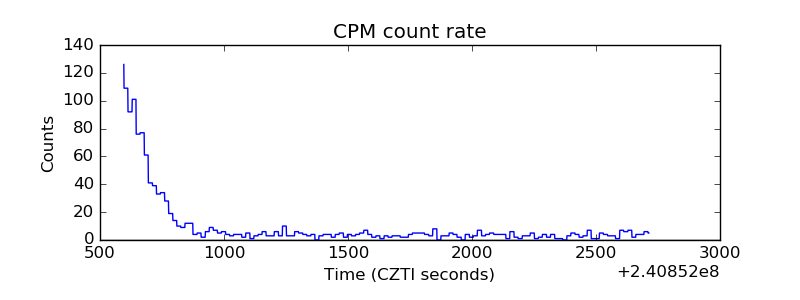 |
| CZT Counter | 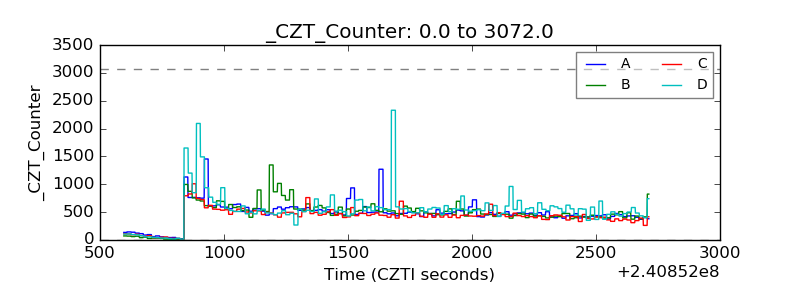 |
| +2.5 Volts monitor | 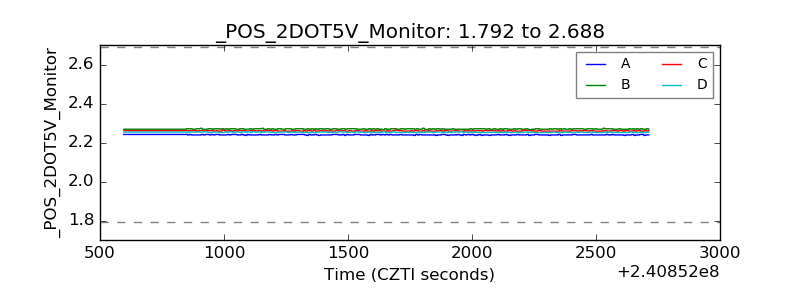 |
| +5 Volts monitor |  |
| _ROLL_ROT | 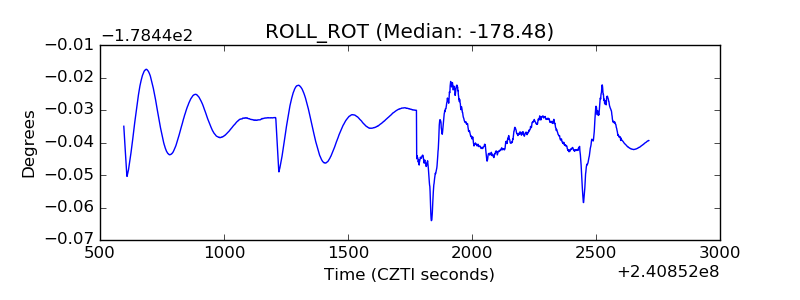 |
| _Roll_DEC | 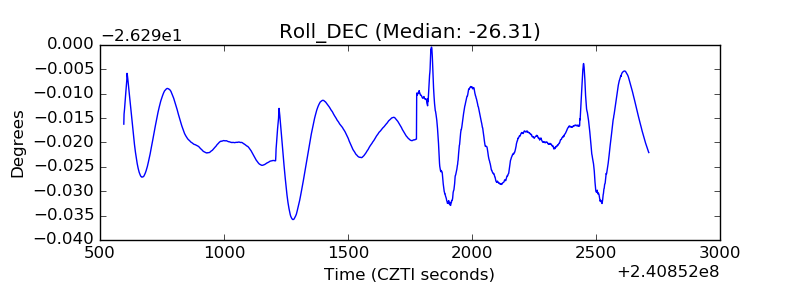 |
| _Roll_RA | 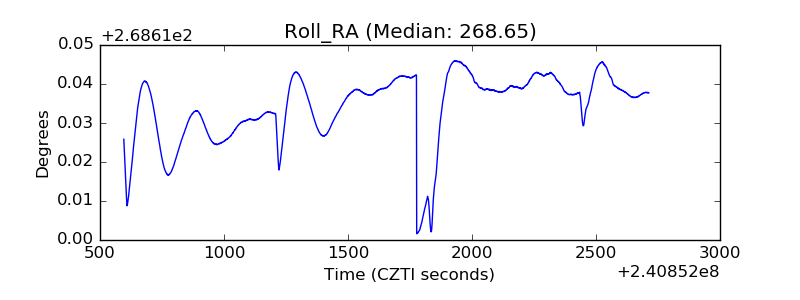 |
| Veto Counter | 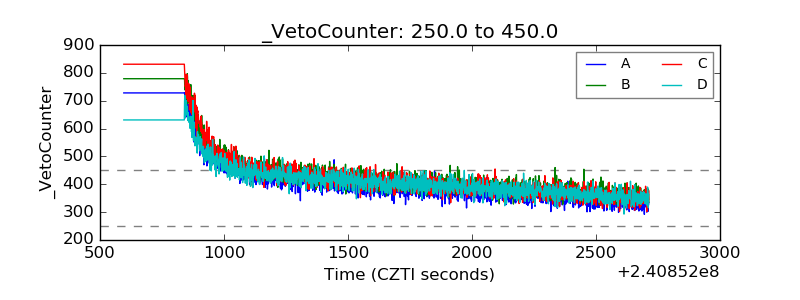 |