| Param | Original file | Final file |
|---|---|---|
| Filename | modeM0/AS1G07_027T01_9000001470cztM0_level2.fits | modeM0/AS1G07_027T01_9000001470cztM0_level2_quad_clean.evt |
| Size (bytes) | 198,878,400 | 197,320,320 |
| Size | 189.7 MB | 188.2 MB |
| Events in quadrant A | 1,195,900 | 1,180,114 |
| Events in quadrant B | 1,157,118 | 1,170,865 |
| Events in quadrant C | 1,180,210 | 1,124,222 |
| Events in quadrant D | 1,015,464 | 1,025,808 |
| Mode M0 | |||
|---|---|---|---|
| Quadrant | BADHDUFLAG | Total packets | Discarded packets |
| A | 0 | 46727 | 0 |
| B | 0 | 46744 | 0 |
| C | 0 | 44324 | 0 |
| D | 0 | 55292 | 0 |
| Mode SS | |||
|---|---|---|---|
| Quadrant | BADHDUFLAG | Total packets | Discarded packets |
| A | 0 | 436 | 0 |
| B | 0 | 436 | 0 |
| C | 0 | 436 | 0 |
| D | 0 | 436 | 0 |
| Mode M9 | |||
|---|---|---|---|
| Quadrant | BADHDUFLAG | Total packets | Discarded packets |
| A | 0 | 20 | 0 |
| B | 0 | 20 | 0 |
| C | 0 | 20 | 0 |
| D | 0 | 20 | 0 |
| Quadrant | Total seconds | Saturated seconds | Saturation percentage |
|---|---|---|---|
| A | 21411 | 522 | 2.437999% |
| B | 21411 | 451 | 2.106394% |
| C | 21411 | 237 | 1.106908% |
| D | 21411 | 390 | 1.821494% |
Noise dominated data is calculated using 1-second bins in cleaned event files. If a bin has >2000 counts, and if more than 50% of those come from <1% of pixels, then it is considered to be noise-dominated and hence unusable.
| Quadrant | # 1 sec bins | Bins with >0 counts | Bins with >2000 counts | High rate bins dominated by noise | Noise dominated (total time) | Noise dominated (detector-on time) | Marked lightcurve |
|---|---|---|---|---|---|---|---|
| A | 23371 | 21408 | 0 | 0 | 0.00% | 0.00% |  |
| B | 23371 | 21411 | 0 | 0 | 0.00% | 0.00% |  |
| C | 23371 | 21410 | 0 | 0 | 0.00% | 0.00% |  |
| D | 23371 | 21410 | 0 | 0 | 0.00% | 0.00% |  |
Top three noisy pixels from each quadrant. If the there are fewer than three noisy pixels in the level2.evt file, extra rows are filled as -1
| Pixel properties | Quadrant properties | ||||||
|---|---|---|---|---|---|---|---|
| Quadrant | DetID | PixID | Counts | Sigma | Mean | Median | Sigma |
| A | 0 | 29 | 1185 | 11.24 | 310 | 290 | 79.6 |
| A | 14 | 188 | 1170 | 11.05 | 310 | 290 | 79.6 |
| A | 14 | 204 | 1038 | 9.39 | 310 | 290 | 79.6 |
| B | 2 | 9 | 1015 | 11.8 | 304 | 288 | 61.6 |
| B | 14 | 254 | 805 | 8.39 | 304 | 288 | 61.6 |
| B | 3 | 17 | 795 | 8.23 | 304 | 288 | 61.6 |
| C | 1 | 81 | 873 | 7.02 | 311 | 288 | 83.3 |
| C | 1 | 80 | 869 | 6.97 | 311 | 288 | 83.3 |
| C | 12 | 241 | 837 | 6.59 | 311 | 288 | 83.3 |
| D | 3 | 14 | 752 | 6.21 | 289 | 262 | 78.9 |
| D | 1 | 19 | 721 | 5.81 | 289 | 262 | 78.9 |
| D | 7 | 5 | 718 | 5.78 | 289 | 262 | 78.9 |
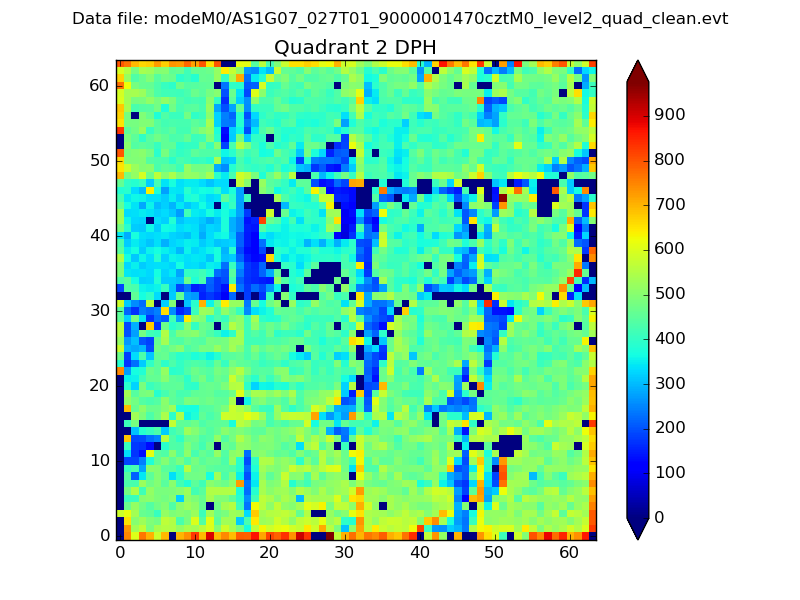
Histogram calculated using DETX and DETY for each event in the final _common_clean file
| Quadrant A |  |
 |
Quadrant B |
|---|---|---|---|
| Quadrant D |  |
 |
Quadrant C |
| Plot type | Count rate plots | Images |
|---|---|---|
| Comparison with Poisson distribution Blue bars denote a histogram of data divided into 1 sec bins. Red curve is a Poisson curve with rate = median count rate of data. |
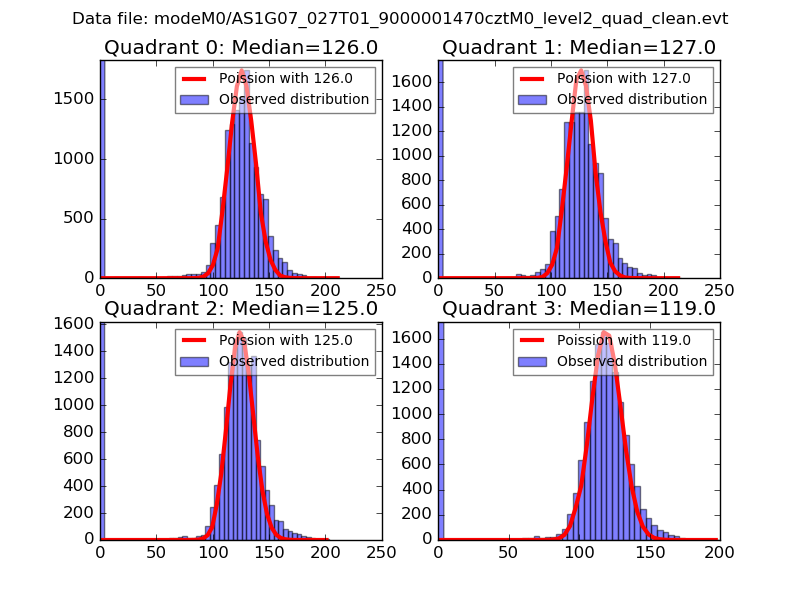 |
 |
| Quadrant-wise count rates Data is divided into 100 sec bins |
 |
|
| Module-wise count rates for Quadrant A Data is divided into 100 sec bins |
 |
 |
| Module-wise count rates for Quadrant B Data is divided into 100 sec bins |
 |
 |
| Module-wise count rates for Quadrant C Data is divided into 100 sec bins |
 |
 |
| Module-wise count rates for Quadrant D Data is divided into 100 sec bins |
 |
 |
| Parameter | Plot |
|---|---|
| CZT HV Monitor |  |
| D_VDD | 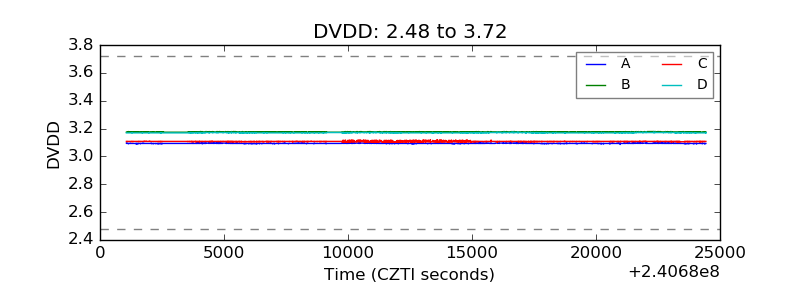 |
| Temperature 1 |  |
| Veto HV Monitor |  |
| Veto LLD |  |
| Alpha Counter |  |
| _CPM_Rate |  |
| CZT Counter |  |
| +2.5 Volts monitor |  |
| +5 Volts monitor |  |
| _ROLL_ROT | 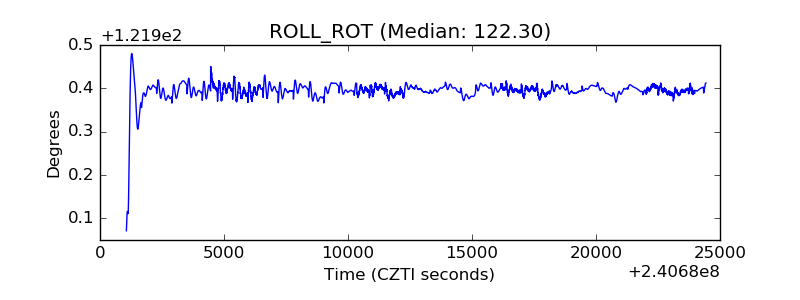 |
| _Roll_DEC |  |
| _Roll_RA |  |
| Veto Counter |  |