| Param | Original file | Final file |
|---|---|---|
| Filename | modeM0/AS1G07_027T01_9000001470_10206cztM0_level2.evt | modeM0/AS1G07_027T01_9000001470_10206cztM0_level2_quad_clean.evt |
| Size (bytes) | 237,231,360 | 33,454,080 |
| Size | 226.2 MB | 31.9 MB |
| Events in quadrant A | 1,965,615 | 198,099 |
| Events in quadrant B | 1,540,362 | 210,738 |
| Events in quadrant C | 1,436,947 | 203,768 |
| Events in quadrant D | 2,042,226 | 192,265 |
| Mode M0 | |||
|---|---|---|---|
| Quadrant | BADHDUFLAG | Total packets | Discarded packets |
| A | 0 | 7661 | 2 |
| B | 0 | 6375 | 1 |
| C | 0 | 6100 | 1 |
| D | 0 | 8136 | 1 |
| Mode SS | |||
|---|---|---|---|
| Quadrant | BADHDUFLAG | Total packets | Discarded packets |
| A | 0 | 60 | 0 |
| B | 0 | 60 | 0 |
| C | 0 | 60 | 0 |
| D | 0 | 60 | 0 |
| Mode M9 | |||
|---|---|---|---|
| Quadrant | BADHDUFLAG | Total packets | Discarded packets |
| A | 0 | 10 | 0 |
| B | 0 | 10 | 0 |
| C | 0 | 10 | 0 |
| D | 0 | 10 | 0 |
| Quadrant | Total seconds | Saturated seconds | Saturation percentage |
|---|---|---|---|
| A | 2910 | 282 | 9.690722% |
| B | 2910 | 90 | 3.092784% |
| C | 2910 | 84 | 2.886598% |
| D | 2910 | 121 | 4.158076% |
Noise dominated data is calculated using 1-second bins in cleaned event files. If a bin has >2000 counts, and if more than 50% of those come from <1% of pixels, then it is considered to be noise-dominated and hence unusable.
| Quadrant | # 1 sec bins | Bins with >0 counts | Bins with >2000 counts | High rate bins dominated by noise | Noise dominated (total time) | Noise dominated (detector-on time) | Marked lightcurve |
|---|---|---|---|---|---|---|---|
| A | 3860 | 2910 | 139 | 139 | 3.60% | 4.78% | 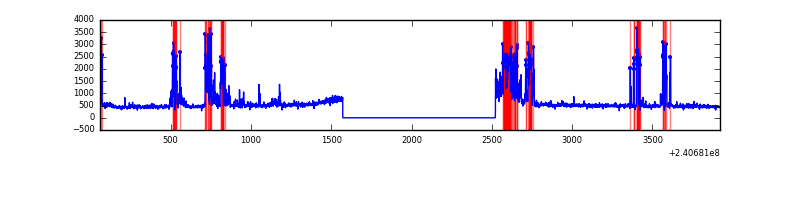 |
| B | 3860 | 2911 | 3 | 3 | 0.08% | 0.10% | 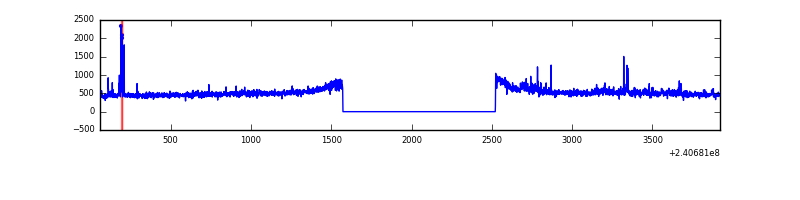 |
| C | 3860 | 2910 | 0 | 0 | 0.00% | 0.00% | 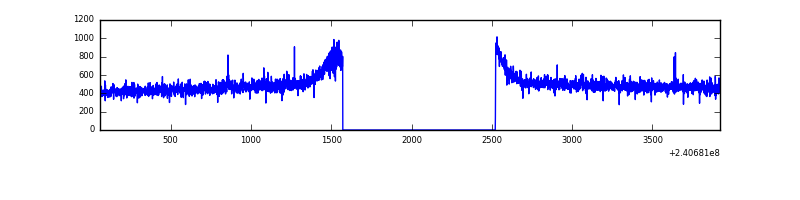 |
| D | 3860 | 2910 | 8 | 8 | 0.21% | 0.27% | 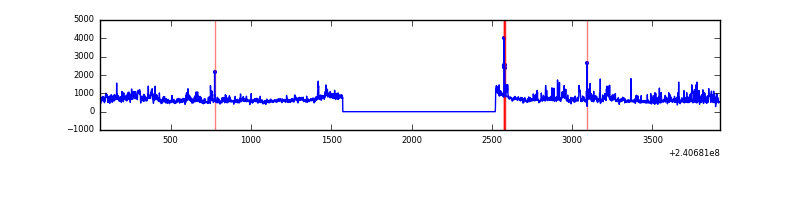 |
Top three noisy pixels from each quadrant. If the there are fewer than three noisy pixels in the level2.evt file, extra rows are filled as -1
| Pixel properties | Quadrant properties | ||||||
|---|---|---|---|---|---|---|---|
| Quadrant | DetID | PixID | Counts | Sigma | Mean | Median | Sigma |
| A | 15 | 223 | 343411 | 4474.7 | 367 | 359 | 76.7 |
| A | 15 | 239 | 156853 | 2041.28 | 367 | 359 | 76.7 |
| A | 15 | 255 | 24331 | 312.69 | 367 | 359 | 76.7 |
| B | 0 | 214 | 38717 | 514.32 | 377 | 367 | 74.6 |
| B | 4 | 239 | 23874 | 315.26 | 377 | 367 | 74.6 |
| B | 12 | 111 | 8059 | 103.16 | 377 | 367 | 74.6 |
| C | 0 | 207 | 7184 | 79.27 | 366 | 367 | 86.0 |
| C | 13 | 61 | 2756 | 27.78 | 366 | 367 | 86.0 |
| C | 14 | 67 | 1086 | 8.36 | 366 | 367 | 86.0 |
| D | 13 | 122 | 191624 | 1995.38 | 360 | 353 | 95.9 |
| D | 1 | 52 | 172384 | 1794.67 | 360 | 353 | 95.9 |
| D | 8 | 195 | 169218 | 1761.64 | 360 | 353 | 95.9 |
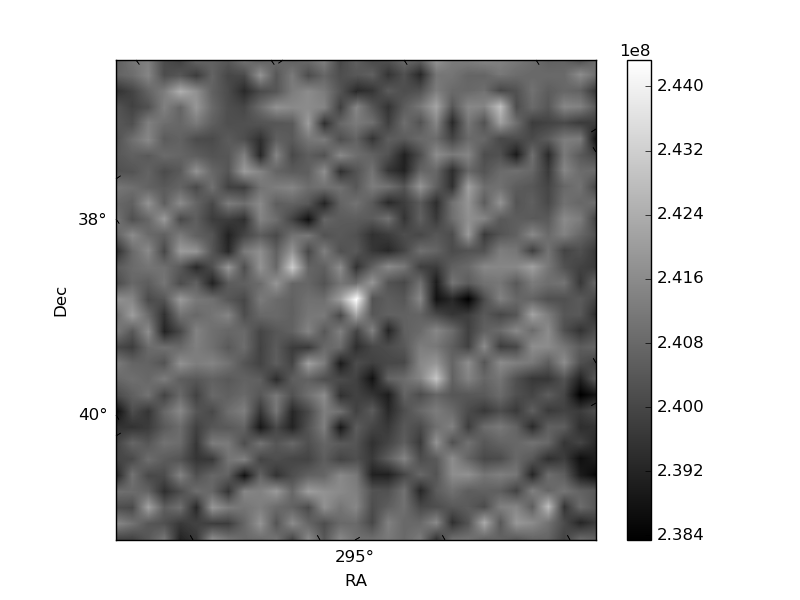
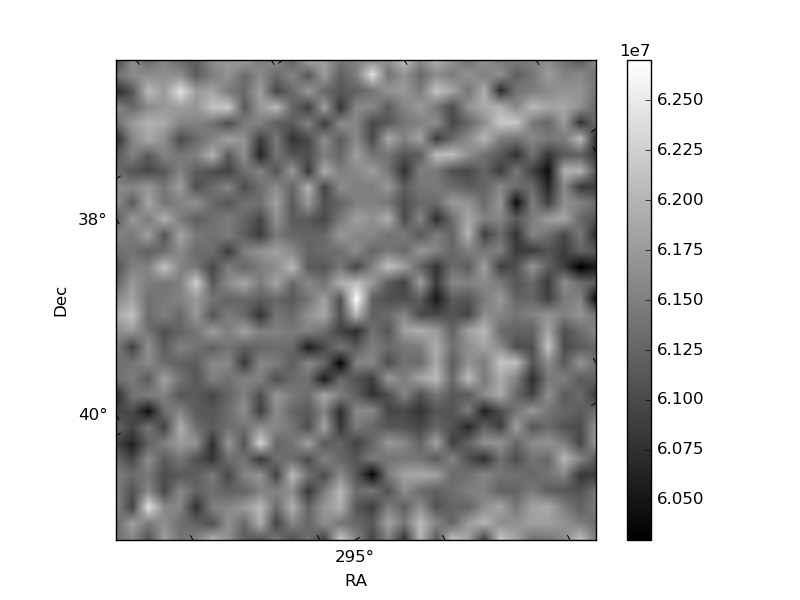
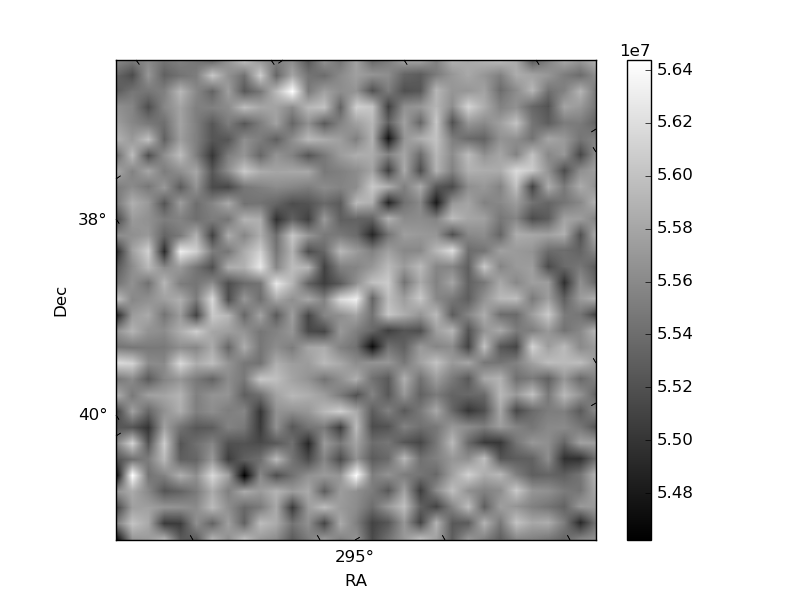
Histogram calculated using DETX and DETY for each event in the final _common_clean file
| Quadrant A | 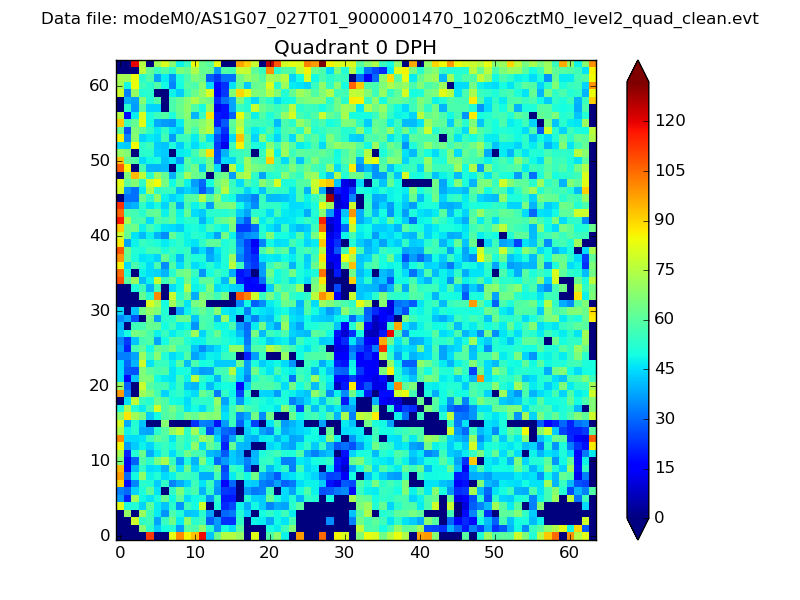 |
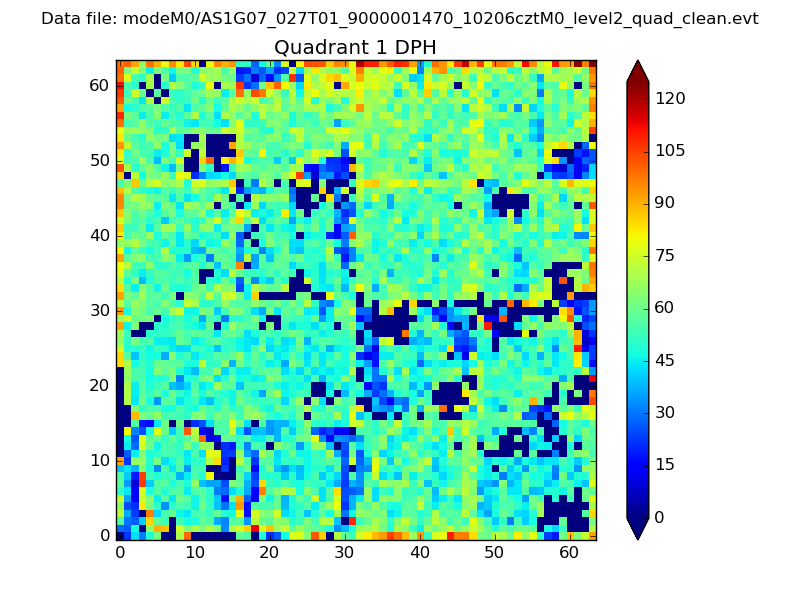 |
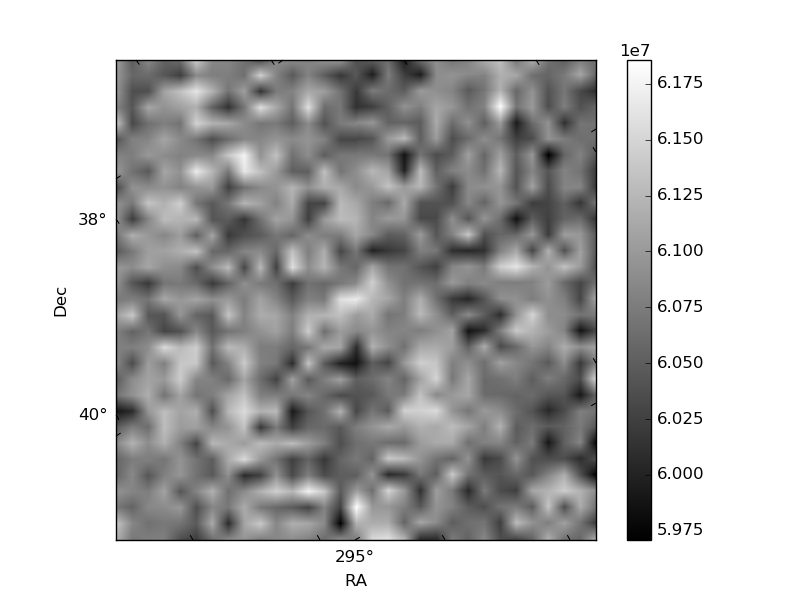
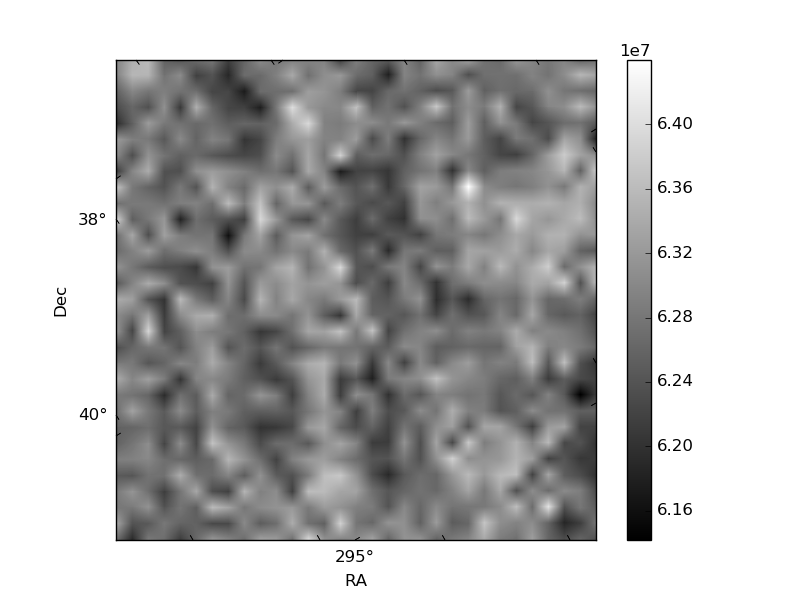
Quadrant B |
|---|---|---|---|
| Quadrant D | 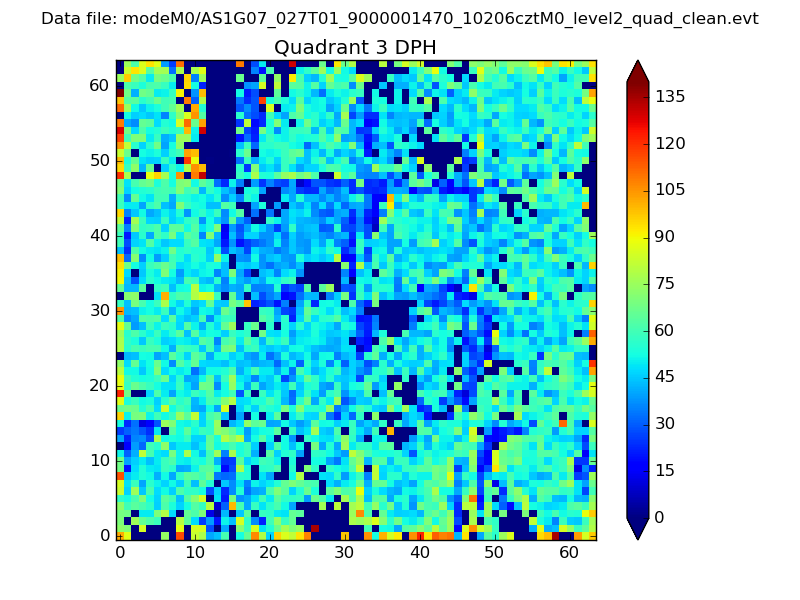 |
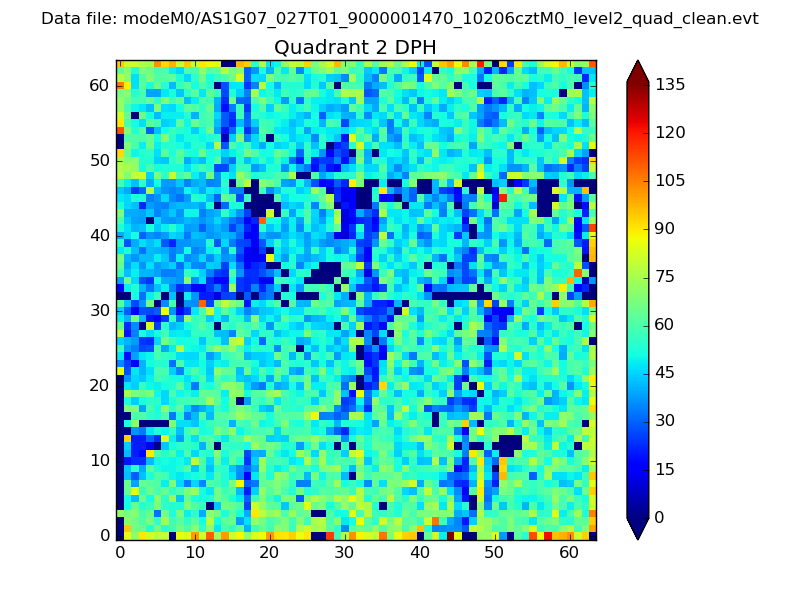 |
Quadrant C |
| Plot type | Count rate plots | Images |
|---|---|---|
| Comparison with Poisson distribution Blue bars denote a histogram of data divided into 1 sec bins. Red curve is a Poisson curve with rate = median count rate of data. |
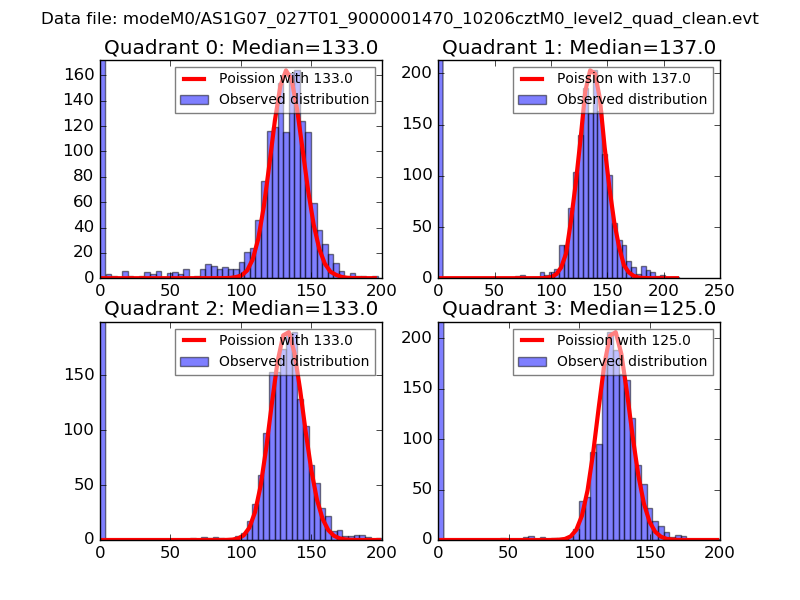 |
 |
| Quadrant-wise count rates Data is divided into 100 sec bins |
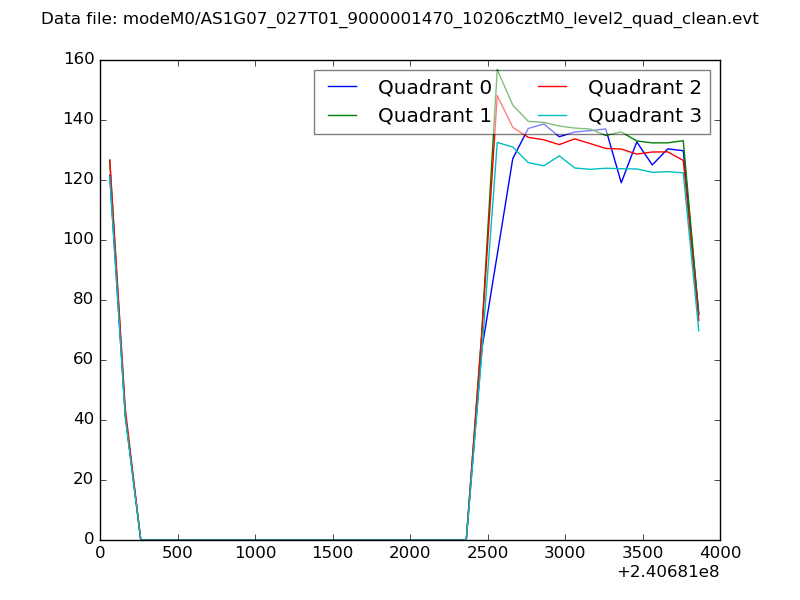 |
|
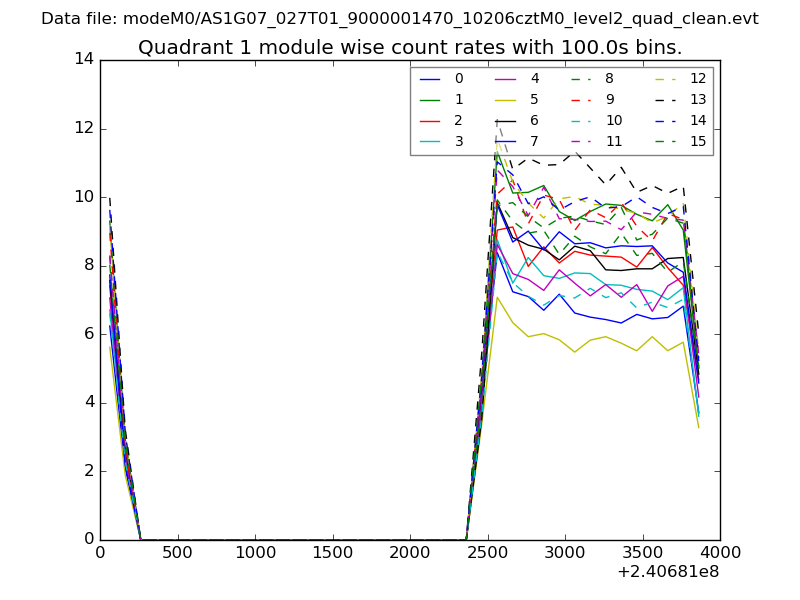
| Module-wise count rates for Quadrant A Data is divided into 100 sec bins |
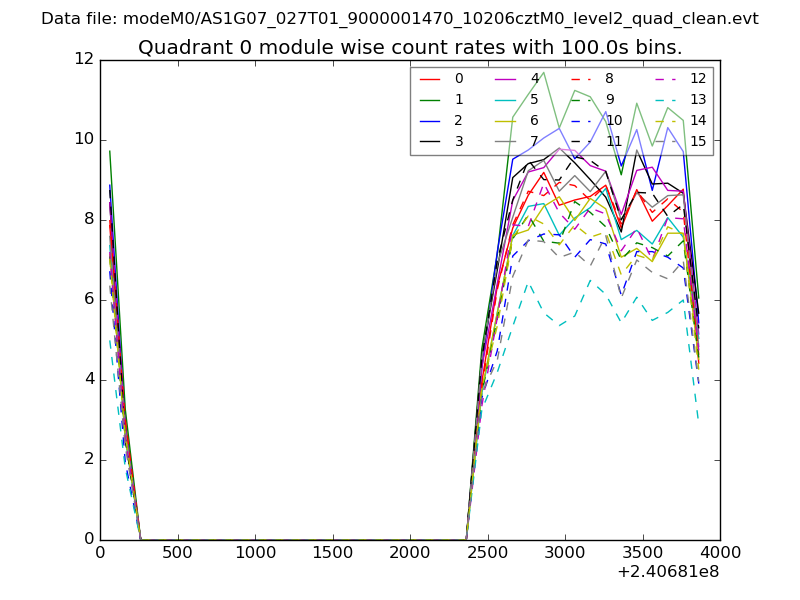 |
 |
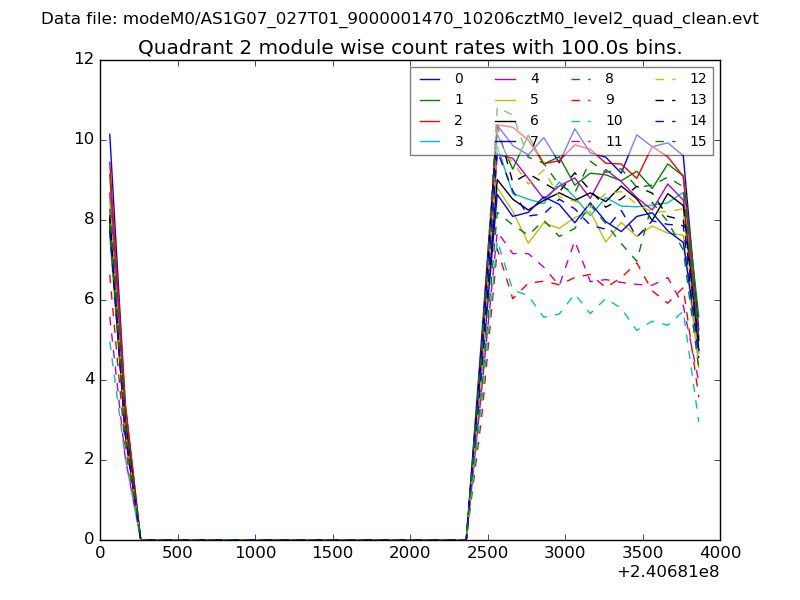
| Module-wise count rates for Quadrant B Data is divided into 100 sec bins |
 |
 |
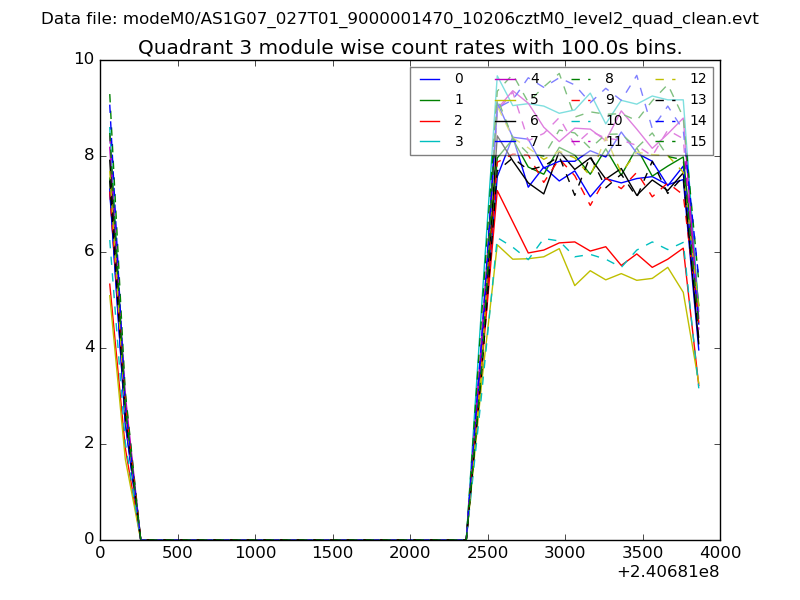
| Module-wise count rates for Quadrant C Data is divided into 100 sec bins |
 |
 |
| Module-wise count rates for Quadrant D Data is divided into 100 sec bins |
 |
 |
| Parameter | Plot |
|---|---|
| CZT HV Monitor | 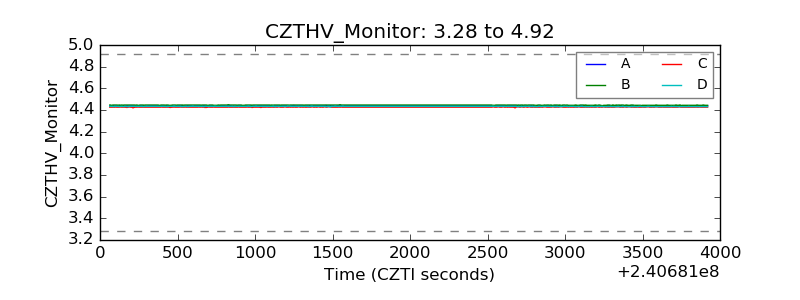 |
| D_VDD | 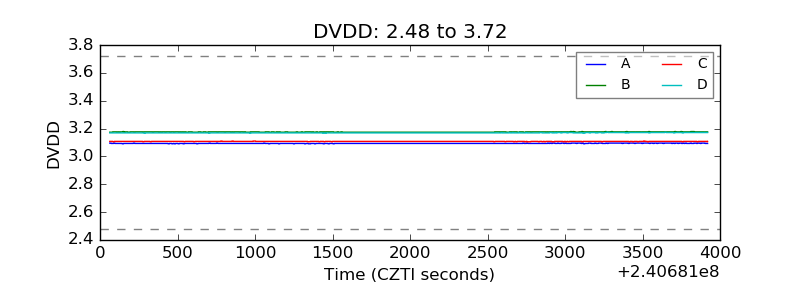 |
| Temperature 1 |  |
| Veto HV Monitor | 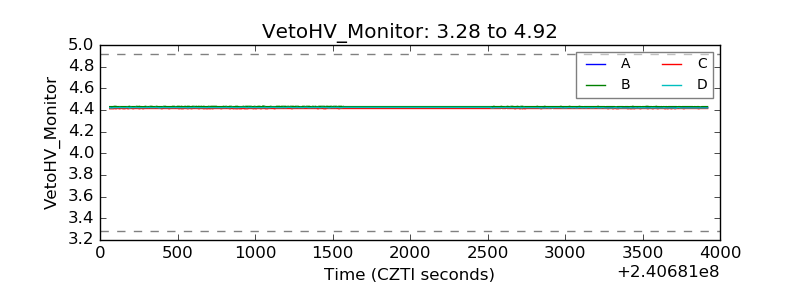 |
| Veto LLD |  |
| Alpha Counter | 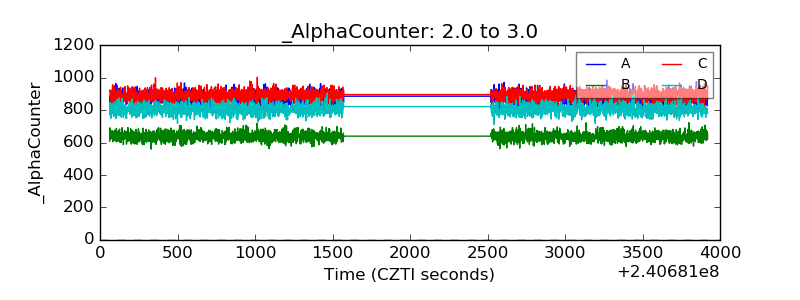 |
| _CPM_Rate | 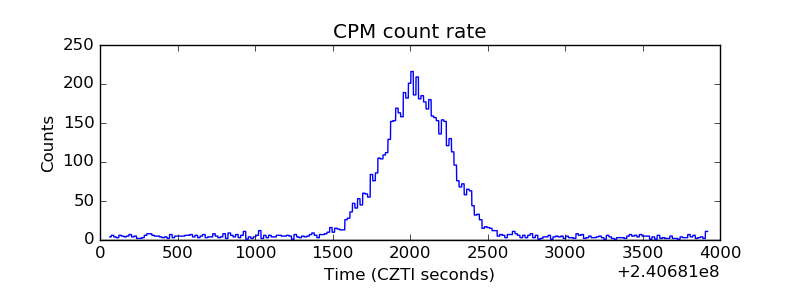 |
| CZT Counter | 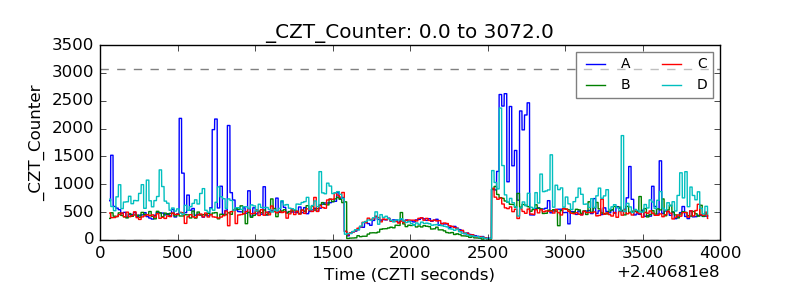 |
| +2.5 Volts monitor |  |
| +5 Volts monitor | 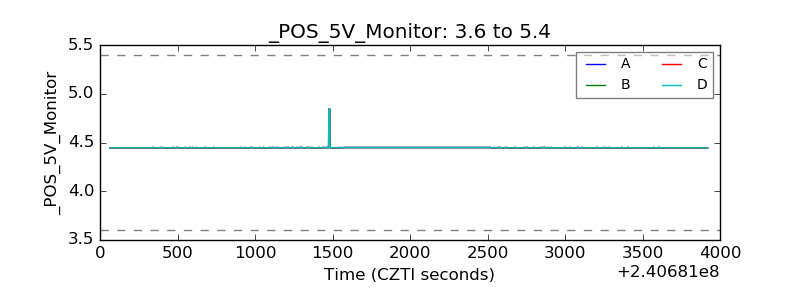 |
| _ROLL_ROT | 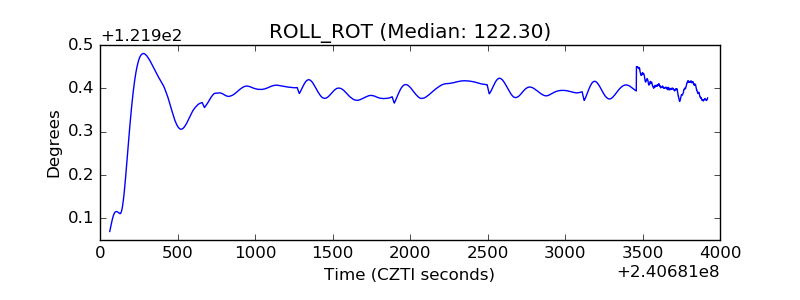 |
| _Roll_DEC | 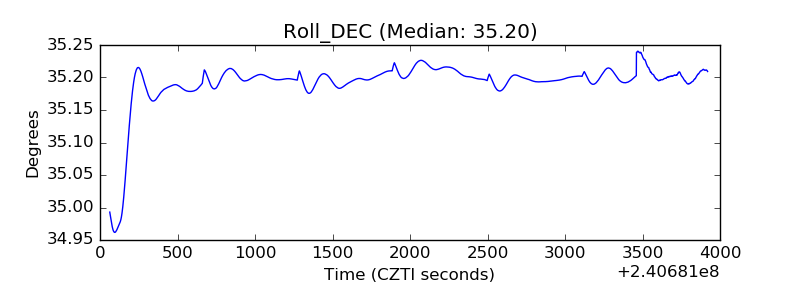 |
| _Roll_RA | 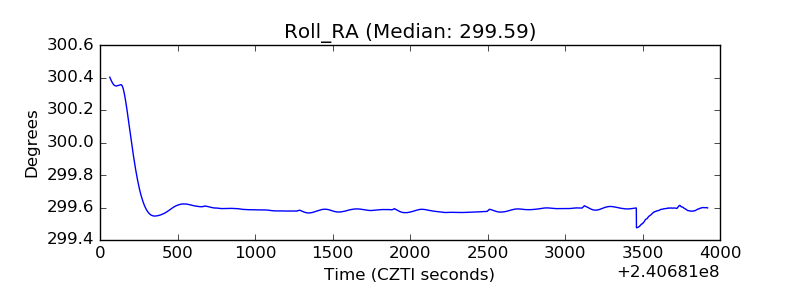 |
| Veto Counter | 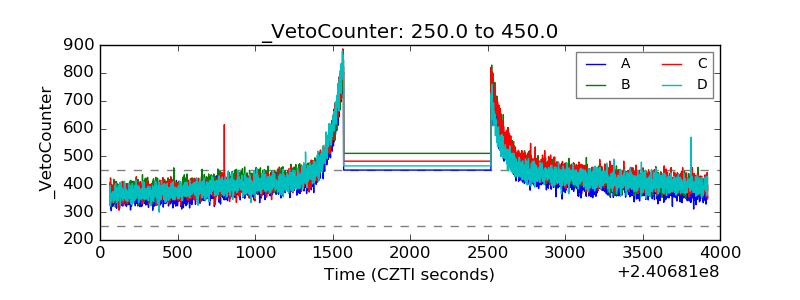 |