| Param | Original file | Final file |
|---|---|---|
| Filename | modeM0/AS1G07_027T01_9000001470_10210cztM0_level2.evt | modeM0/AS1G07_027T01_9000001470_10210cztM0_level2_quad_clean.evt |
| Size (bytes) | 183,179,520 | 47,039,040 |
| Size | 174.7 MB | 44.9 MB |
| Events in quadrant A | 1,183,769 | 314,669 |
| Events in quadrant B | 1,381,415 | 315,998 |
| Events in quadrant C | 1,185,812 | 315,516 |
| Events in quadrant D | 1,623,785 | 297,729 |
| Mode M0 | |||
|---|---|---|---|
| Quadrant | BADHDUFLAG | Total packets | Discarded packets |
| A | 0 | 5394 | 1 |
| B | 0 | 5844 | 1 |
| C | 0 | 5367 | 1 |
| D | 0 | 6537 | 1 |
| Mode SS | |||
|---|---|---|---|
| Quadrant | BADHDUFLAG | Total packets | Discarded packets |
| A | 0 | 52 | 0 |
| B | 0 | 52 | 0 |
| C | 0 | 52 | 0 |
| D | 0 | 52 | 0 |
| Mode M9 | |||
|---|---|---|---|
| Quadrant | BADHDUFLAG | Total packets | Discarded packets |
| A | 0 | 2 | 0 |
| B | 0 | 2 | 0 |
| C | 0 | 2 | 0 |
| D | 0 | 2 | 0 |
| Quadrant | Total seconds | Saturated seconds | Saturation percentage |
|---|---|---|---|
| A | 2512 | 50 | 1.990446% |
| B | 2512 | 76 | 3.025478% |
| C | 2512 | 33 | 1.313694% |
| D | 2512 | 55 | 2.189490% |
Noise dominated data is calculated using 1-second bins in cleaned event files. If a bin has >2000 counts, and if more than 50% of those come from <1% of pixels, then it is considered to be noise-dominated and hence unusable.
| Quadrant | # 1 sec bins | Bins with >0 counts | Bins with >2000 counts | High rate bins dominated by noise | Noise dominated (total time) | Noise dominated (detector-on time) | Marked lightcurve |
|---|---|---|---|---|---|---|---|
| A | 2727 | 2513 | 0 | 0 | 0.00% | 0.00% | 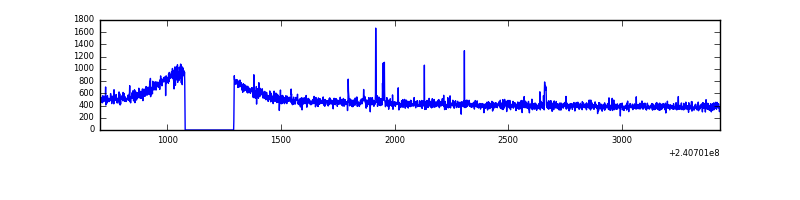 |
| B | 2727 | 2513 | 7 | 7 | 0.26% | 0.28% | 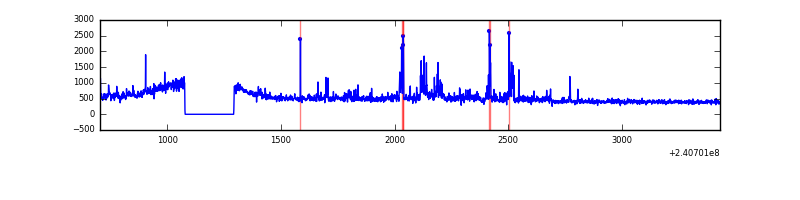 |
| C | 2727 | 2513 | 1 | 1 | 0.04% | 0.04% | 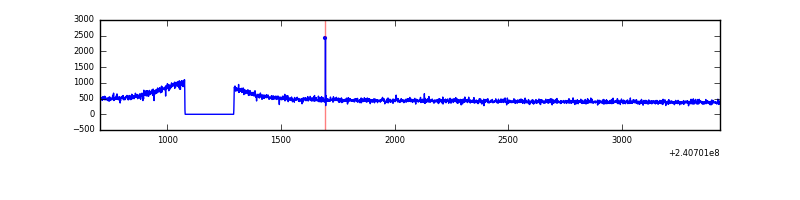 |
| D | 2727 | 2513 | 11 | 11 | 0.40% | 0.44% | 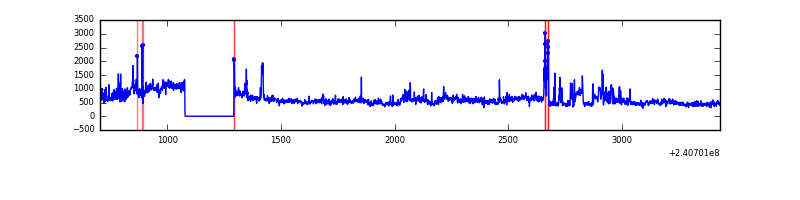 |
Top three noisy pixels from each quadrant. If the there are fewer than three noisy pixels in the level2.evt file, extra rows are filled as -1
| Pixel properties | Quadrant properties | ||||||
|---|---|---|---|---|---|---|---|
| Quadrant | DetID | PixID | Counts | Sigma | Mean | Median | Sigma |
| A | 15 | 223 | 7343 | 110.5 | 303 | 296 | 63.8 |
| A | 15 | 239 | 5402 | 80.06 | 303 | 296 | 63.8 |
| A | 8 | 15 | 4113 | 59.85 | 303 | 296 | 63.8 |
| B | 11 | 51 | 77160 | 1257.4 | 305 | 297 | 61.1 |
| B | 4 | 239 | 74120 | 1207.67 | 305 | 297 | 61.1 |
| B | 0 | 214 | 32090 | 520.1 | 305 | 297 | 61.1 |
| C | 14 | 67 | 3039 | 37.88 | 302 | 303 | 72.2 |
| C | 12 | 4 | 2550 | 31.11 | 302 | 303 | 72.2 |
| C | 13 | 61 | 2230 | 26.68 | 302 | 303 | 72.2 |
| D | 1 | 52 | 277083 | 3773.27 | 297 | 289 | 73.4 |
| D | 8 | 195 | 122452 | 1665.33 | 297 | 289 | 73.4 |
| D | 2 | 16 | 37492 | 507.15 | 297 | 289 | 73.4 |
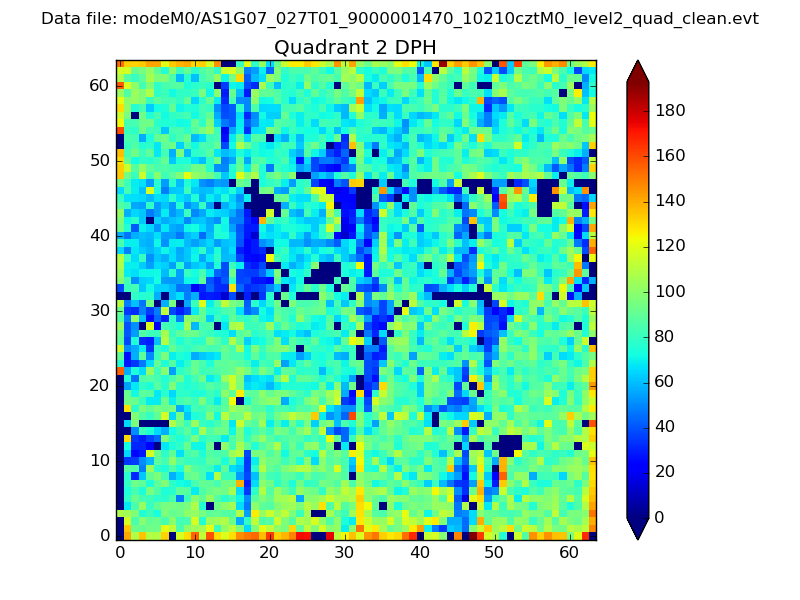
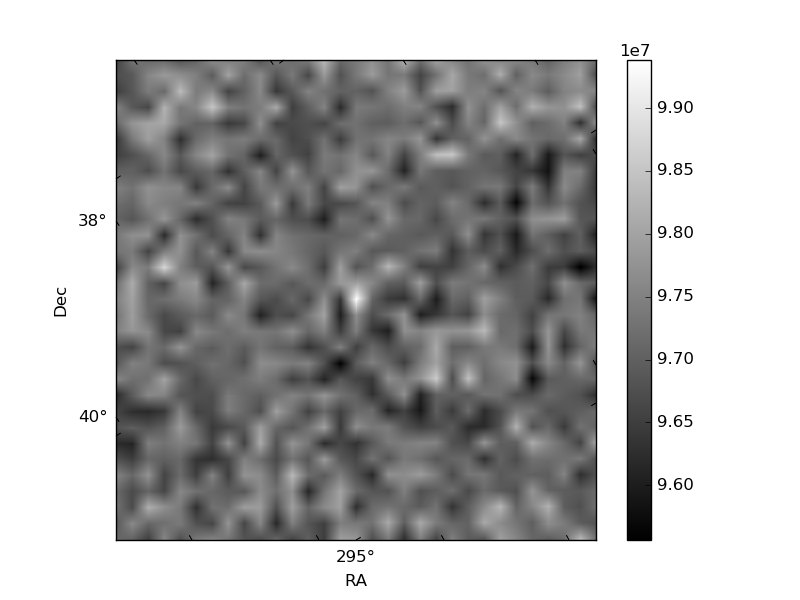
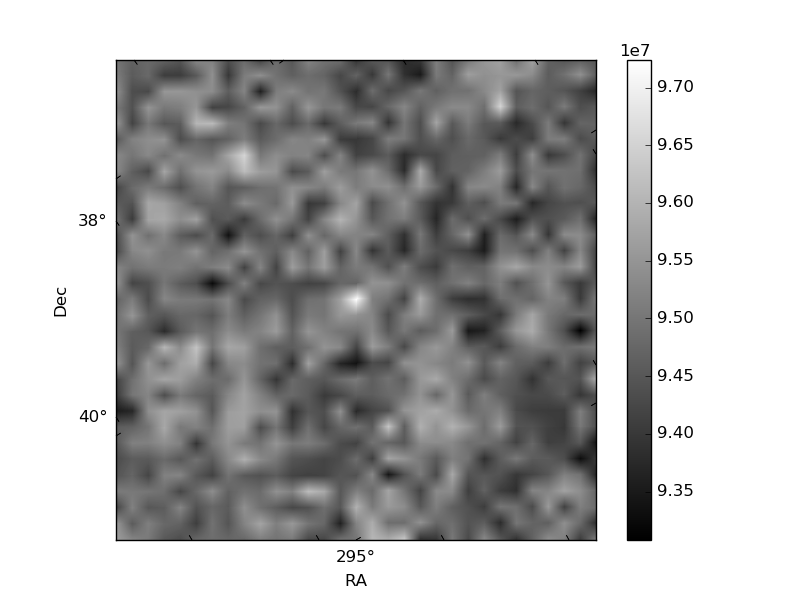
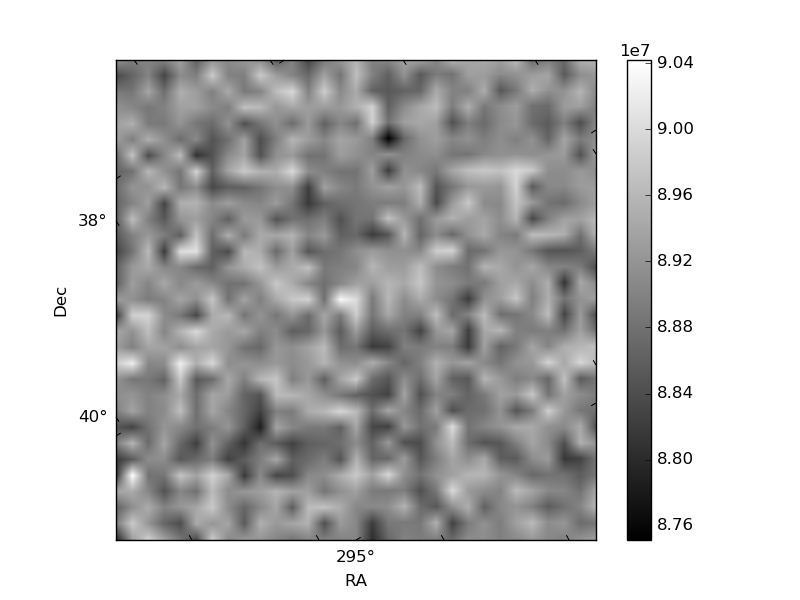
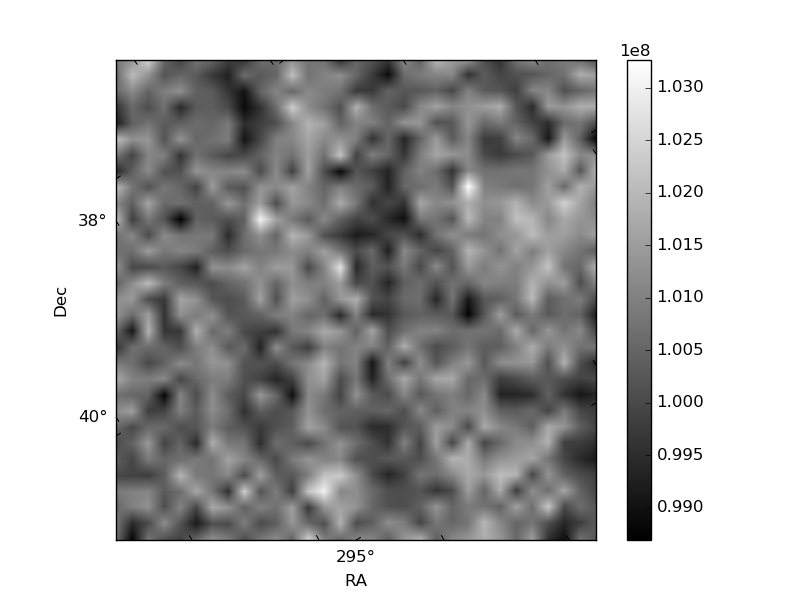
Histogram calculated using DETX and DETY for each event in the final _common_clean file
| Quadrant A | 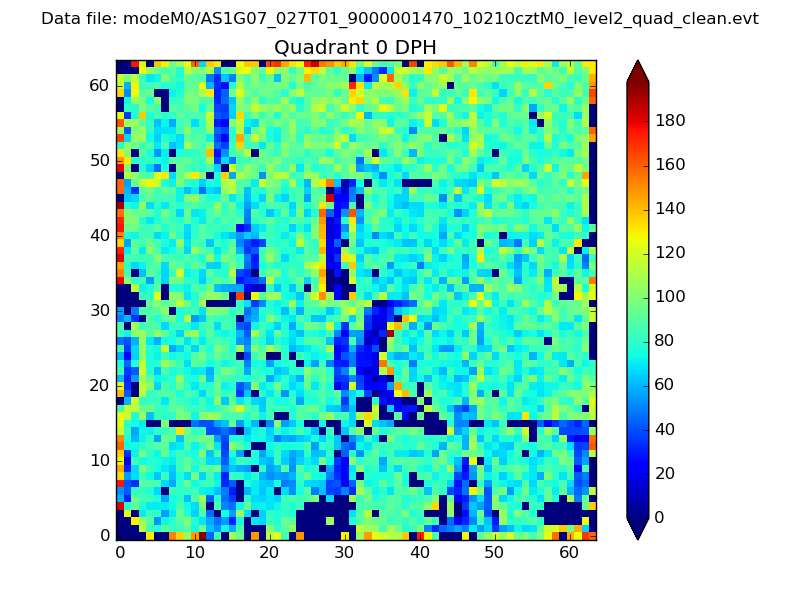 |
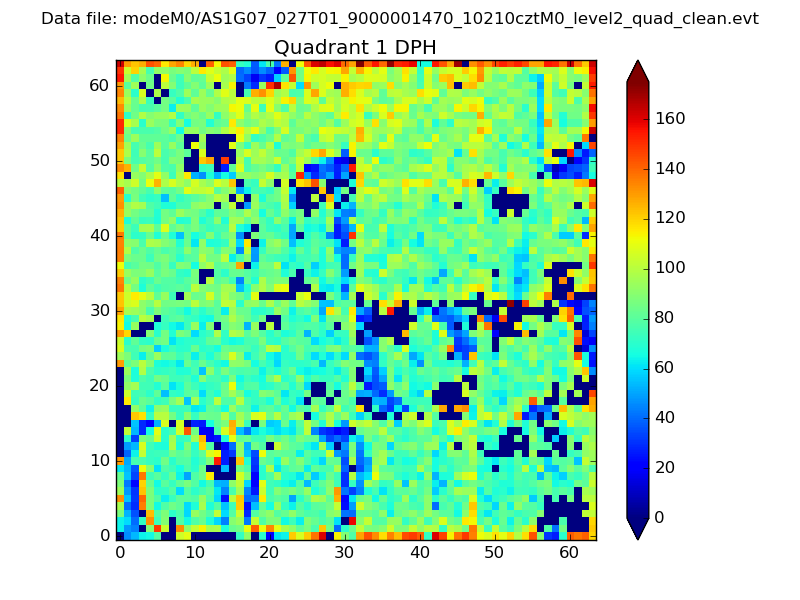 |
Quadrant B |
|---|---|---|---|
| Quadrant D | 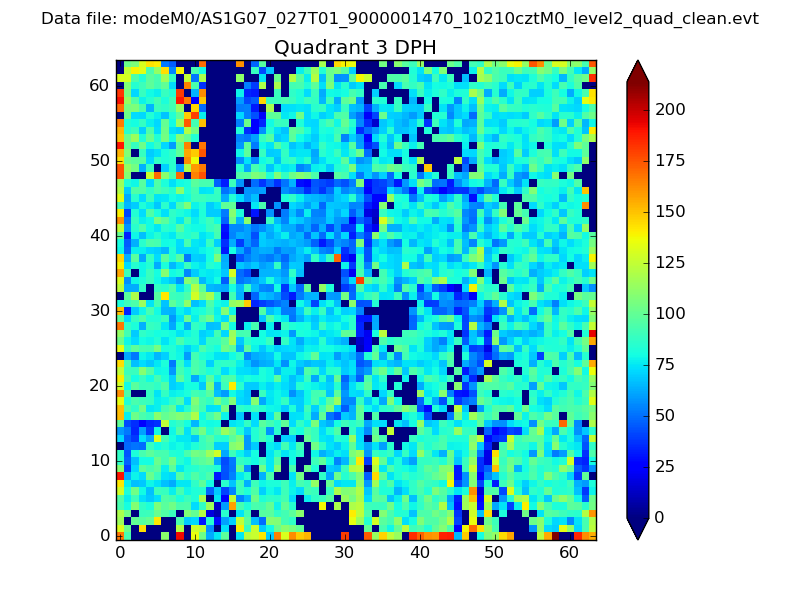 |
 |
Quadrant C |
| Plot type | Count rate plots | Images |
|---|---|---|
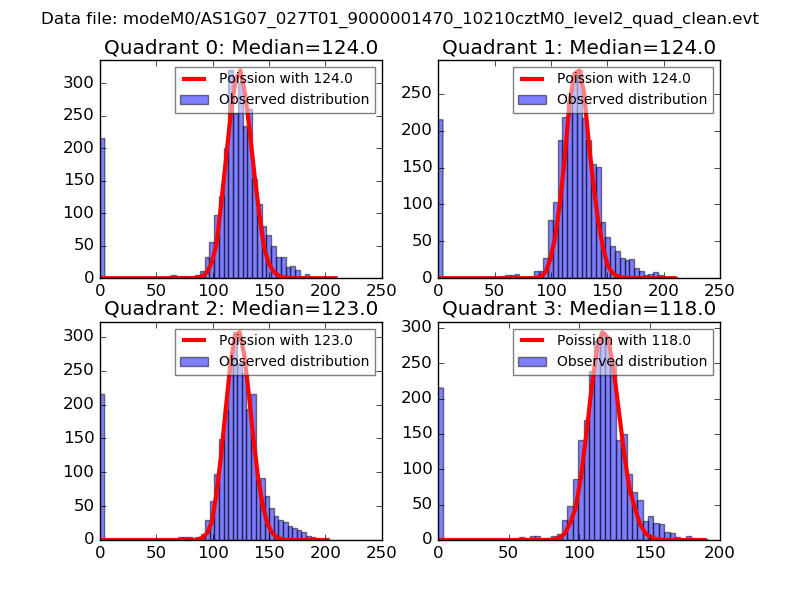
| Comparison with Poisson distribution Blue bars denote a histogram of data divided into 1 sec bins. Red curve is a Poisson curve with rate = median count rate of data. |
 |
 |
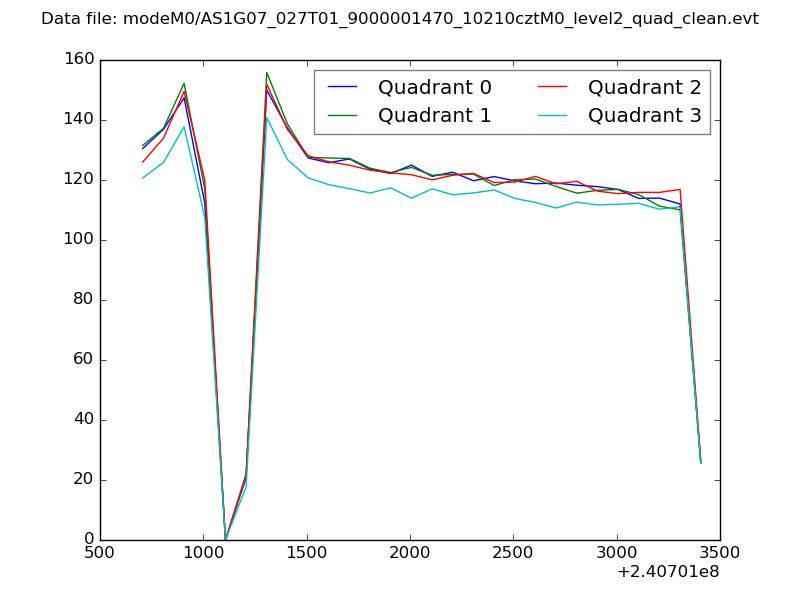
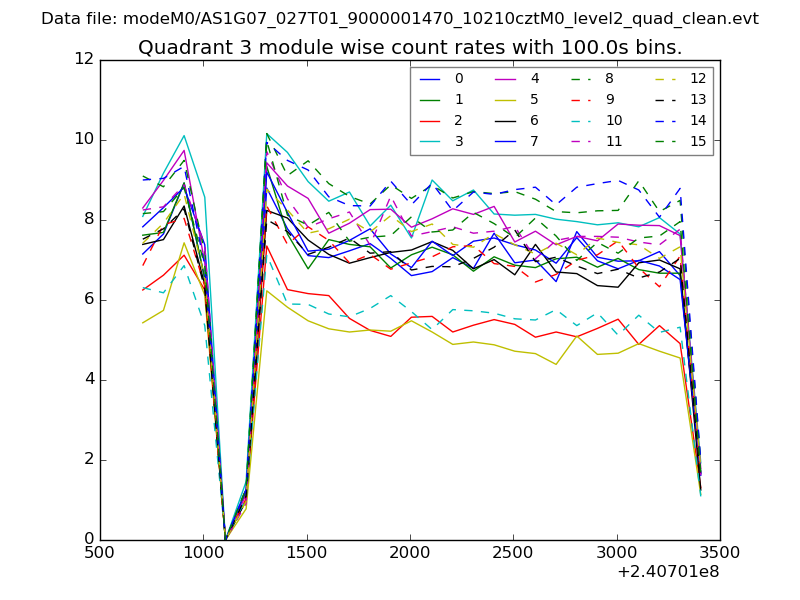
| Quadrant-wise count rates Data is divided into 100 sec bins |
 |
|
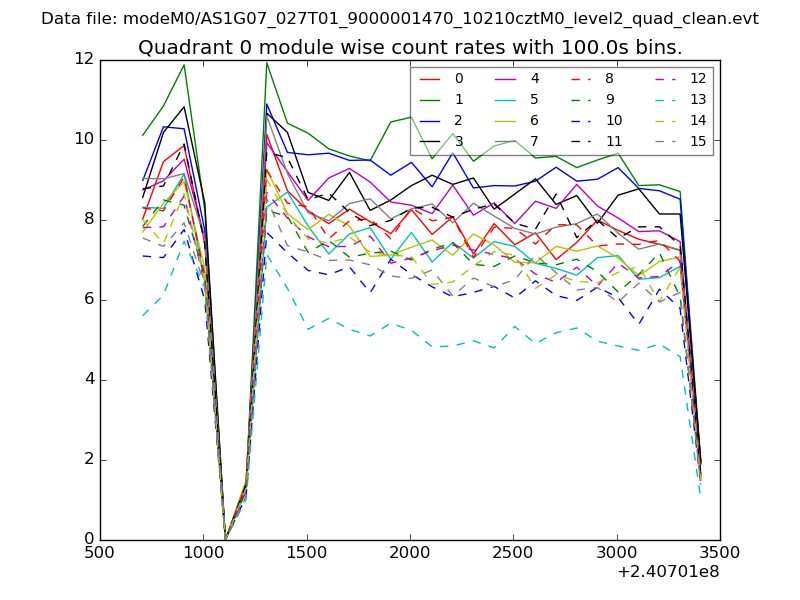
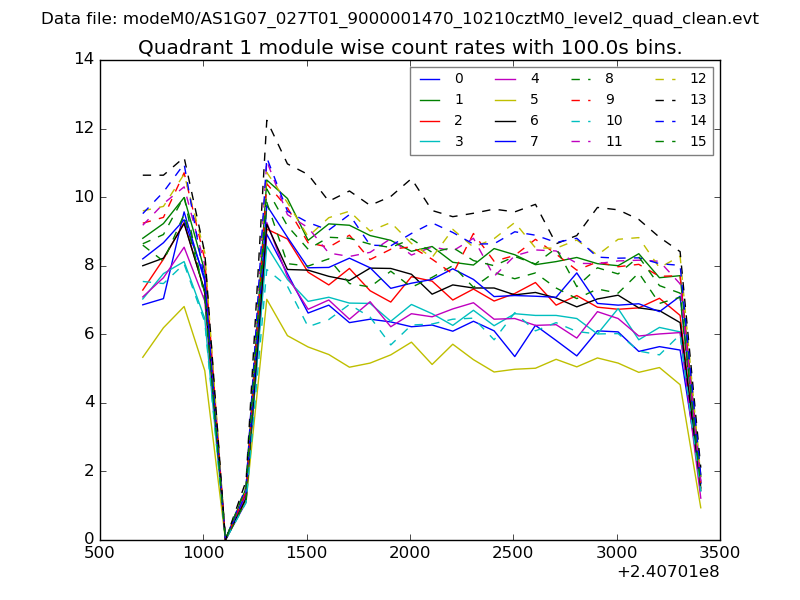
| Module-wise count rates for Quadrant A Data is divided into 100 sec bins |
 |
 |
| Module-wise count rates for Quadrant B Data is divided into 100 sec bins |
 |
 |
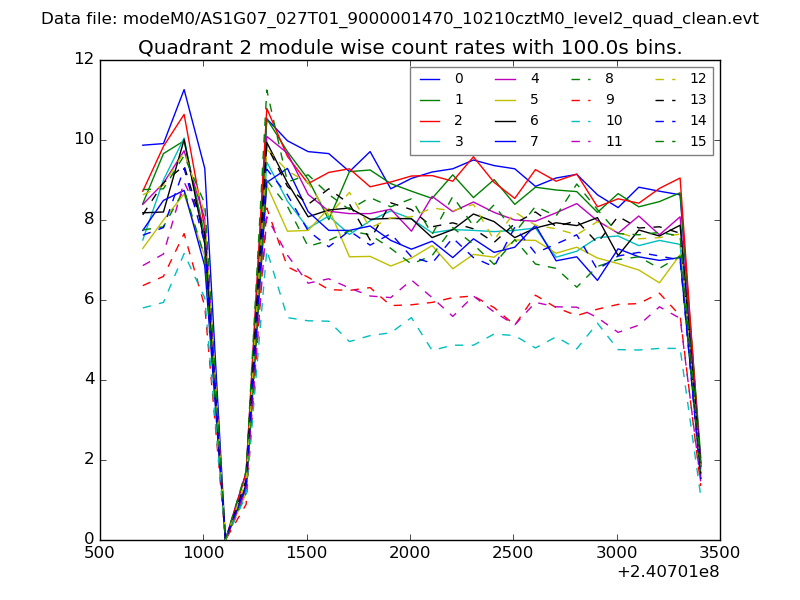
| Module-wise count rates for Quadrant C Data is divided into 100 sec bins |
 |
 |
| Module-wise count rates for Quadrant D Data is divided into 100 sec bins |
 |
 |
| Parameter | Plot |
|---|---|
| CZT HV Monitor | 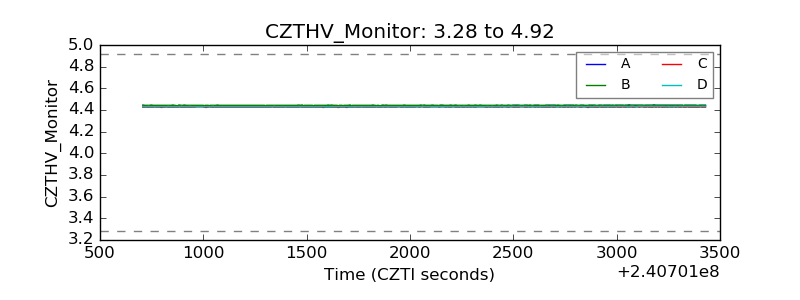 |
| D_VDD | 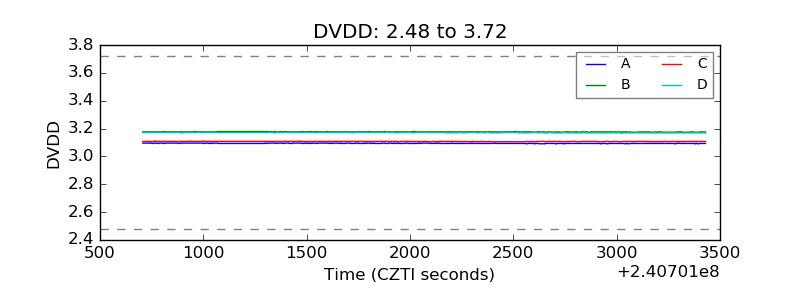 |
| Temperature 1 | 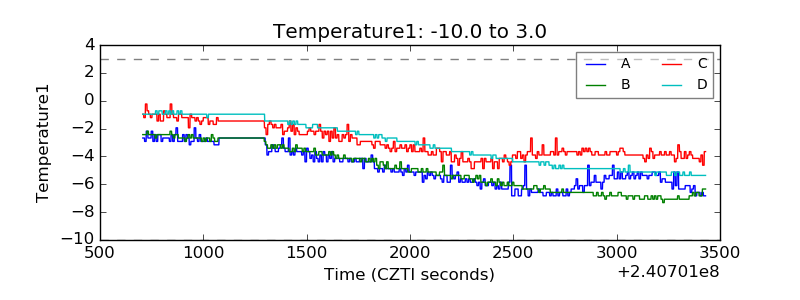 |
| Veto HV Monitor | 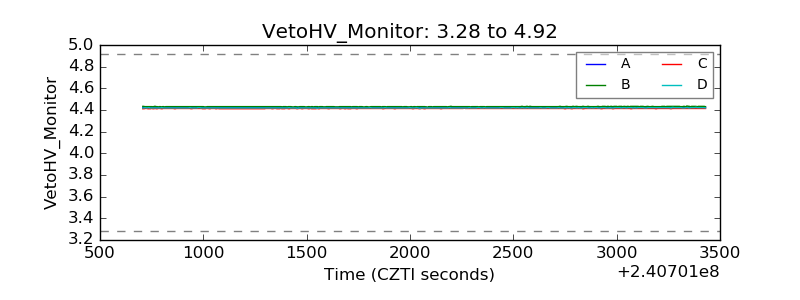 |
| Veto LLD |  |
| Alpha Counter | 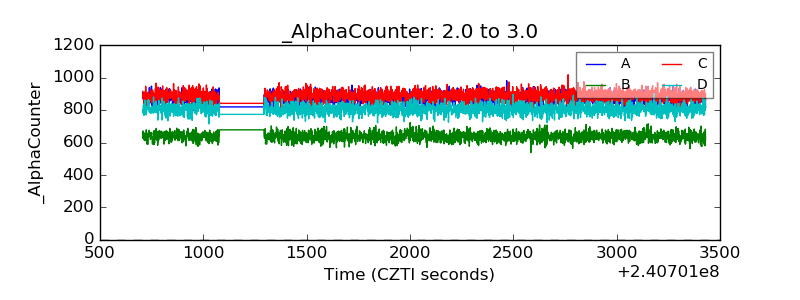 |
| _CPM_Rate | 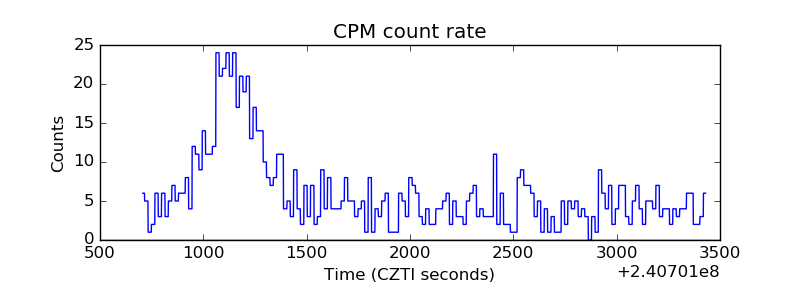 |
| CZT Counter | 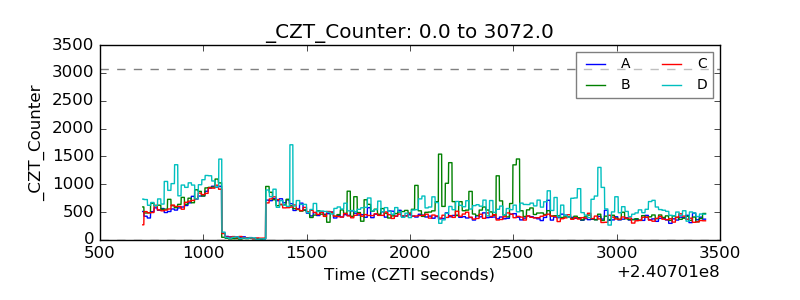 |
| +2.5 Volts monitor |  |
| +5 Volts monitor |  |
| _ROLL_ROT | 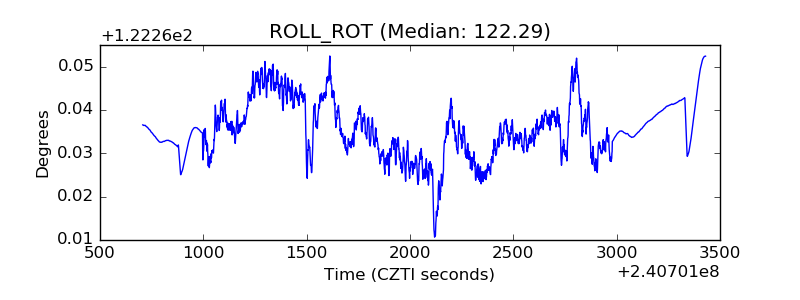 |
| _Roll_DEC | 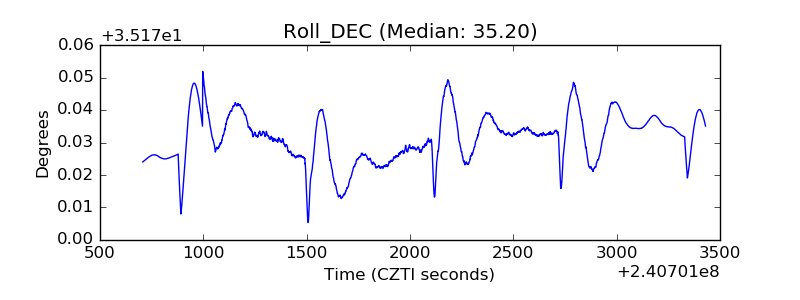 |
| _Roll_RA | 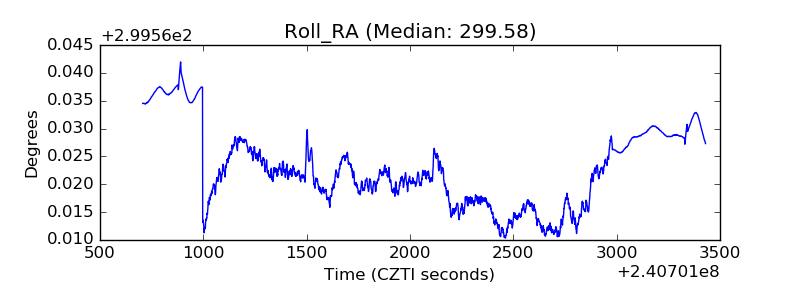 |
| Veto Counter | 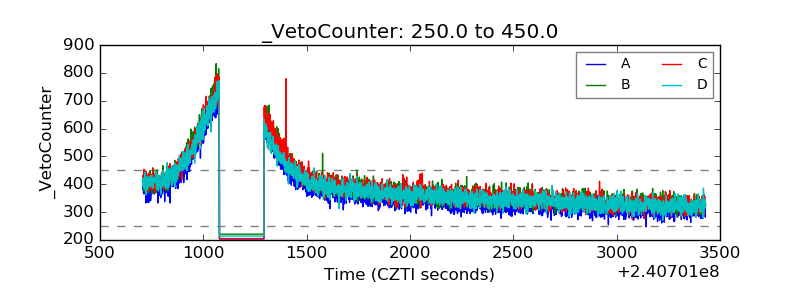 |