| Param | Original file | Final file |
|---|---|---|
| Filename | modeM0/AS1A03_095T03_9000001474cztM0_level2.fits | modeM0/AS1A03_095T03_9000001474cztM0_level2_quad_clean.evt |
| Size (bytes) | 317,088,000 | 328,245,120 |
| Size | 302.4 MB | 313.0 MB |
| Events in quadrant A | 1,900,978 | 1,978,808 |
| Events in quadrant B | 1,824,238 | 1,950,786 |
| Events in quadrant C | 1,871,492 | 1,907,204 |
| Events in quadrant D | 1,587,350 | 1,685,403 |
| Mode SS | |||
|---|---|---|---|
| Quadrant | BADHDUFLAG | Total packets | Discarded packets |
| A | 0 | 694 | 0 |
| B | 0 | 694 | 0 |
| C | 0 | 694 | 0 |
| D | 0 | 694 | 0 |
| Mode M0 | |||
|---|---|---|---|
| Quadrant | BADHDUFLAG | Total packets | Discarded packets |
| A | 0 | 73754 | 0 |
| B | 0 | 76384 | 0 |
| C | 0 | 71765 | 0 |
| D | 0 | 94815 | 0 |
| Mode M9 | |||
|---|---|---|---|
| Quadrant | BADHDUFLAG | Total packets | Discarded packets |
| A | 0 | 27 | 0 |
| B | 0 | 27 | 0 |
| C | 0 | 27 | 0 |
| D | 0 | 27 | 0 |
| Quadrant | Total seconds | Saturated seconds | Saturation percentage |
|---|---|---|---|
| A | 35350 | 201 | 0.568600% |
| B | 35257 | 420 | 1.191253% |
| C | 35350 | 79 | 0.223479% |
| D | 35143 | 971 | 2.762997% |
Noise dominated data is calculated using 1-second bins in cleaned event files. If a bin has >2000 counts, and if more than 50% of those come from <1% of pixels, then it is considered to be noise-dominated and hence unusable.
| Quadrant | # 1 sec bins | Bins with >0 counts | Bins with >2000 counts | High rate bins dominated by noise | Noise dominated (total time) | Noise dominated (detector-on time) | Marked lightcurve |
|---|---|---|---|---|---|---|---|
| A | 38534 | 35588 | 0 | 0 | 0.00% | 0.00% |  |
| B | 38534 | 35520 | 0 | 0 | 0.00% | 0.00% | 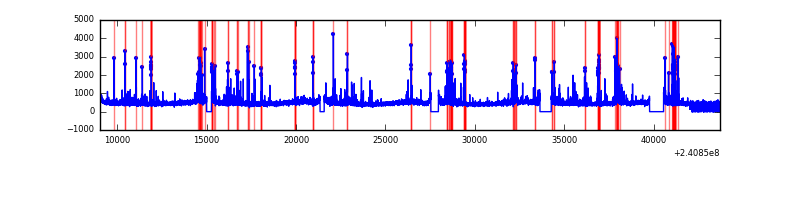 |
| C | 38533 | 35587 | 0 | 0 | 0.00% | 0.00% |  |
| D | 38534 | 35323 | 0 | 0 | 0.00% | 0.00% | 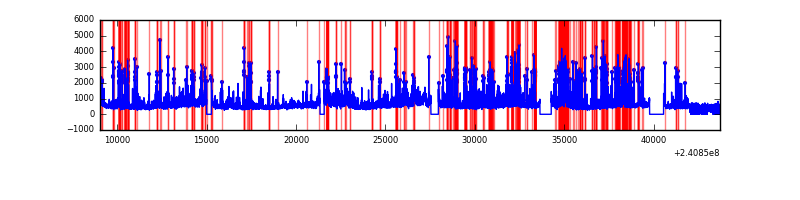 |
Top three noisy pixels from each quadrant. If the there are fewer than three noisy pixels in the level2.evt file, extra rows are filled as -1
| Pixel properties | Quadrant properties | ||||||
|---|---|---|---|---|---|---|---|
| Quadrant | DetID | PixID | Counts | Sigma | Mean | Median | Sigma |
| A | 14 | 188 | 1926 | 11.65 | 493 | 461 | 125.8 |
| A | 0 | 29 | 1796 | 10.62 | 493 | 461 | 125.8 |
| A | 14 | 204 | 1636 | 9.34 | 493 | 461 | 125.8 |
| B | 2 | 9 | 1633 | 12.24 | 480 | 457 | 96.1 |
| B | 3 | 17 | 1254 | 8.29 | 480 | 457 | 96.1 |
| B | 14 | 254 | 1251 | 8.26 | 480 | 457 | 96.1 |
| C | 12 | 241 | 1370 | 7.02 | 494 | 458 | 130.0 |
| C | 2 | 191 | 1289 | 6.39 | 494 | 458 | 130.0 |
| C | 9 | 242 | 1273 | 6.27 | 494 | 458 | 130.0 |
| D | 3 | 14 | 1180 | 6.23 | 451 | 408 | 124.0 |
| D | 1 | 19 | 1138 | 5.89 | 451 | 408 | 124.0 |
| D | 7 | 5 | 1138 | 5.89 | 451 | 408 | 124.0 |
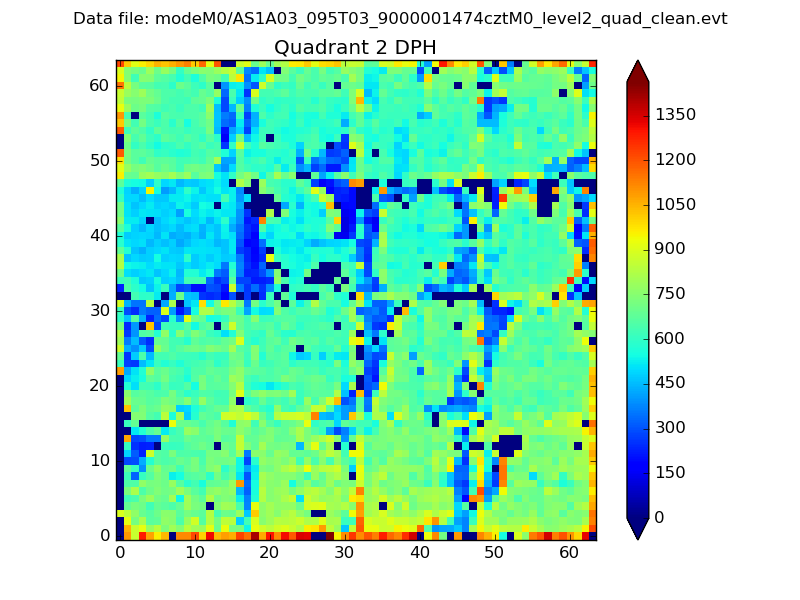
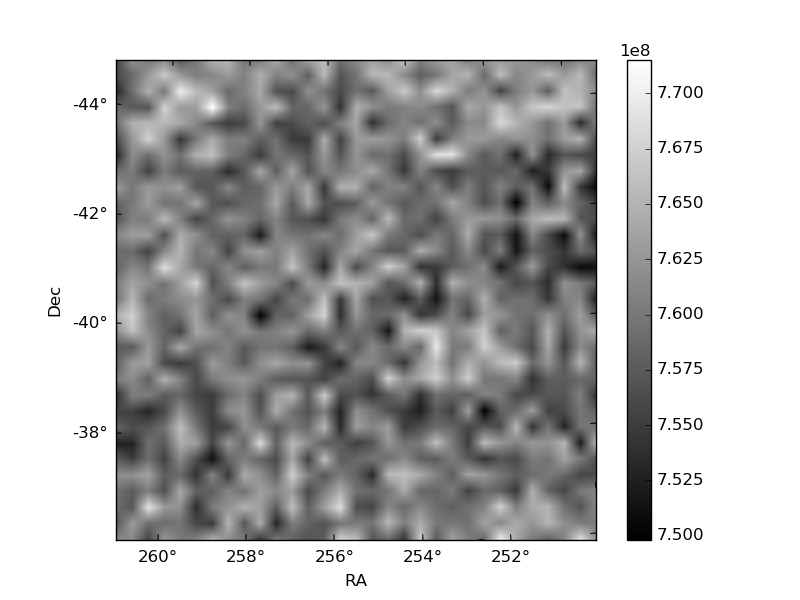
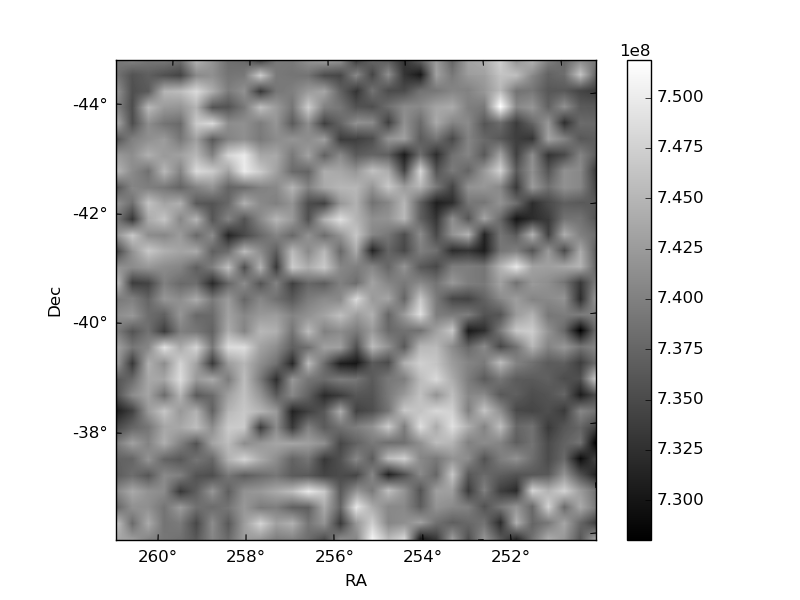
Histogram calculated using DETX and DETY for each event in the final _common_clean file
| Quadrant A | 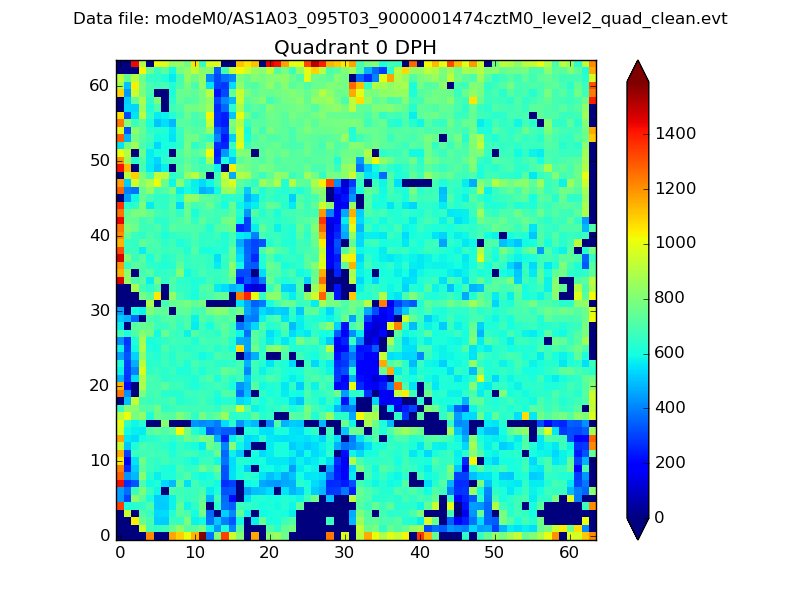 |
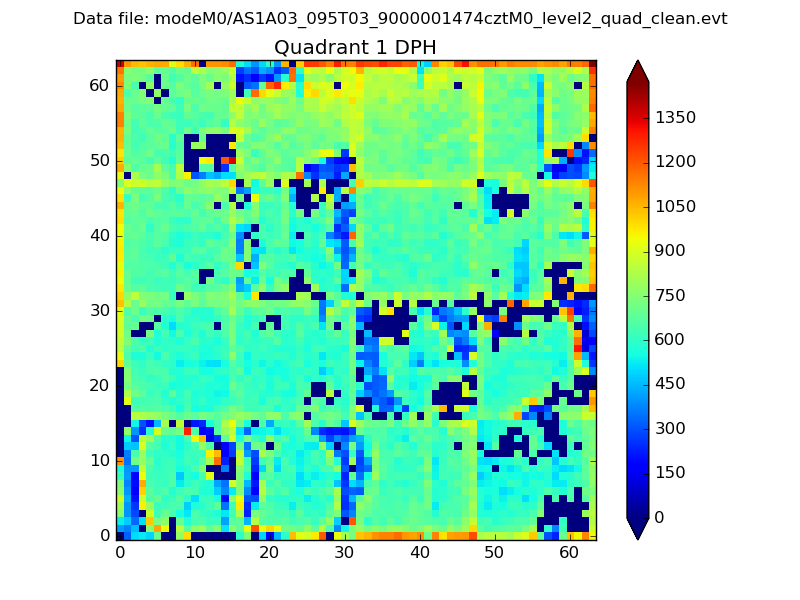 |
Quadrant B |
|---|---|---|---|
| Quadrant D | 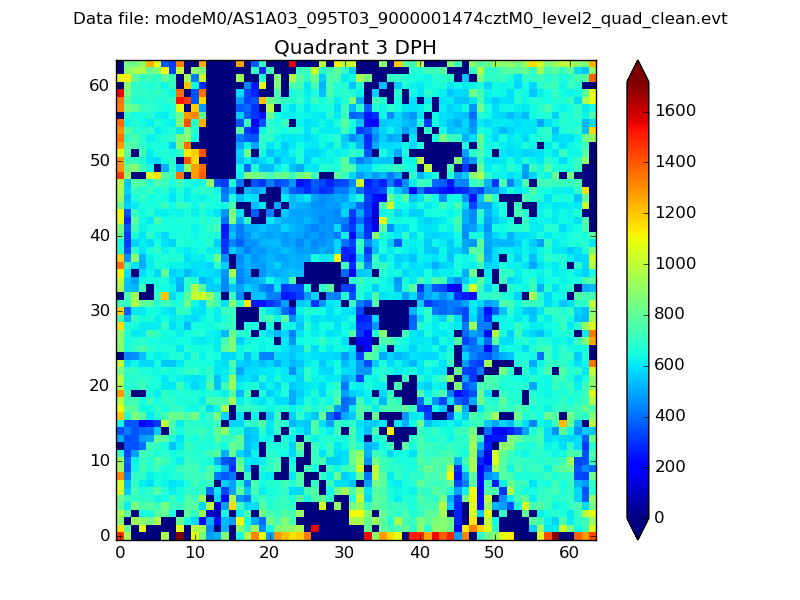 |
 |
Quadrant C |
| Plot type | Count rate plots | Images |
|---|---|---|
| Comparison with Poisson distribution Blue bars denote a histogram of data divided into 1 sec bins. Red curve is a Poisson curve with rate = median count rate of data. |
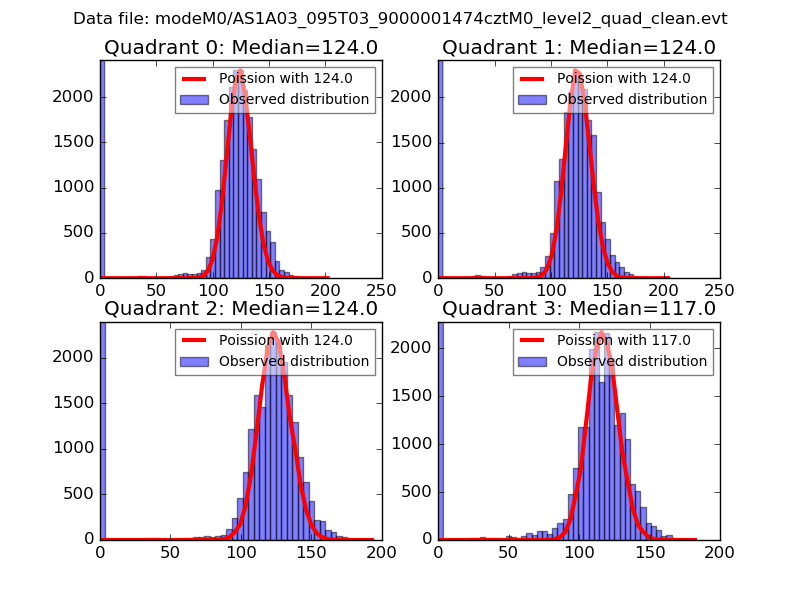 |
 |
| Quadrant-wise count rates Data is divided into 100 sec bins |
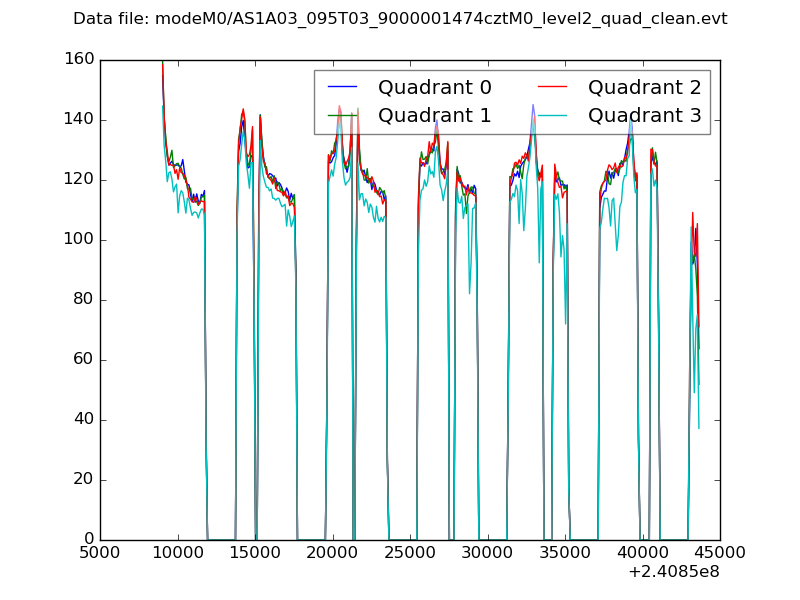 |
|
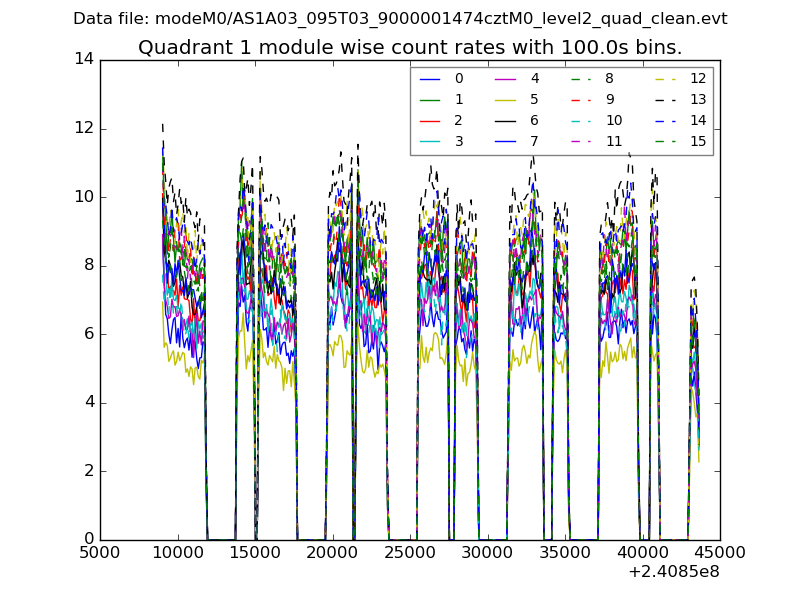
| Module-wise count rates for Quadrant A Data is divided into 100 sec bins |
 |
 |
| Module-wise count rates for Quadrant B Data is divided into 100 sec bins |
 |
 |
| Module-wise count rates for Quadrant C Data is divided into 100 sec bins |
 |
 |
| Module-wise count rates for Quadrant D Data is divided into 100 sec bins |
 |
 |
| Parameter | Plot |
|---|---|
| CZT HV Monitor | 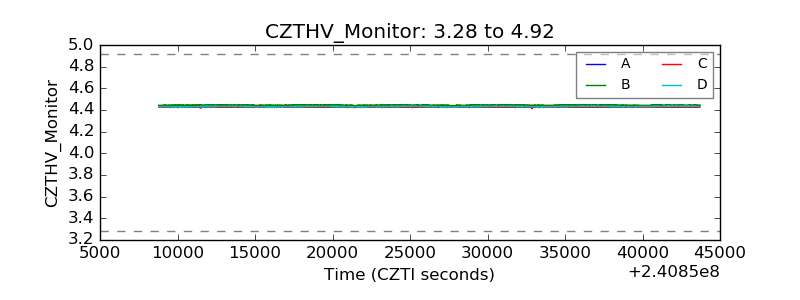 |
| D_VDD |  |
| Temperature 1 |  |
| Veto HV Monitor | 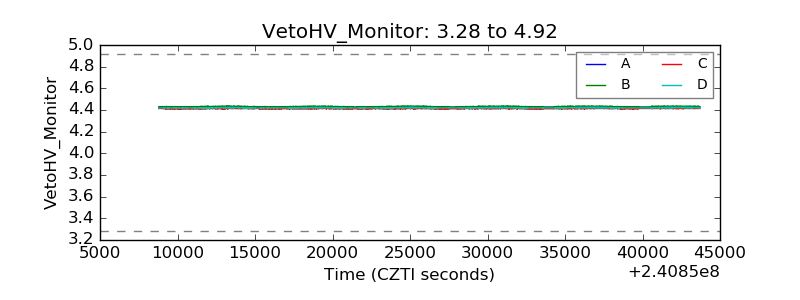 |
| Veto LLD | 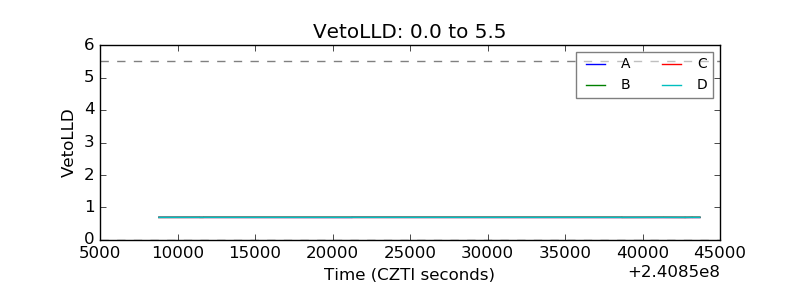 |
| Alpha Counter | 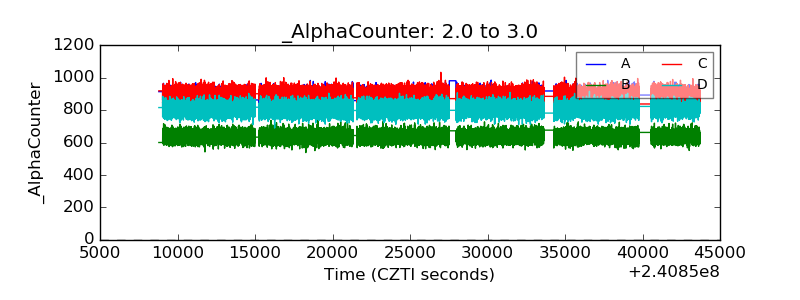 |
| _CPM_Rate |  |
| CZT Counter |  |
| +2.5 Volts monitor |  |
| +5 Volts monitor | 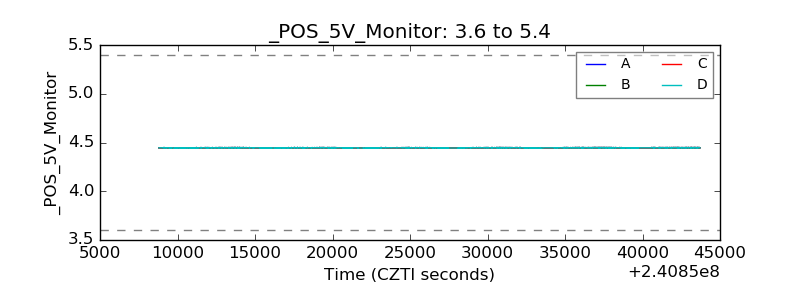 |
| _ROLL_ROT |  |
| _Roll_DEC |  |
| _Roll_RA | 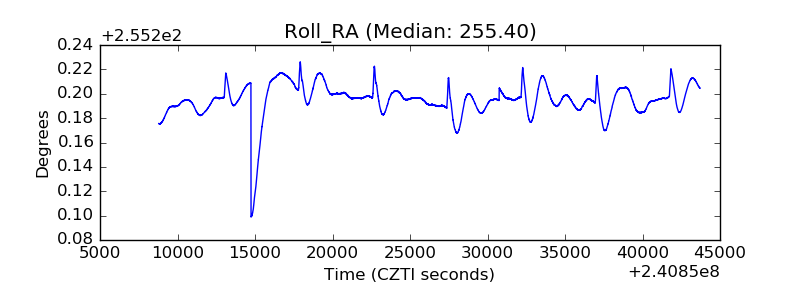 |
| Veto Counter |  |