| Param | Original file | Final file |
|---|---|---|
| Filename | modeM0/AS1A03_095T03_9000001474_10237cztM0_level2.evt | modeM0/AS1A03_095T03_9000001474_10237cztM0_level2_quad_clean.evt |
| Size (bytes) | 533,232,000 | 106,643,520 |
| Size | 508.5 MB | 101.7 MB |
| Events in quadrant A | 3,804,549 | 685,354 |
| Events in quadrant B | 3,838,519 | 688,363 |
| Events in quadrant C | 3,288,115 | 684,724 |
| Events in quadrant D | 4,710,747 | 651,314 |
| Mode SS | |||
|---|---|---|---|
| Quadrant | BADHDUFLAG | Total packets | Discarded packets |
| A | 0 | 152 | 0 |
| B | 0 | 152 | 0 |
| C | 0 | 152 | 0 |
| D | 0 | 152 | 0 |
| Mode M0 | |||
|---|---|---|---|
| Quadrant | BADHDUFLAG | Total packets | Discarded packets |
| A | 0 | 16779 | 3 |
| B | 0 | 16373 | 2 |
| C | 0 | 15251 | 2 |
| D | 0 | 19062 | 2 |
| Mode M9 | |||
|---|---|---|---|
| Quadrant | BADHDUFLAG | Total packets | Discarded packets |
| A | 0 | 4 | 0 |
| B | 0 | 4 | 0 |
| C | 0 | 4 | 0 |
| D | 0 | 5 | 0 |
| Quadrant | Total seconds | Saturated seconds | Saturation percentage |
|---|---|---|---|
| A | 7470 | 67 | 0.896921% |
| B | 7470 | 80 | 1.070950% |
| C | 7470 | 13 | 0.174029% |
| D | 7470 | 141 | 1.887550% |
Noise dominated data is calculated using 1-second bins in cleaned event files. If a bin has >2000 counts, and if more than 50% of those come from <1% of pixels, then it is considered to be noise-dominated and hence unusable.
| Quadrant | # 1 sec bins | Bins with >0 counts | Bins with >2000 counts | High rate bins dominated by noise | Noise dominated (total time) | Noise dominated (detector-on time) | Marked lightcurve |
|---|---|---|---|---|---|---|---|
| A | 7740 | 7471 | 4 | 4 | 0.05% | 0.05% | 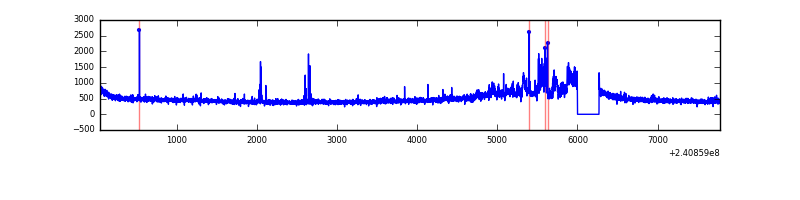 |
| B | 7740 | 7471 | 36 | 36 | 0.47% | 0.48% | 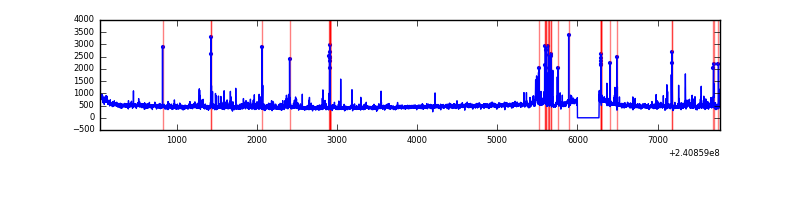 |
| C | 7740 | 7471 | 0 | 0 | 0.00% | 0.00% | 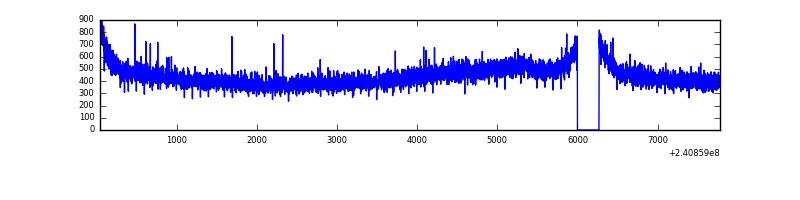 |
| D | 7740 | 7471 | 98 | 98 | 1.27% | 1.31% | 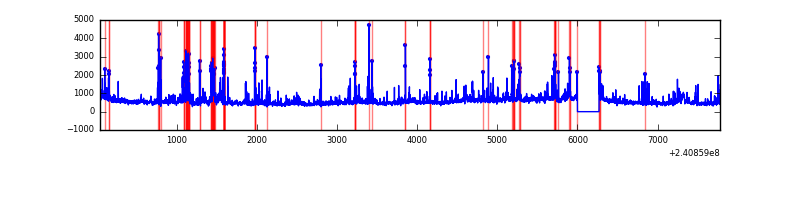 |
Top three noisy pixels from each quadrant. If the there are fewer than three noisy pixels in the level2.evt file, extra rows are filled as -1
| Pixel properties | Quadrant properties | ||||||
|---|---|---|---|---|---|---|---|
| Quadrant | DetID | PixID | Counts | Sigma | Mean | Median | Sigma |
| A | 8 | 15 | 414379 | 2322.79 | 873 | 857 | 178.0 |
| A | 15 | 174 | 13833 | 72.89 | 873 | 857 | 178.0 |
| A | 15 | 223 | 12483 | 65.3 | 873 | 857 | 178.0 |
| B | 4 | 239 | 163432 | 970.94 | 874 | 852 | 167.4 |
| B | 11 | 51 | 89330 | 528.4 | 874 | 852 | 167.4 |
| B | 0 | 214 | 66086 | 389.58 | 874 | 852 | 167.4 |
| C | 13 | 61 | 6352 | 28.28 | 839 | 842 | 194.8 |
| C | 14 | 234 | 6237 | 27.69 | 839 | 842 | 194.8 |
| C | 0 | 207 | 4978 | 21.23 | 839 | 842 | 194.8 |
| D | 1 | 52 | 564713 | 2810.34 | 833 | 807 | 200.7 |
| D | 8 | 195 | 434201 | 2159.91 | 833 | 807 | 200.7 |
| D | 13 | 104 | 199122 | 988.34 | 833 | 807 | 200.7 |
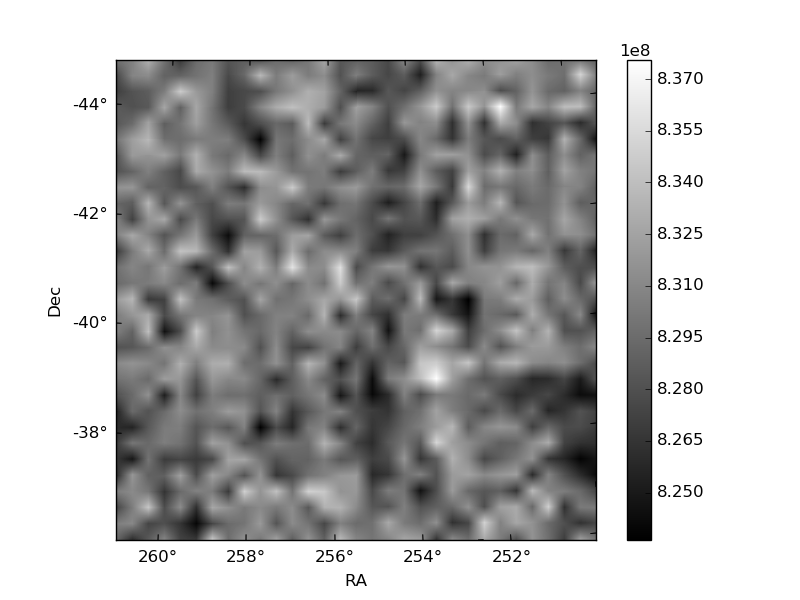
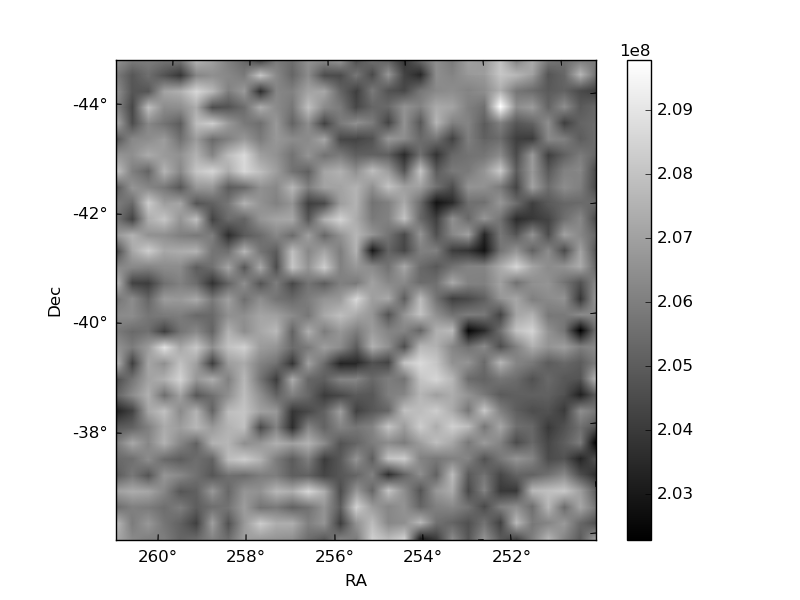
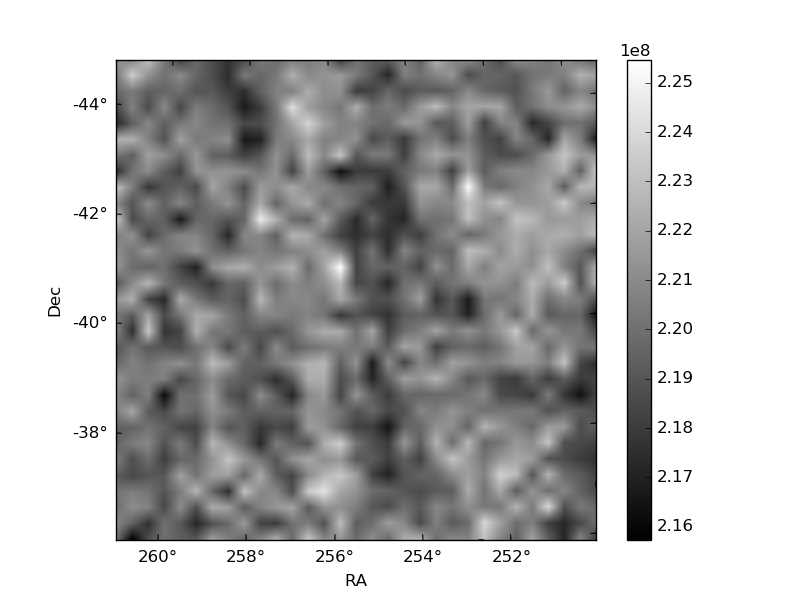
Histogram calculated using DETX and DETY for each event in the final _common_clean file
| Quadrant A | 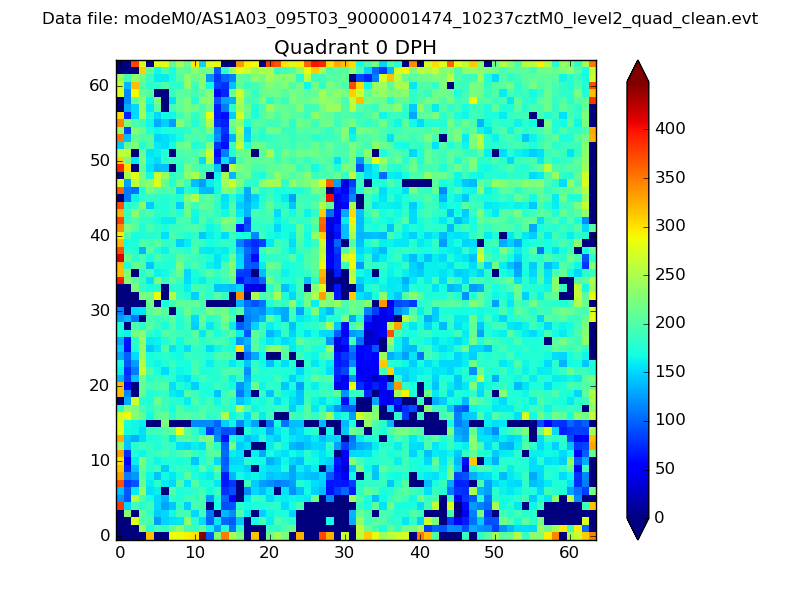 |
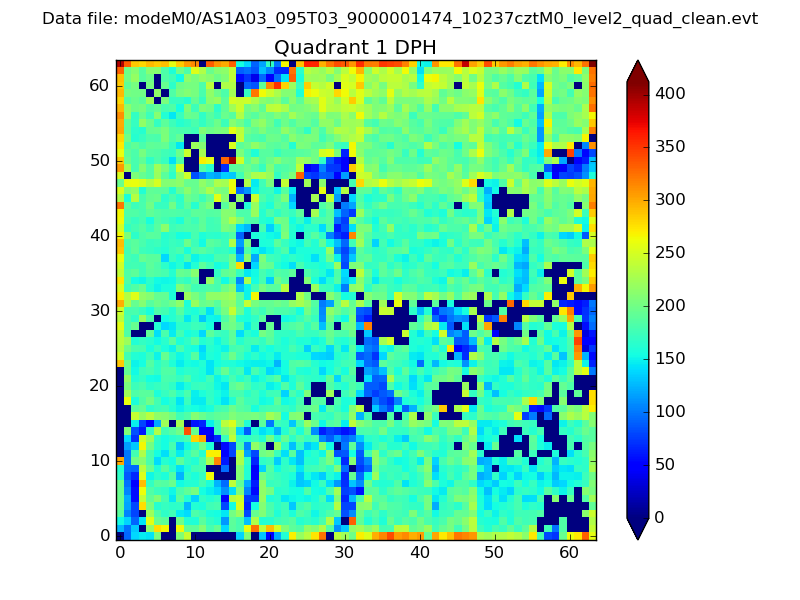 |
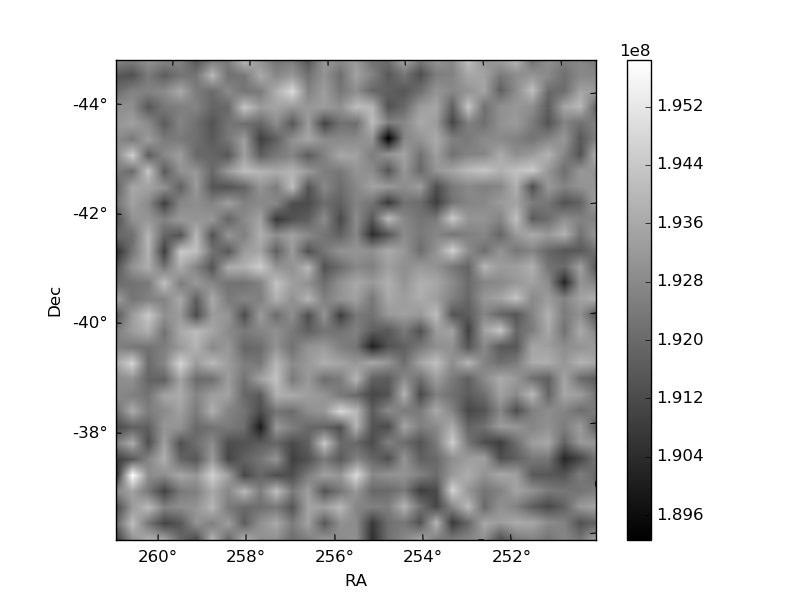
Quadrant B |
|---|---|---|---|
| Quadrant D | 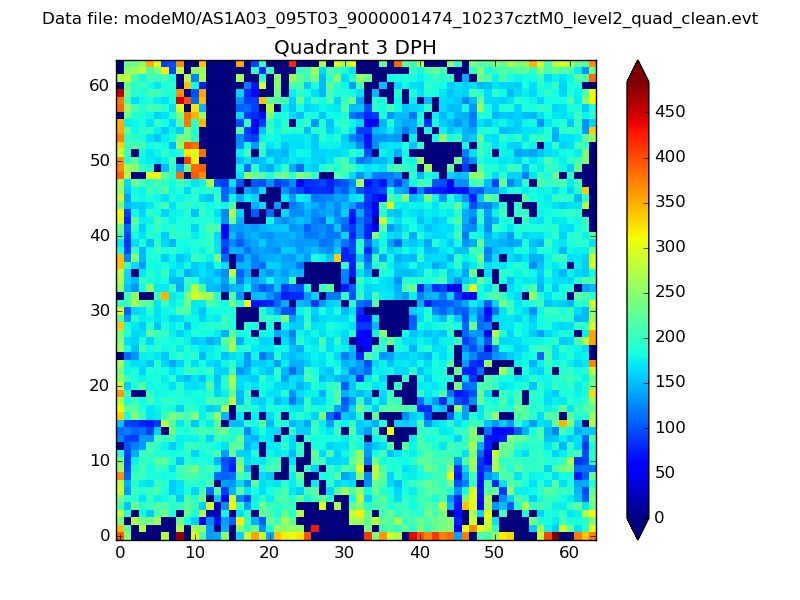 |
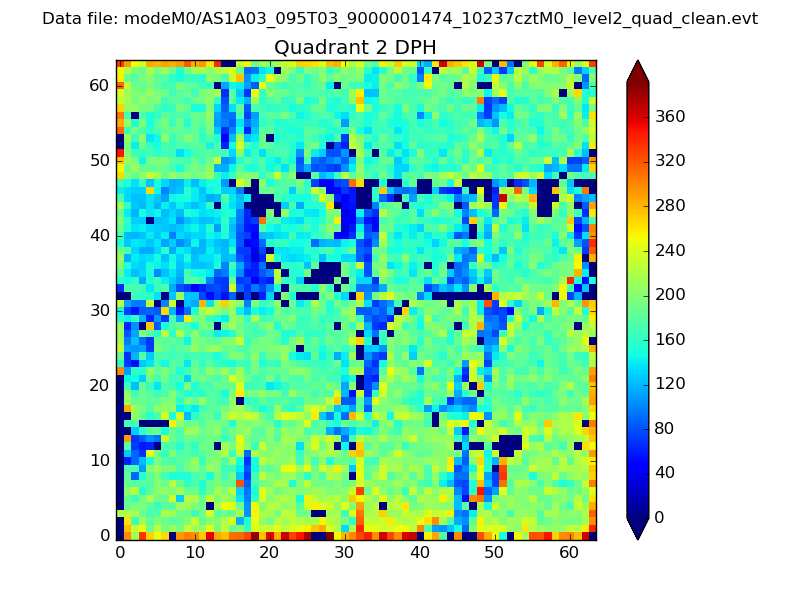 |
Quadrant C |
| Plot type | Count rate plots | Images |
|---|---|---|
| Comparison with Poisson distribution Blue bars denote a histogram of data divided into 1 sec bins. Red curve is a Poisson curve with rate = median count rate of data. |
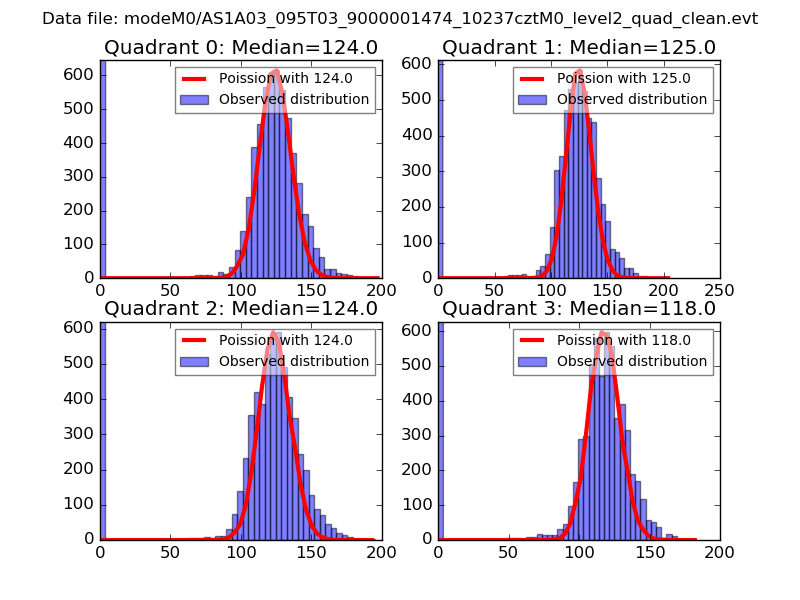 |
 |
| Quadrant-wise count rates Data is divided into 100 sec bins |
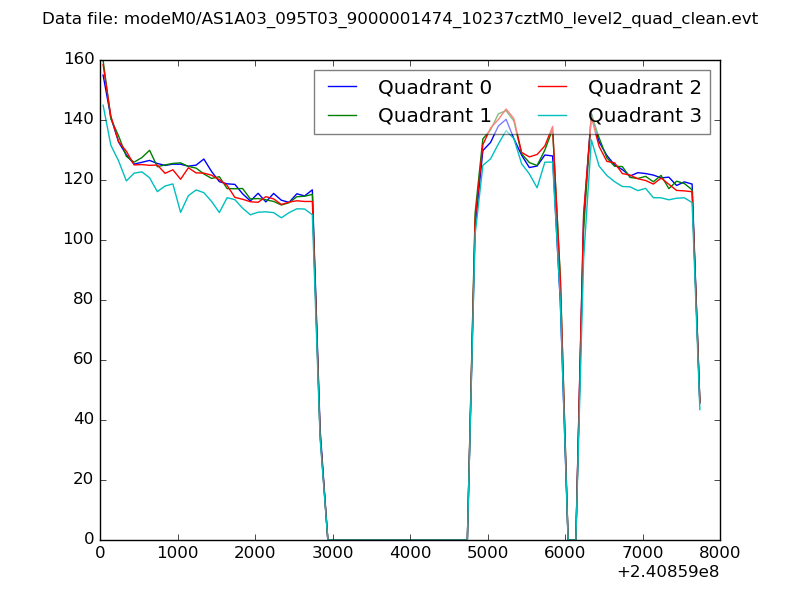 |
|
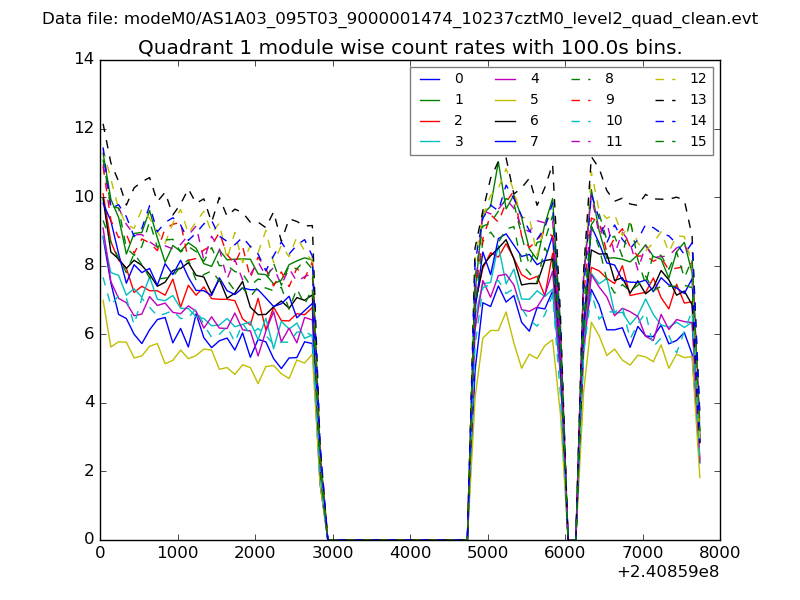
| Module-wise count rates for Quadrant A Data is divided into 100 sec bins |
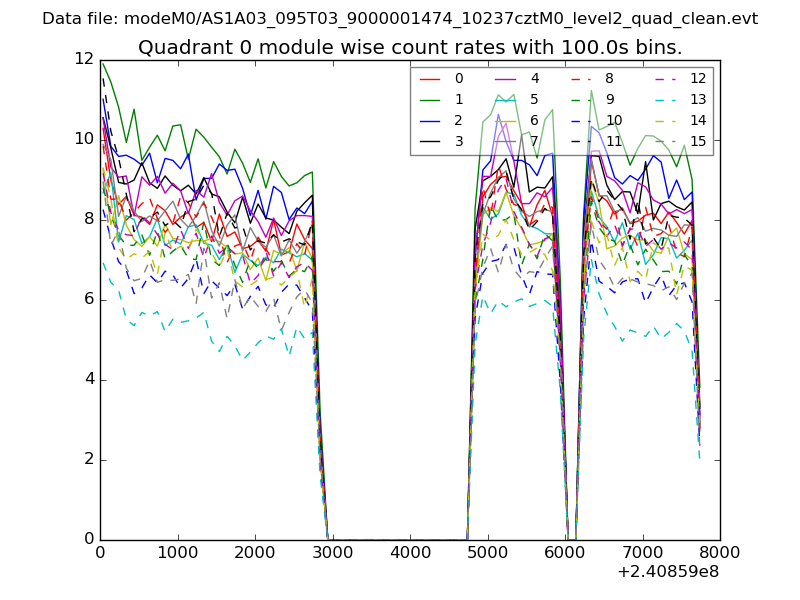 |
 |
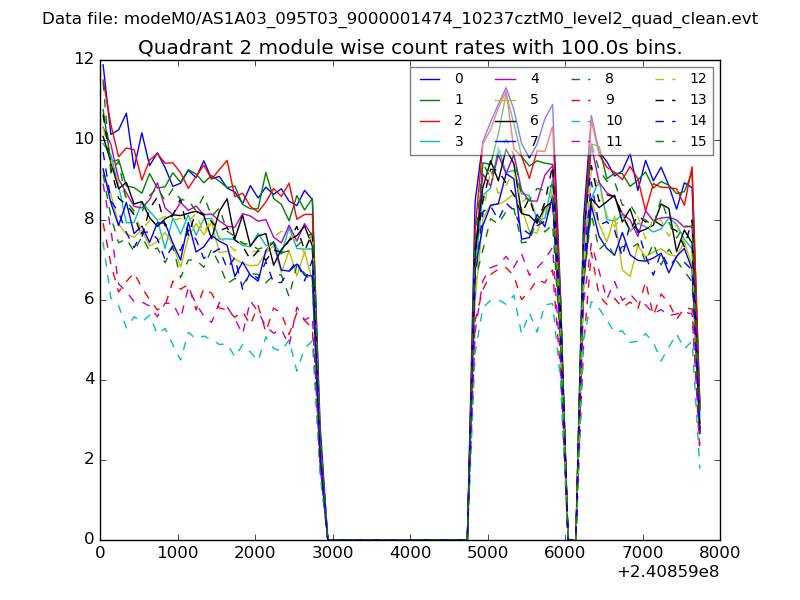
| Module-wise count rates for Quadrant B Data is divided into 100 sec bins |
 |
 |
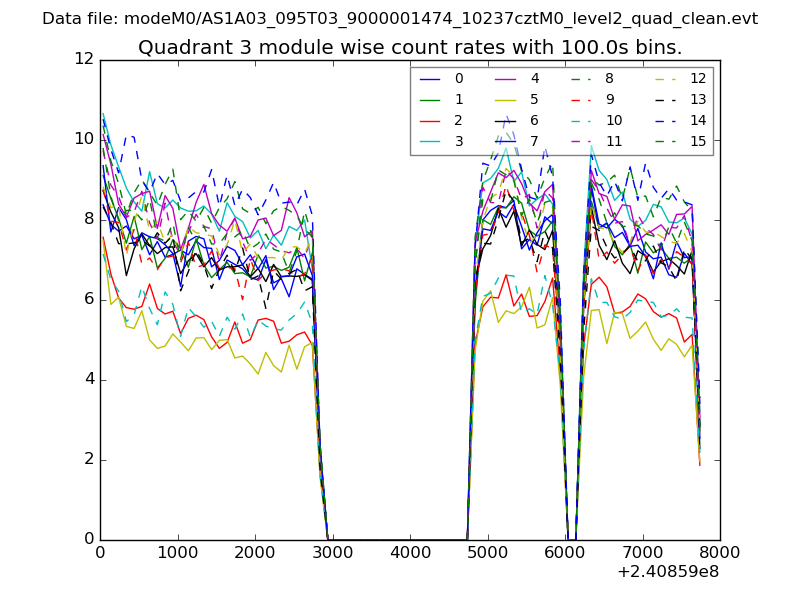
| Module-wise count rates for Quadrant C Data is divided into 100 sec bins |
 |
 |
| Module-wise count rates for Quadrant D Data is divided into 100 sec bins |
 |
 |
| Parameter | Plot |
|---|---|
| CZT HV Monitor | 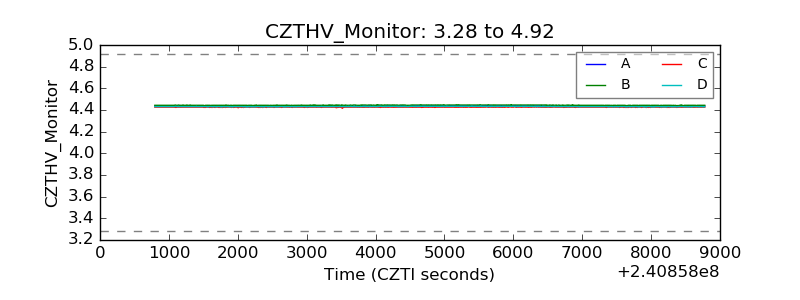 |
| D_VDD | 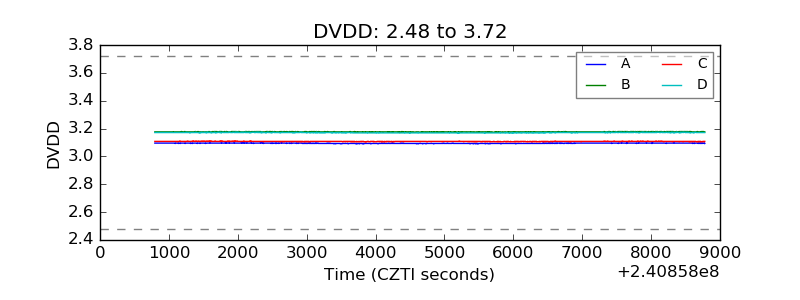 |
| Temperature 1 | 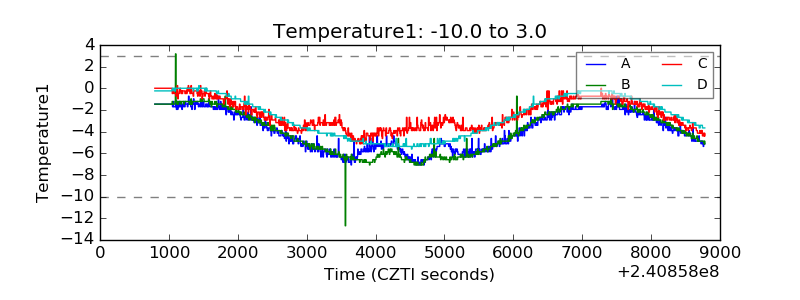 |
| Veto HV Monitor | 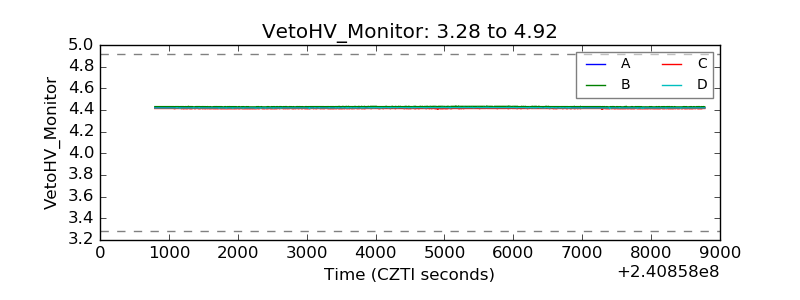 |
| Veto LLD | 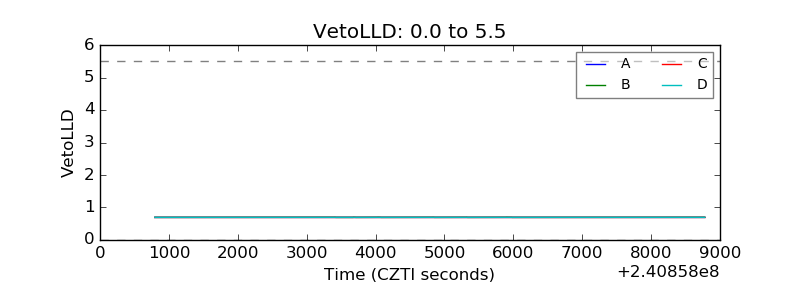 |
| Alpha Counter | 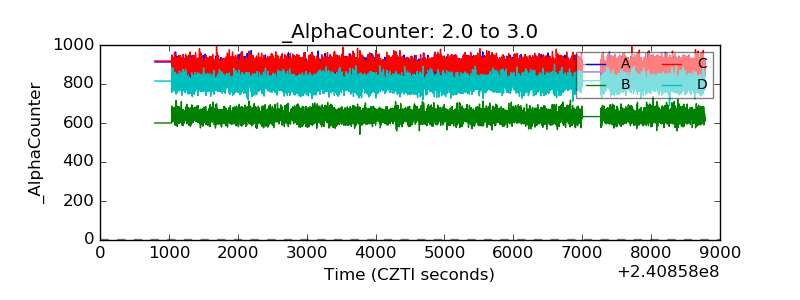 |
| _CPM_Rate | 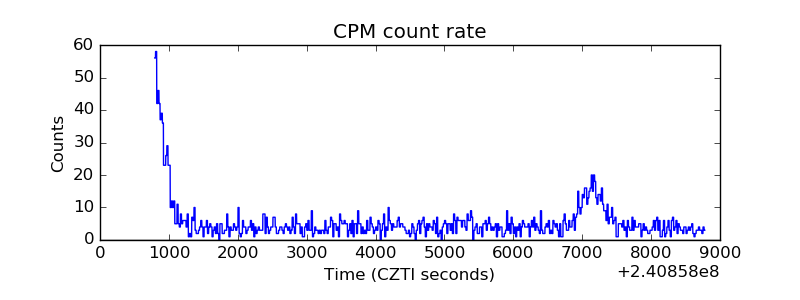 |
| CZT Counter | 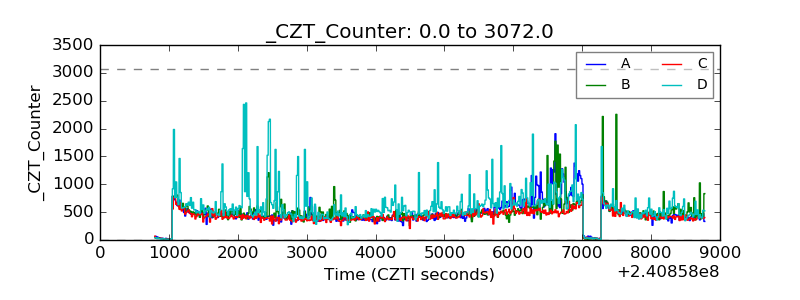 |
| +2.5 Volts monitor |  |
| +5 Volts monitor | 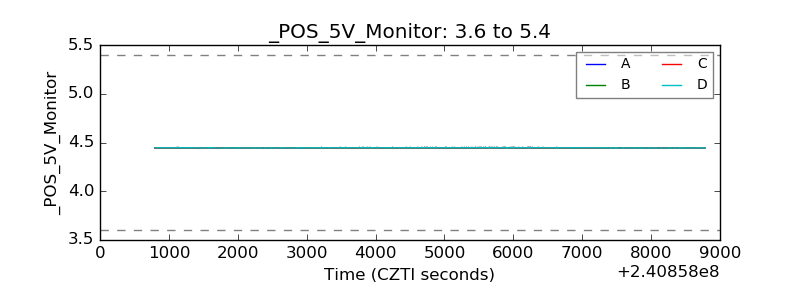 |
| _ROLL_ROT | 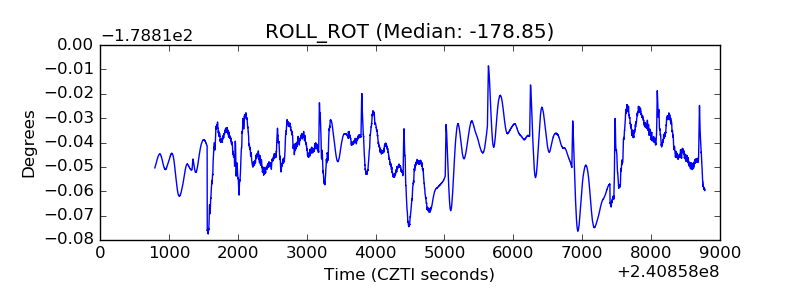 |
| _Roll_DEC | 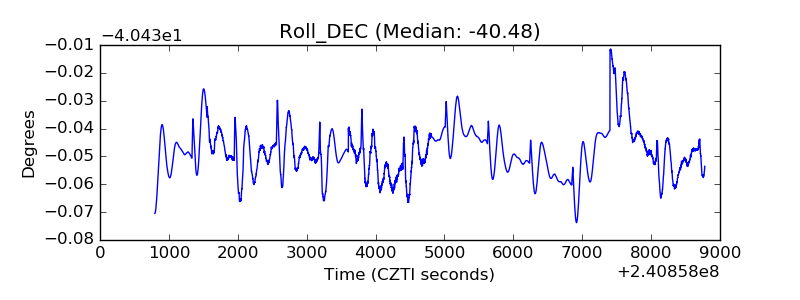 |
| _Roll_RA | 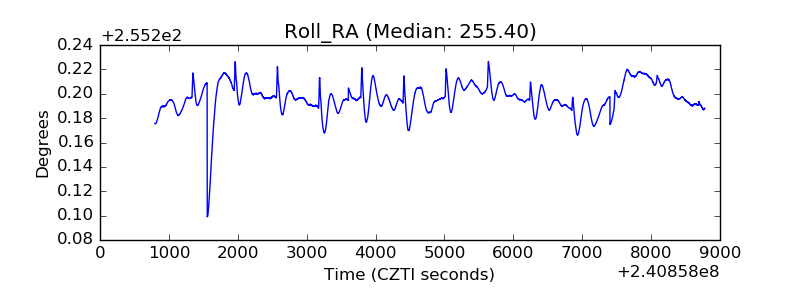 |
| Veto Counter | 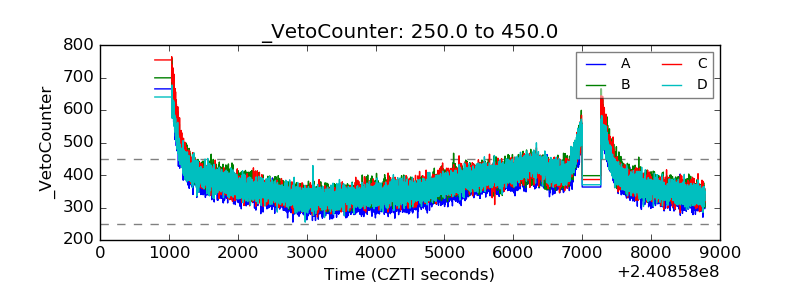 |