| Param | Original file | Final file |
|---|---|---|
| Filename | modeM0/AS1A03_095T03_9000001474_10238cztM0_level2.evt | modeM0/AS1A03_095T03_9000001474_10238cztM0_level2_quad_clean.evt |
| Size (bytes) | 564,935,040 | 115,614,720 |
| Size | 538.8 MB | 110.3 MB |
| Events in quadrant A | 3,809,241 | 746,445 |
| Events in quadrant B | 4,106,874 | 748,121 |
| Events in quadrant C | 3,507,567 | 747,326 |
| Events in quadrant D | 5,143,897 | 704,505 |
| Mode SS | |||
|---|---|---|---|
| Quadrant | BADHDUFLAG | Total packets | Discarded packets |
| A | 0 | 166 | 0 |
| B | 0 | 166 | 0 |
| C | 0 | 166 | 0 |
| D | 0 | 166 | 0 |
| Mode M0 | |||
|---|---|---|---|
| Quadrant | BADHDUFLAG | Total packets | Discarded packets |
| A | 0 | 16985 | 3 |
| B | 0 | 17500 | 2 |
| C | 0 | 16302 | 2 |
| D | 0 | 20652 | 2 |
| Mode M9 | |||
|---|---|---|---|
| Quadrant | BADHDUFLAG | Total packets | Discarded packets |
| A | 0 | 4 | 0 |
| B | 0 | 4 | 0 |
| C | 0 | 4 | 0 |
| D | 0 | 4 | 0 |
| Quadrant | Total seconds | Saturated seconds | Saturation percentage |
|---|---|---|---|
| A | 7976 | 67 | 0.840020% |
| B | 7976 | 79 | 0.990471% |
| C | 7976 | 13 | 0.162989% |
| D | 7976 | 108 | 1.354062% |
Noise dominated data is calculated using 1-second bins in cleaned event files. If a bin has >2000 counts, and if more than 50% of those come from <1% of pixels, then it is considered to be noise-dominated and hence unusable.
| Quadrant | # 1 sec bins | Bins with >0 counts | Bins with >2000 counts | High rate bins dominated by noise | Noise dominated (total time) | Noise dominated (detector-on time) | Marked lightcurve |
|---|---|---|---|---|---|---|---|
| A | 8481 | 7978 | 9 | 9 | 0.11% | 0.11% | 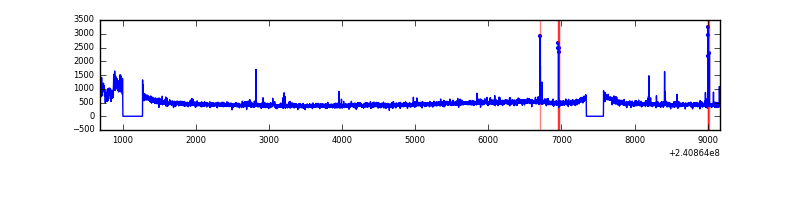 |
| B | 8481 | 7978 | 33 | 33 | 0.39% | 0.41% | 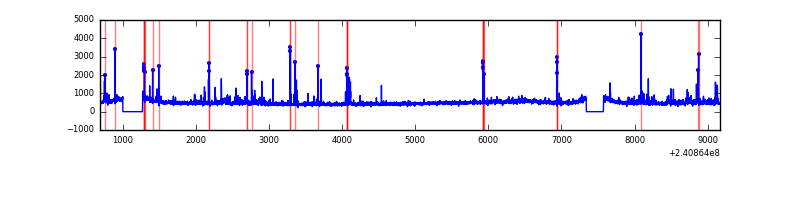 |
| C | 8481 | 7978 | 0 | 0 | 0.00% | 0.00% | 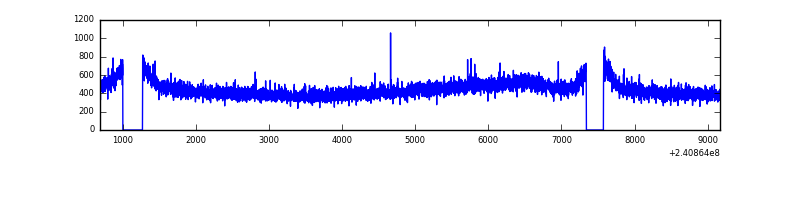 |
| D | 8481 | 7978 | 75 | 75 | 0.88% | 0.94% | 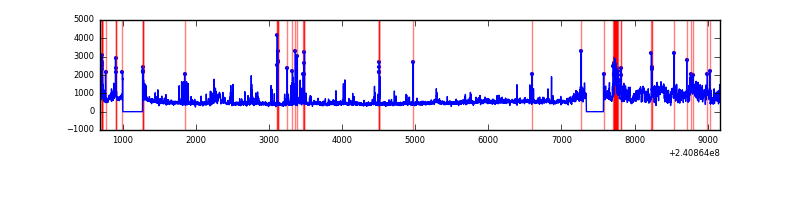 |
Top three noisy pixels from each quadrant. If the there are fewer than three noisy pixels in the level2.evt file, extra rows are filled as -1
| Pixel properties | Quadrant properties | ||||||
|---|---|---|---|---|---|---|---|
| Quadrant | DetID | PixID | Counts | Sigma | Mean | Median | Sigma |
| A | 8 | 15 | 159019 | 827.55 | 930 | 909 | 191.1 |
| A | 15 | 174 | 59919 | 308.86 | 930 | 909 | 191.1 |
| A | 0 | 226 | 8669 | 40.62 | 930 | 909 | 191.1 |
| B | 11 | 51 | 118262 | 659.51 | 932 | 910 | 177.9 |
| B | 4 | 239 | 102799 | 572.61 | 932 | 910 | 177.9 |
| B | 0 | 214 | 78587 | 436.54 | 932 | 910 | 177.9 |
| C | 0 | 207 | 8552 | 36.69 | 896 | 901 | 208.5 |
| C | 13 | 61 | 6813 | 28.35 | 896 | 901 | 208.5 |
| C | 14 | 67 | 4025 | 14.98 | 896 | 901 | 208.5 |
| D | 1 | 52 | 1129060 | 5227.57 | 890 | 866 | 215.8 |
| D | 8 | 195 | 358627 | 1657.71 | 890 | 866 | 215.8 |
| D | 12 | 233 | 73110 | 334.75 | 890 | 866 | 215.8 |
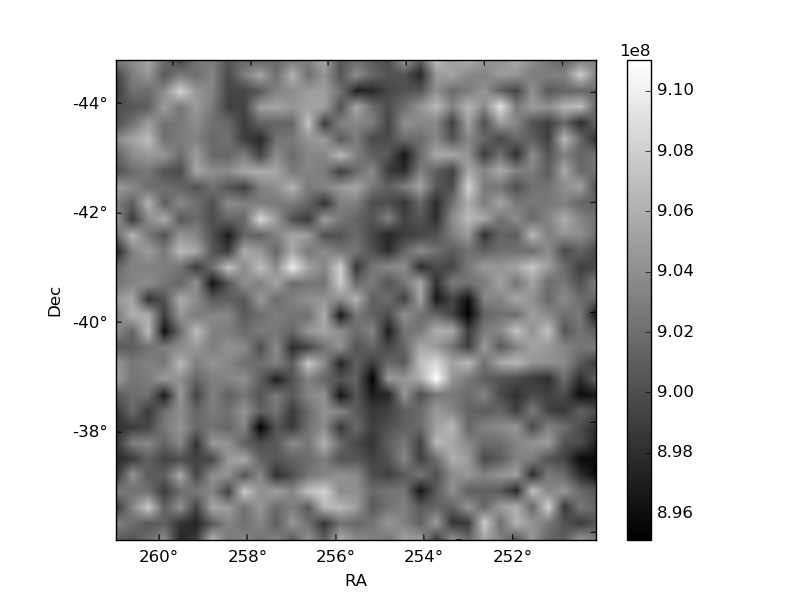
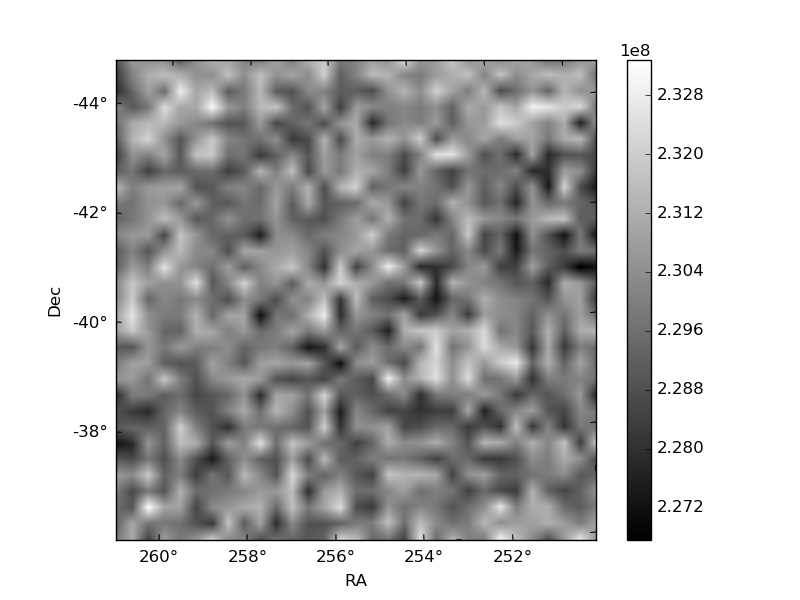
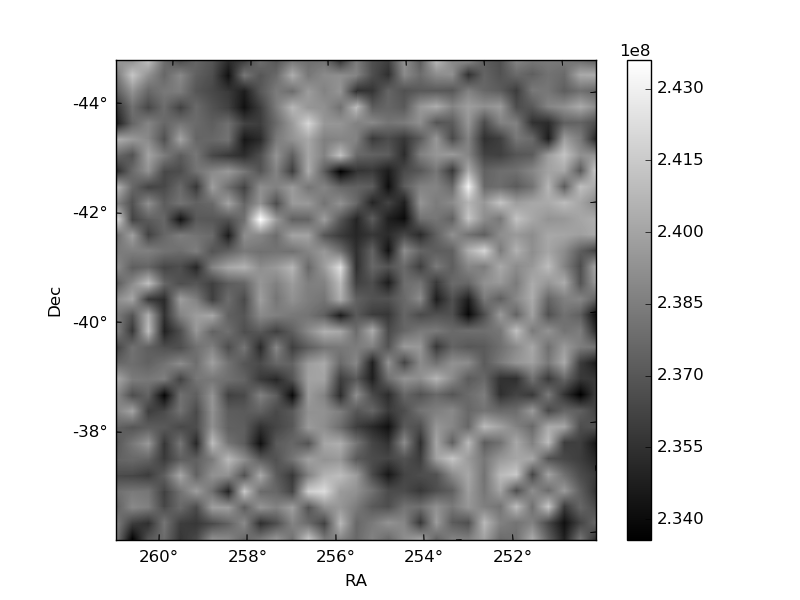
Histogram calculated using DETX and DETY for each event in the final _common_clean file
| Quadrant A | 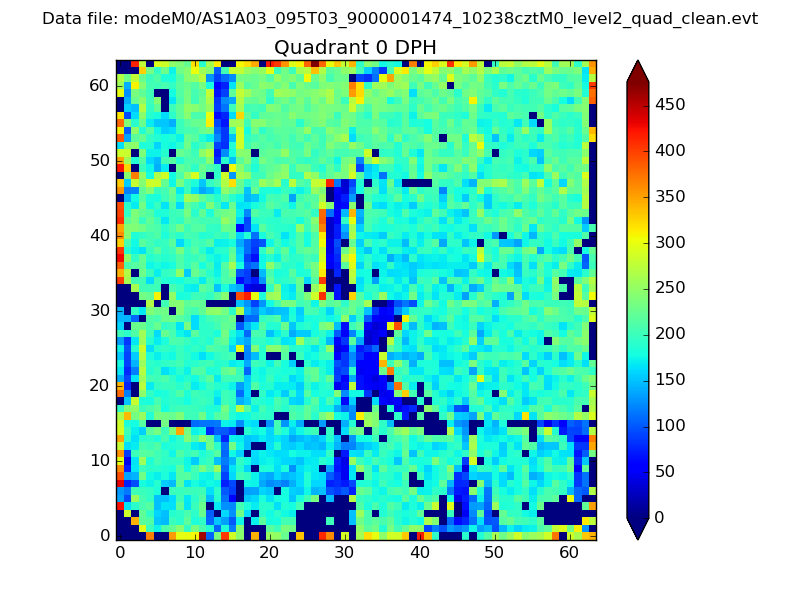 |
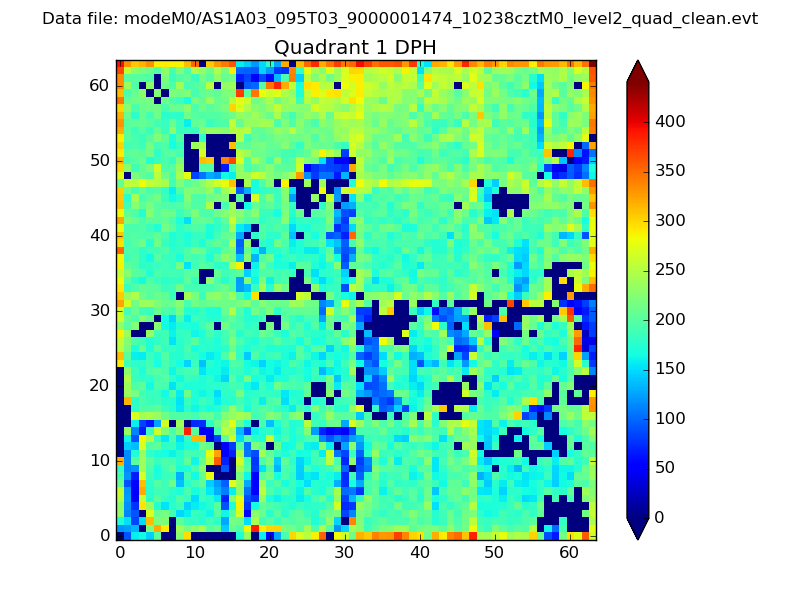 |
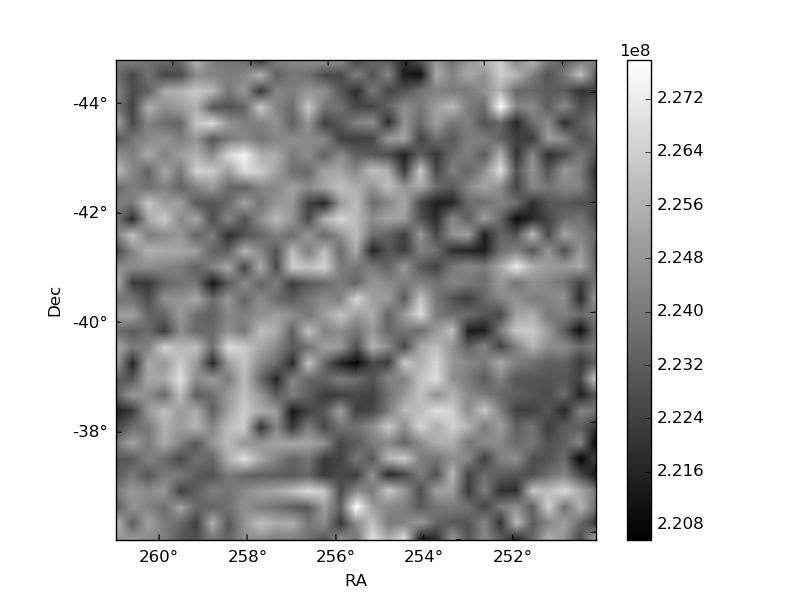
Quadrant B |
|---|---|---|---|
| Quadrant D | 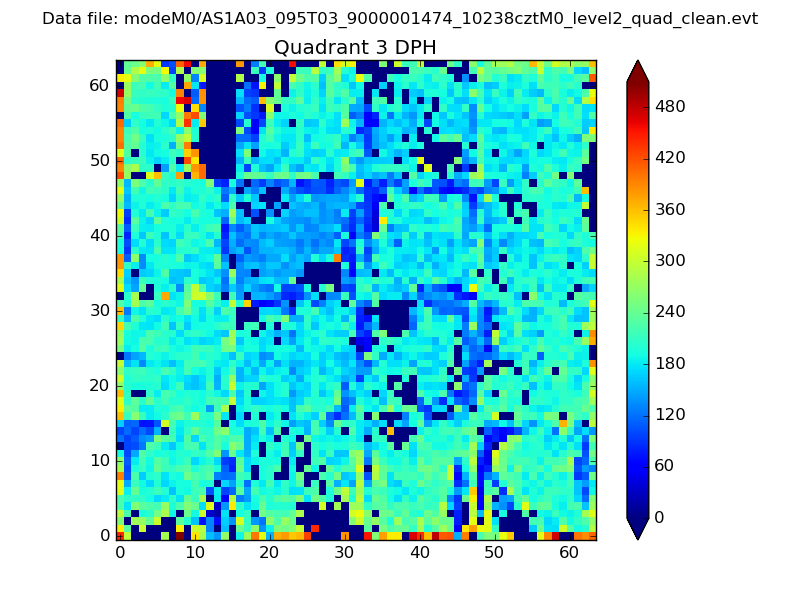 |
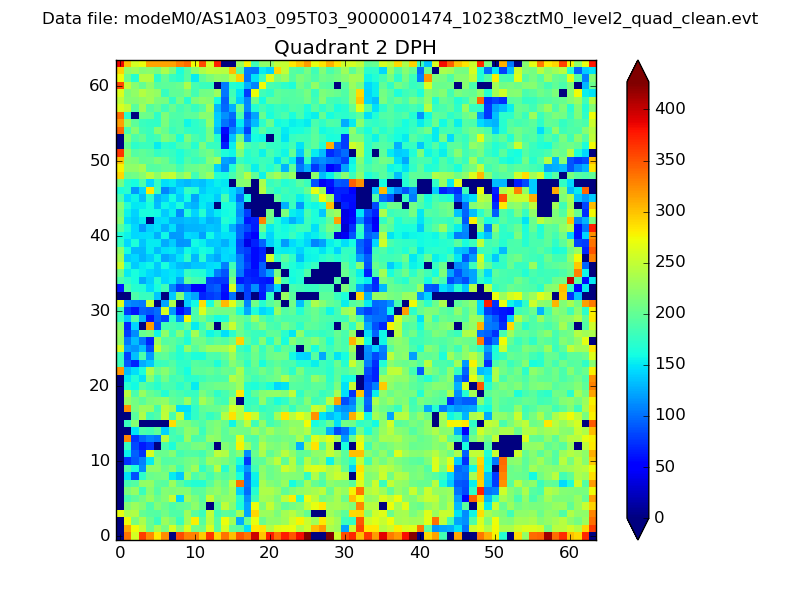 |
Quadrant C |
| Plot type | Count rate plots | Images |
|---|---|---|
| Comparison with Poisson distribution Blue bars denote a histogram of data divided into 1 sec bins. Red curve is a Poisson curve with rate = median count rate of data. |
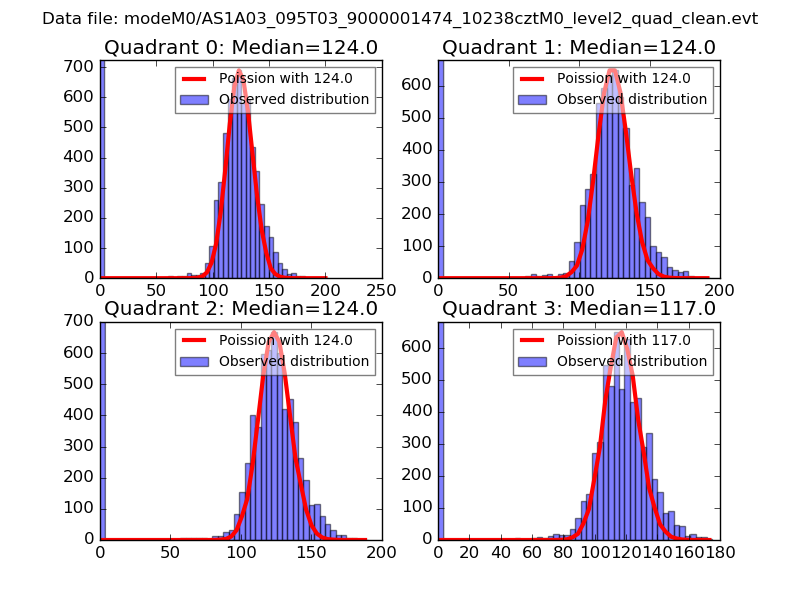 |
 |
| Quadrant-wise count rates Data is divided into 100 sec bins |
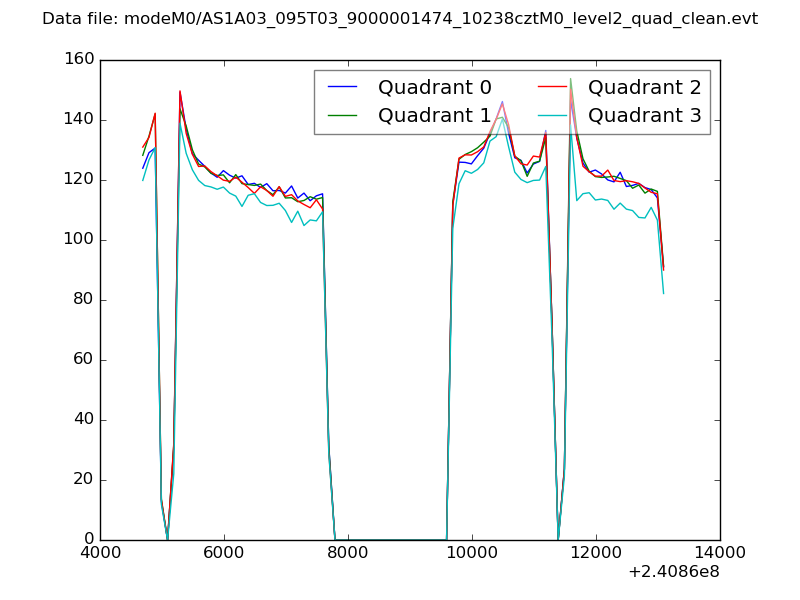 |
|
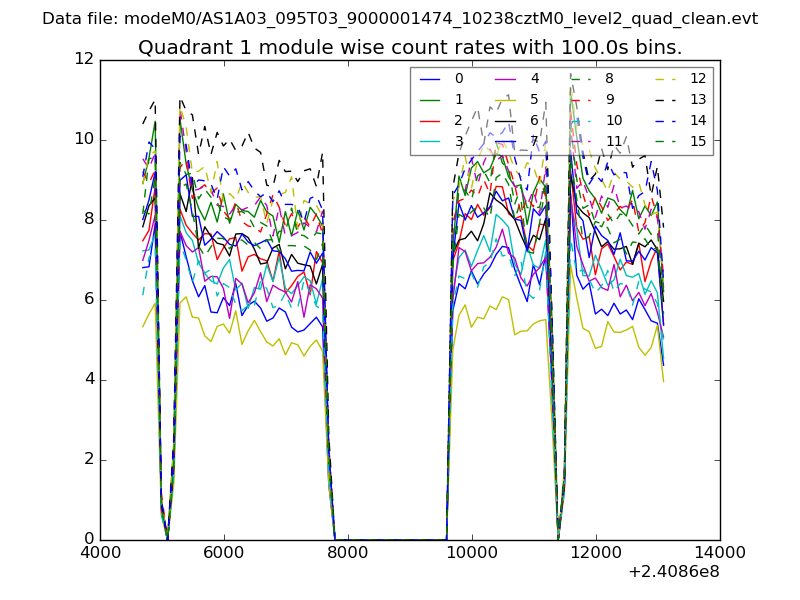
| Module-wise count rates for Quadrant A Data is divided into 100 sec bins |
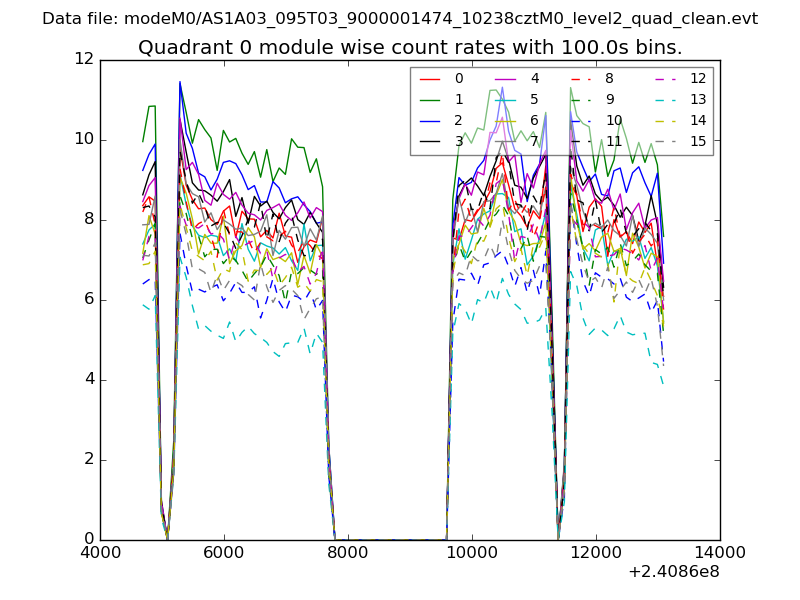 |
 |
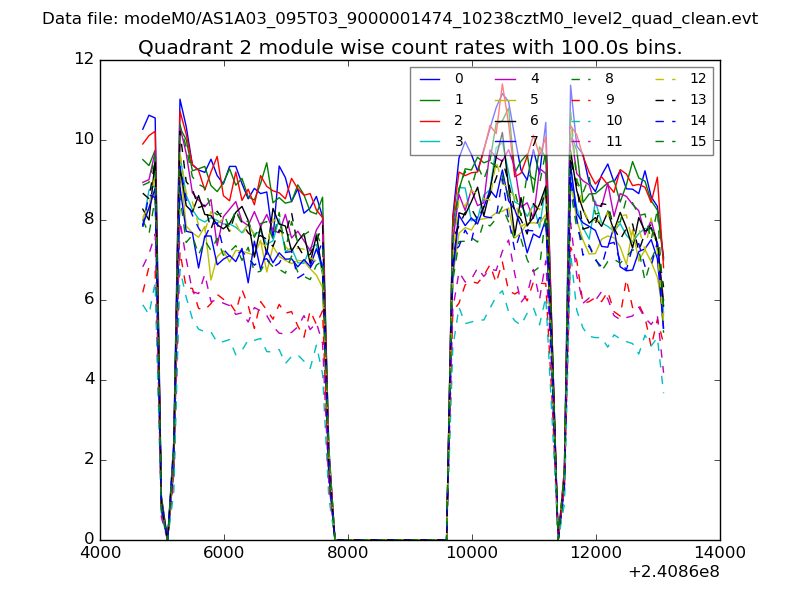
| Module-wise count rates for Quadrant B Data is divided into 100 sec bins |
 |
 |
| Module-wise count rates for Quadrant C Data is divided into 100 sec bins |
 |
 |
| Module-wise count rates for Quadrant D Data is divided into 100 sec bins |
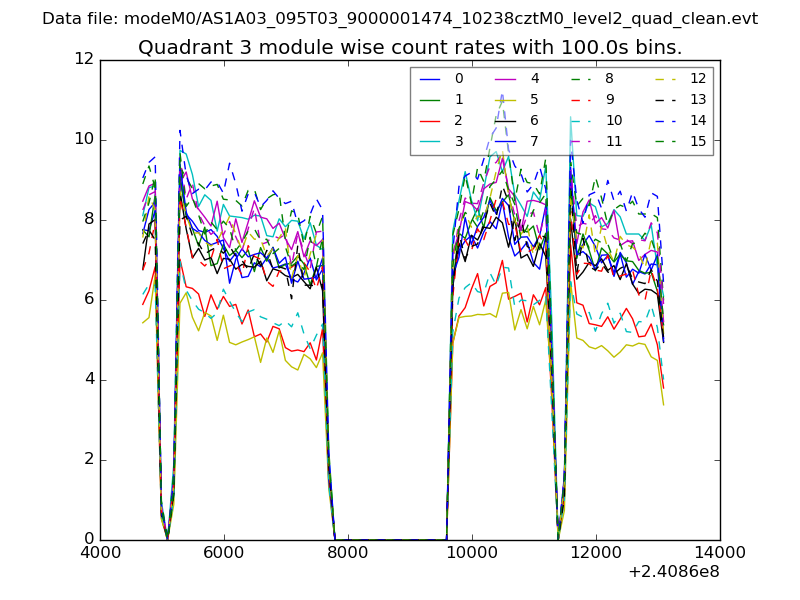 |
 |
| Parameter | Plot |
|---|---|
| CZT HV Monitor | 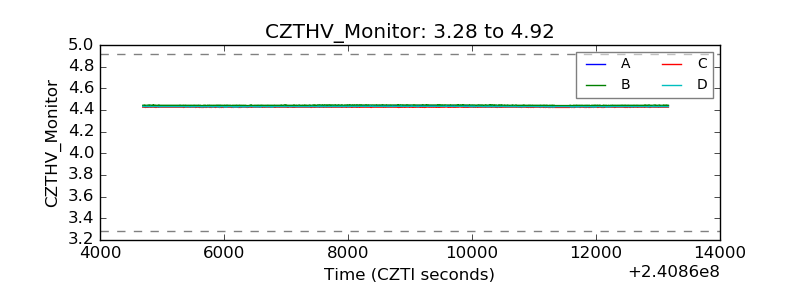 |
| D_VDD | 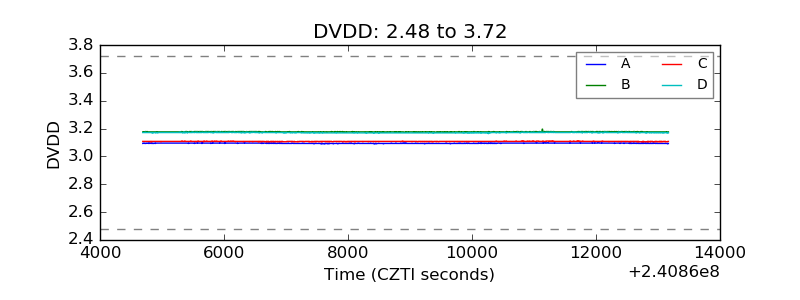 |
| Temperature 1 | 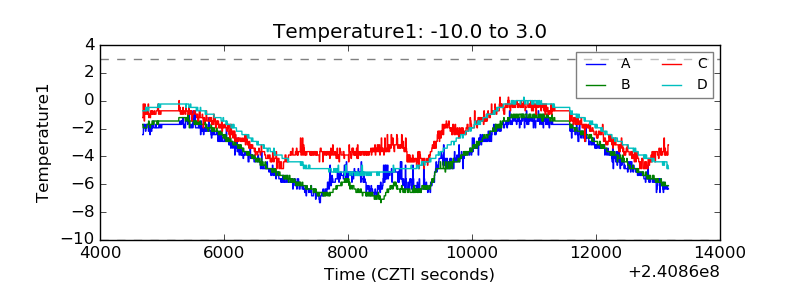 |
| Veto HV Monitor | 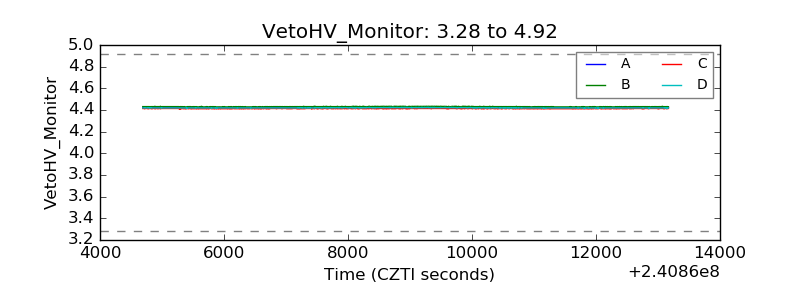 |
| Veto LLD | 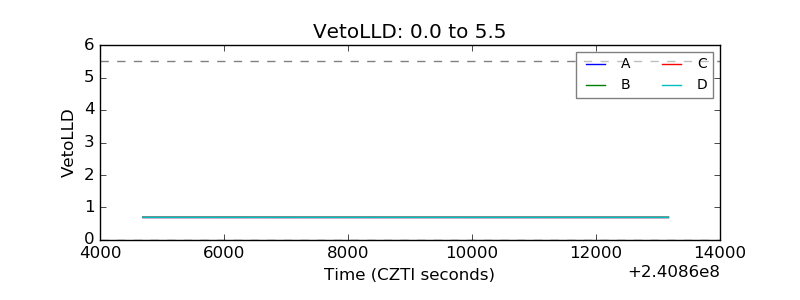 |
| Alpha Counter | 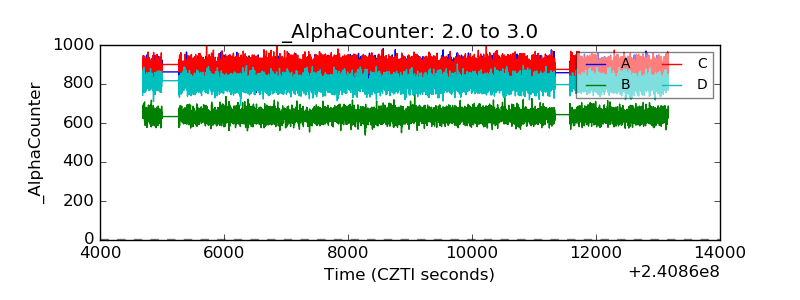 |
| _CPM_Rate | 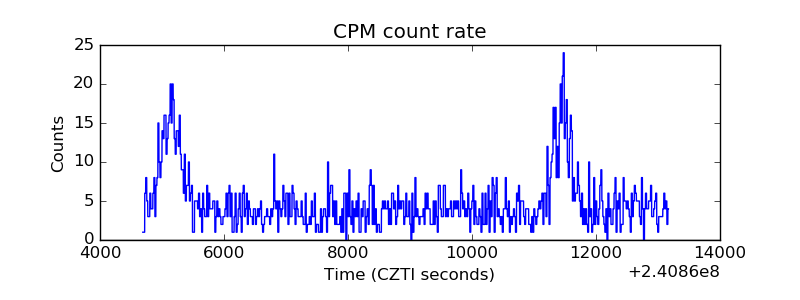 |
| CZT Counter | 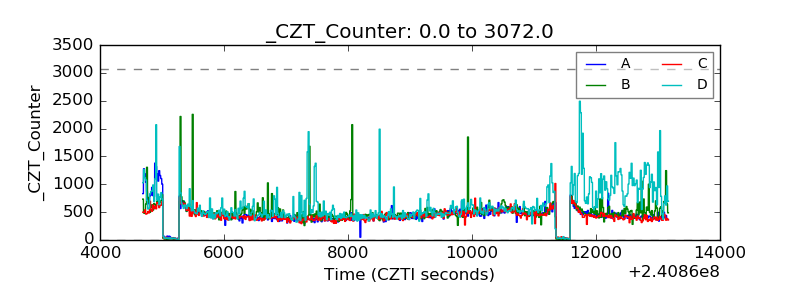 |
| +2.5 Volts monitor | 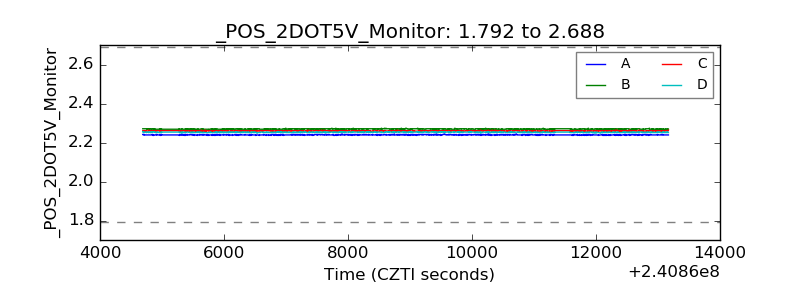 |
| +5 Volts monitor |  |
| _ROLL_ROT | 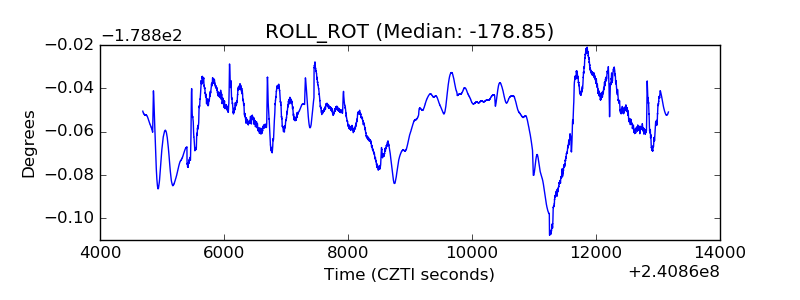 |
| _Roll_DEC | 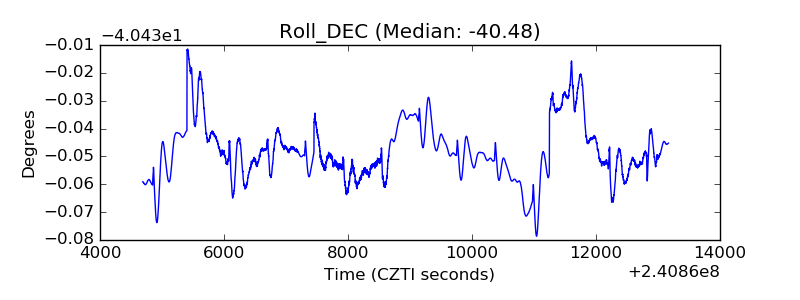 |
| _Roll_RA | 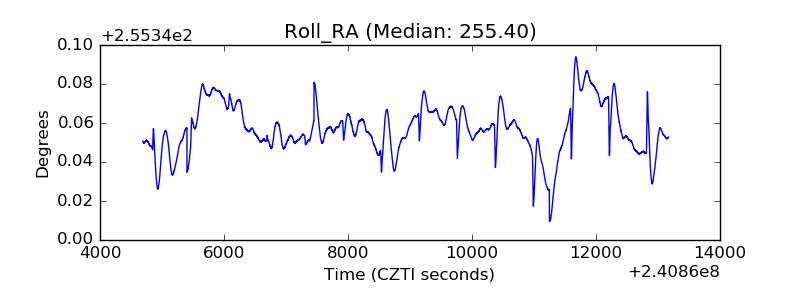 |
| Veto Counter | 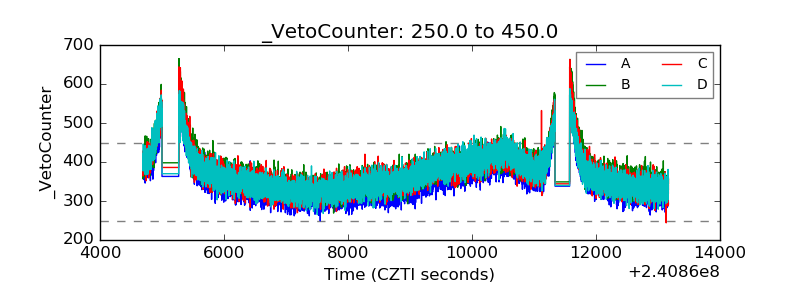 |