| Param | Original file | Final file |
|---|---|---|
| Filename | modeM0/AS1A03_095T03_9000001474_10239cztM0_level2.evt | modeM0/AS1A03_095T03_9000001474_10239cztM0_level2_quad_clean.evt |
| Size (bytes) | 605,574,720 | 115,634,880 |
| Size | 577.5 MB | 110.3 MB |
| Events in quadrant A | 3,700,133 | 748,305 |
| Events in quadrant B | 4,136,904 | 748,415 |
| Events in quadrant C | 3,526,626 | 746,844 |
| Events in quadrant D | 6,426,739 | 695,106 |
| Mode SS | |||
|---|---|---|---|
| Quadrant | BADHDUFLAG | Total packets | Discarded packets |
| A | 0 | 166 | 0 |
| B | 0 | 166 | 0 |
| C | 0 | 166 | 0 |
| D | 0 | 166 | 0 |
| Mode M0 | |||
|---|---|---|---|
| Quadrant | BADHDUFLAG | Total packets | Discarded packets |
| A | 0 | 16735 | 3 |
| B | 0 | 17705 | 2 |
| C | 0 | 16471 | 2 |
| D | 0 | 24750 | 2 |
| Mode M9 | |||
|---|---|---|---|
| Quadrant | BADHDUFLAG | Total packets | Discarded packets |
| A | 0 | 6 | 0 |
| B | 0 | 6 | 0 |
| C | 0 | 6 | 0 |
| D | 0 | 6 | 0 |
| Quadrant | Total seconds | Saturated seconds | Saturation percentage |
|---|---|---|---|
| A | 8107 | 52 | 0.641421% |
| B | 8107 | 114 | 1.406192% |
| C | 8107 | 23 | 0.283705% |
| D | 8107 | 207 | 2.553349% |
Noise dominated data is calculated using 1-second bins in cleaned event files. If a bin has >2000 counts, and if more than 50% of those come from <1% of pixels, then it is considered to be noise-dominated and hence unusable.
| Quadrant | # 1 sec bins | Bins with >0 counts | Bins with >2000 counts | High rate bins dominated by noise | Noise dominated (total time) | Noise dominated (detector-on time) | Marked lightcurve |
|---|---|---|---|---|---|---|---|
| A | 8767 | 8109 | 11 | 11 | 0.13% | 0.14% | 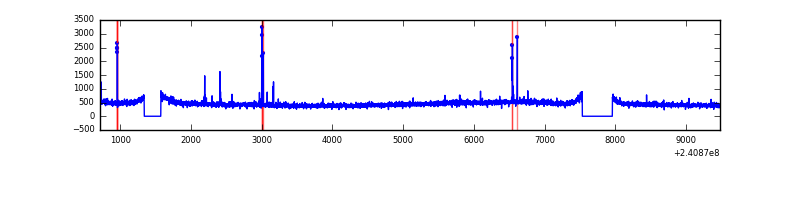 |
| B | 8767 | 8109 | 37 | 37 | 0.42% | 0.46% | 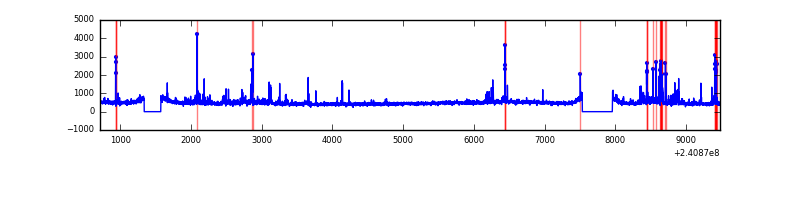 |
| C | 8767 | 8109 | 0 | 0 | 0.00% | 0.00% | 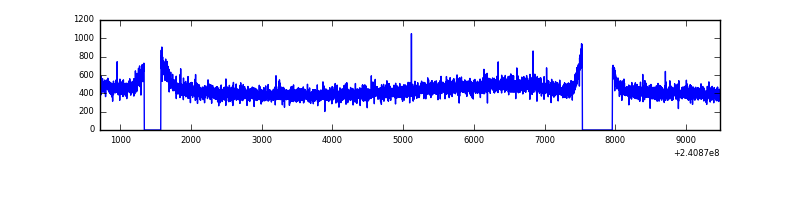 |
| D | 8767 | 8109 | 134 | 134 | 1.53% | 1.65% | 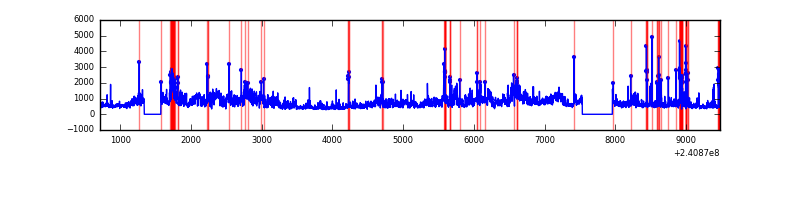 |
Top three noisy pixels from each quadrant. If the there are fewer than three noisy pixels in the level2.evt file, extra rows are filled as -1
| Pixel properties | Quadrant properties | ||||||
|---|---|---|---|---|---|---|---|
| Quadrant | DetID | PixID | Counts | Sigma | Mean | Median | Sigma |
| A | 15 | 174 | 66588 | 339.21 | 937 | 917 | 193.6 |
| A | 8 | 15 | 17375 | 85.01 | 937 | 917 | 193.6 |
| A | 3 | 1 | 9736 | 45.55 | 937 | 917 | 193.6 |
| B | 11 | 51 | 128037 | 706.47 | 938 | 917 | 179.9 |
| B | 4 | 239 | 106337 | 585.87 | 938 | 917 | 179.9 |
| B | 0 | 219 | 74301 | 407.83 | 938 | 917 | 179.9 |
| C | 0 | 207 | 7806 | 33.02 | 901 | 903 | 209.1 |
| C | 13 | 61 | 6986 | 29.09 | 901 | 903 | 209.1 |
| C | 12 | 4 | 2986 | 9.96 | 901 | 903 | 209.1 |
| D | 1 | 52 | 2283163 | 10654.04 | 889 | 862 | 214.2 |
| D | 8 | 195 | 455801 | 2123.71 | 889 | 862 | 214.2 |
| D | 12 | 233 | 73481 | 338.99 | 889 | 862 | 214.2 |
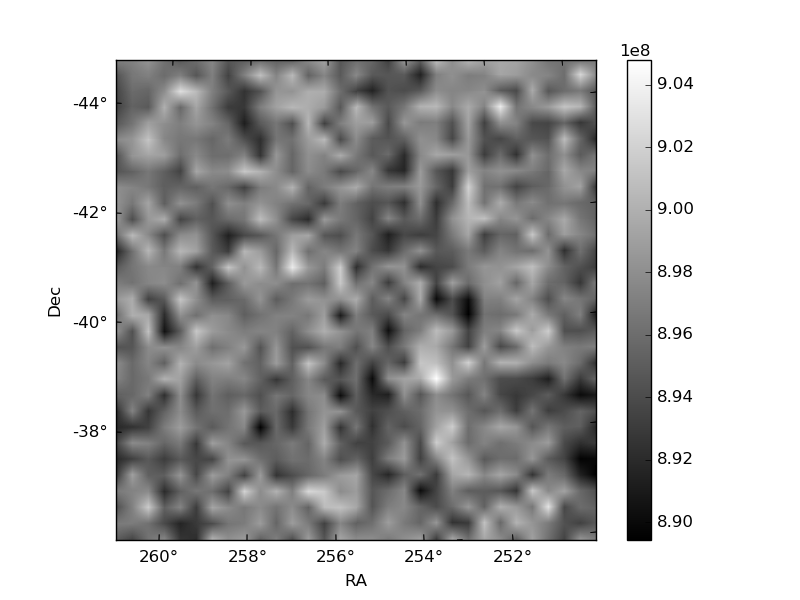
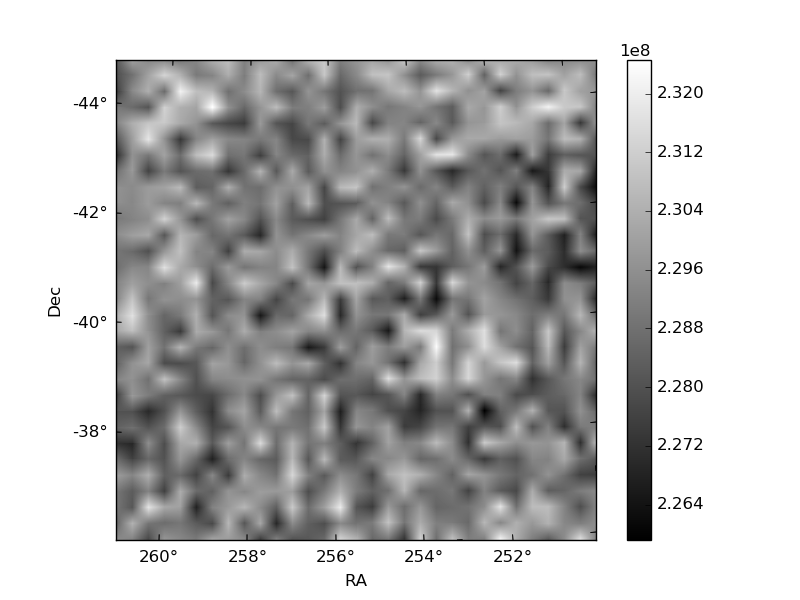
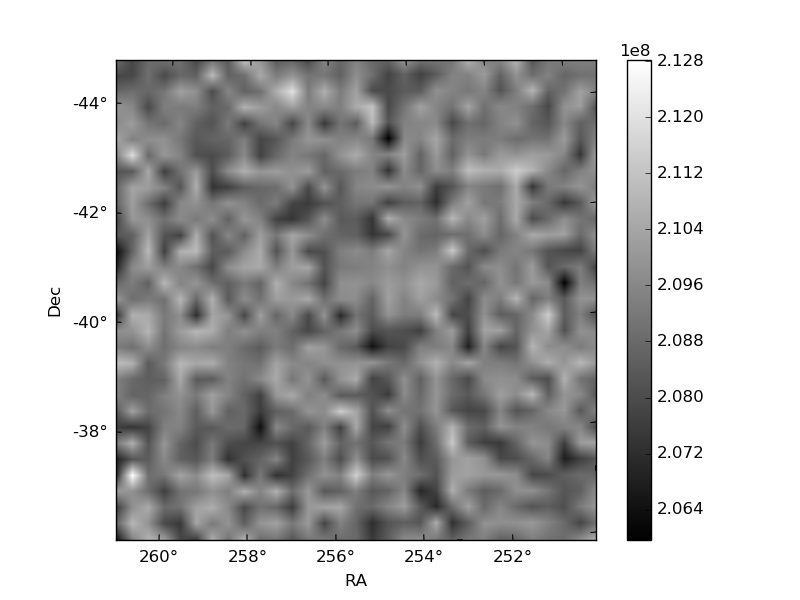
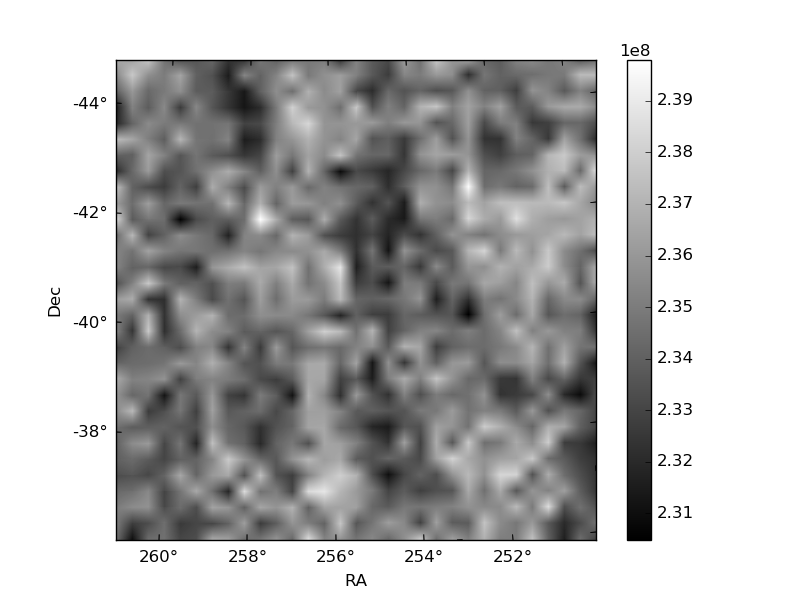
Histogram calculated using DETX and DETY for each event in the final _common_clean file
| Quadrant A | 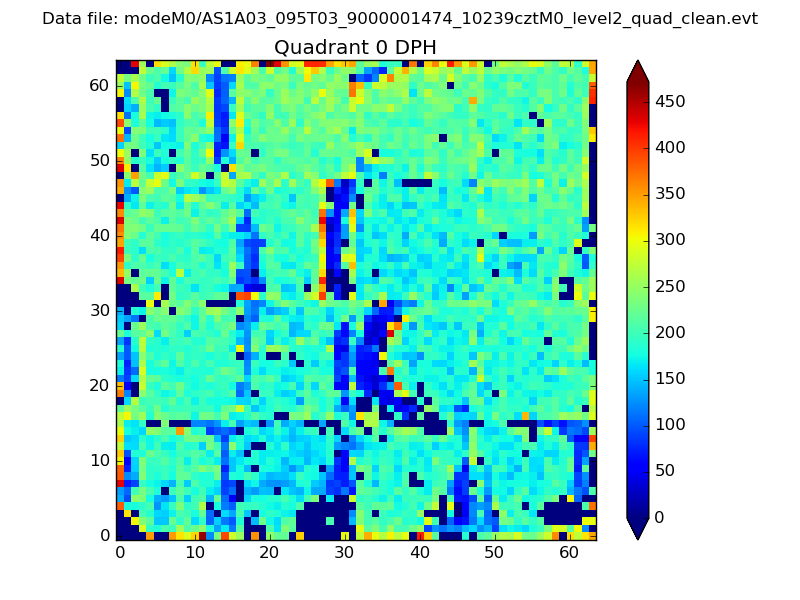 |
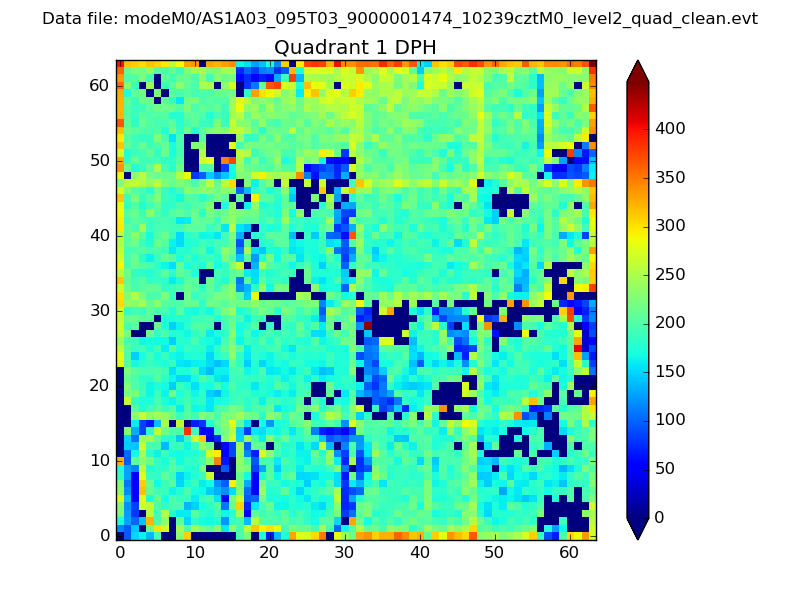 |
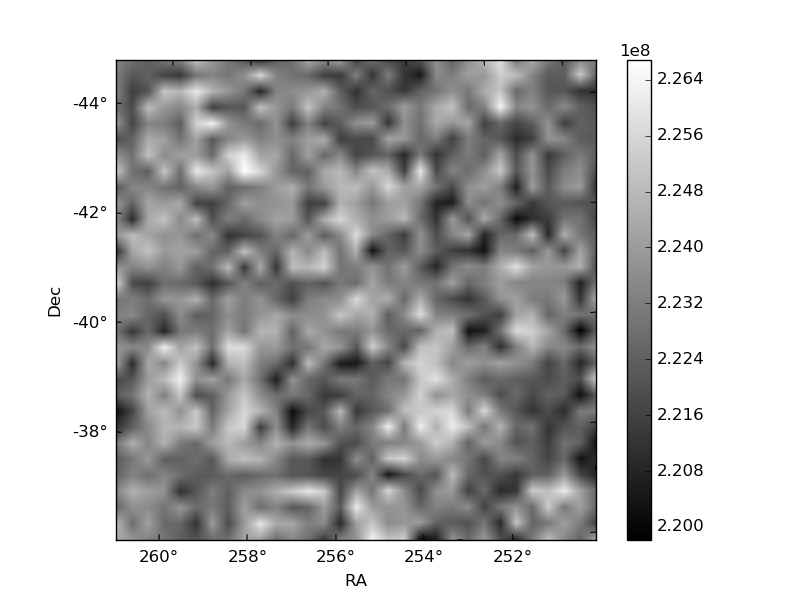
Quadrant B |
|---|---|---|---|
| Quadrant D | 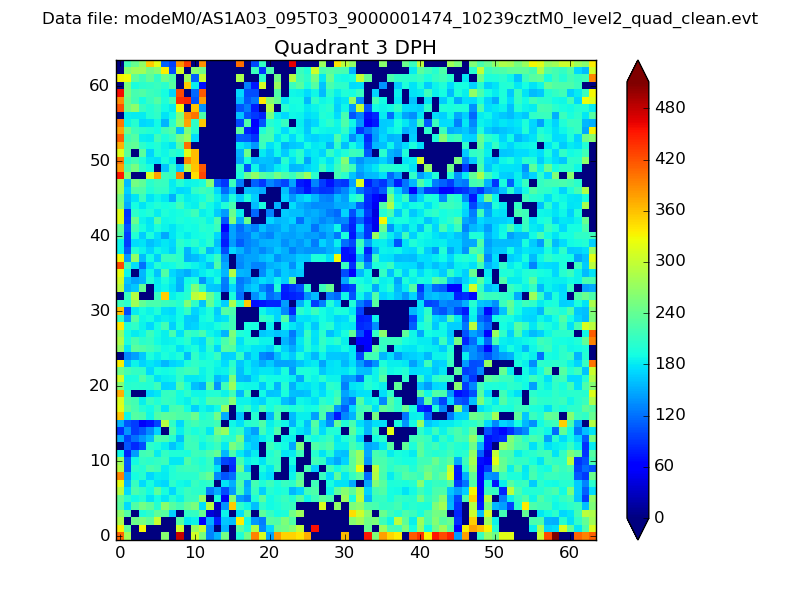 |
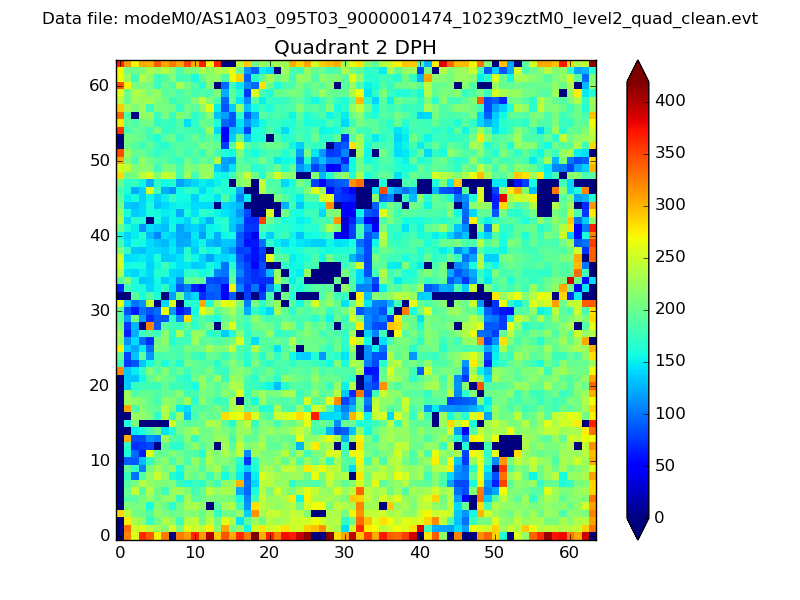 |
Quadrant C |
| Plot type | Count rate plots | Images |
|---|---|---|
| Comparison with Poisson distribution Blue bars denote a histogram of data divided into 1 sec bins. Red curve is a Poisson curve with rate = median count rate of data. |
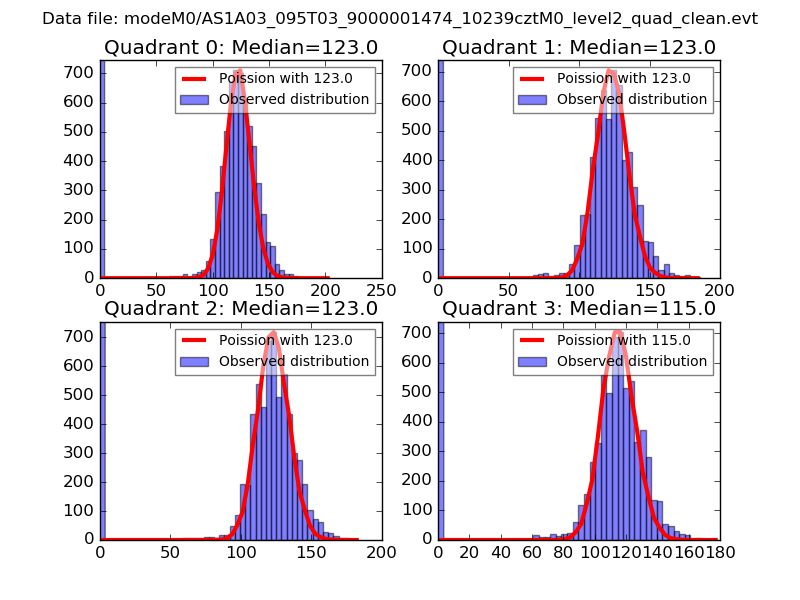 |
 |
| Quadrant-wise count rates Data is divided into 100 sec bins |
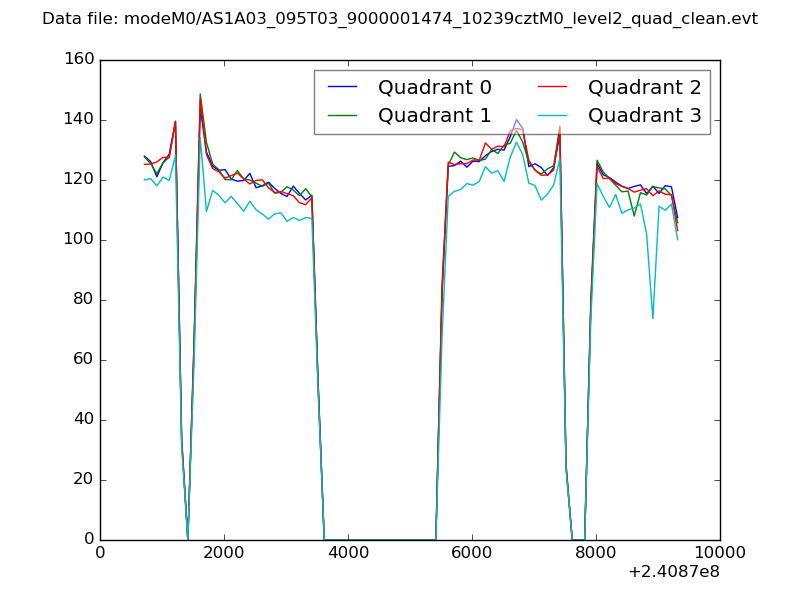 |
|
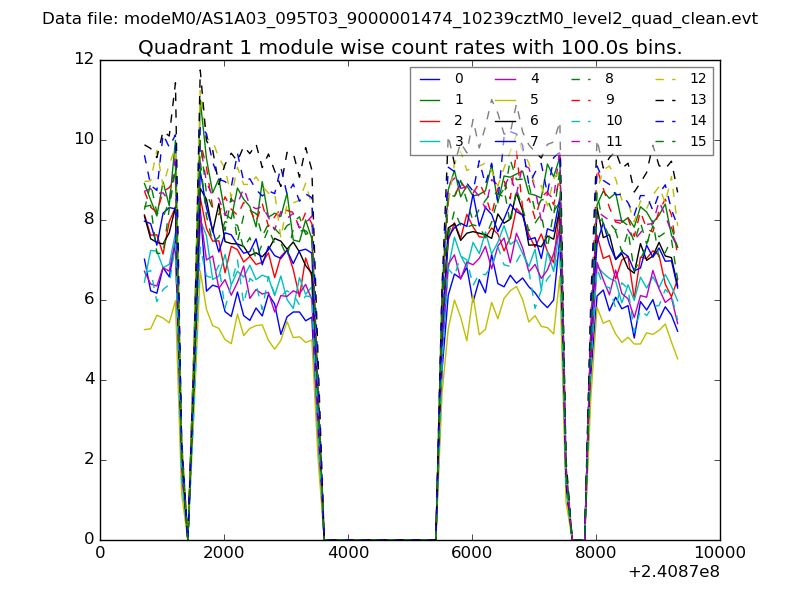
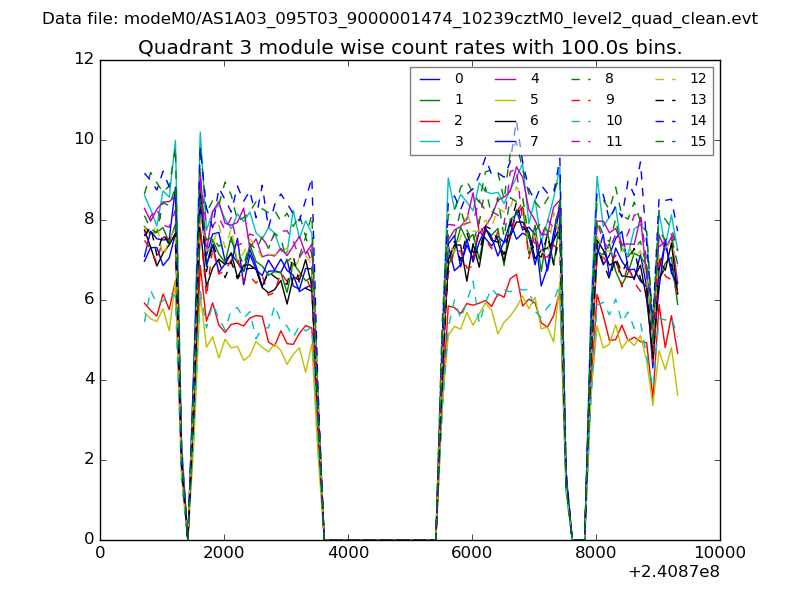
| Module-wise count rates for Quadrant A Data is divided into 100 sec bins |
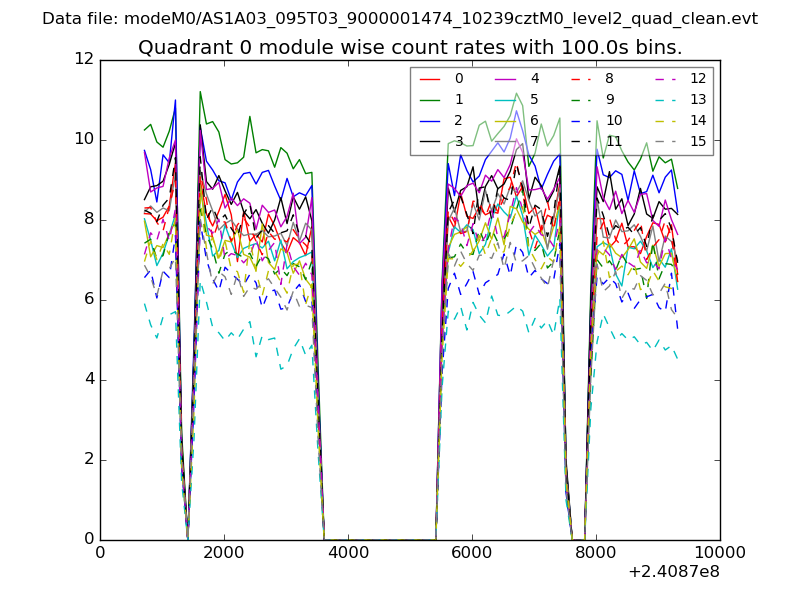 |
 |
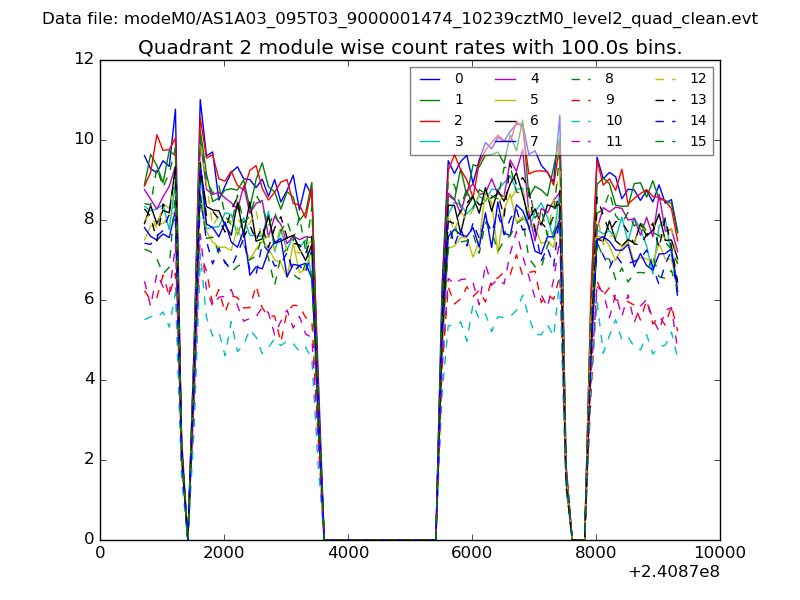
| Module-wise count rates for Quadrant B Data is divided into 100 sec bins |
 |
 |
| Module-wise count rates for Quadrant C Data is divided into 100 sec bins |
 |
 |
| Module-wise count rates for Quadrant D Data is divided into 100 sec bins |
 |
 |
| Parameter | Plot |
|---|---|
| CZT HV Monitor | 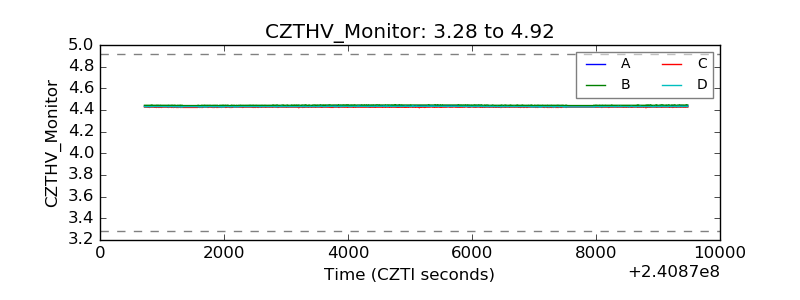 |
| D_VDD | 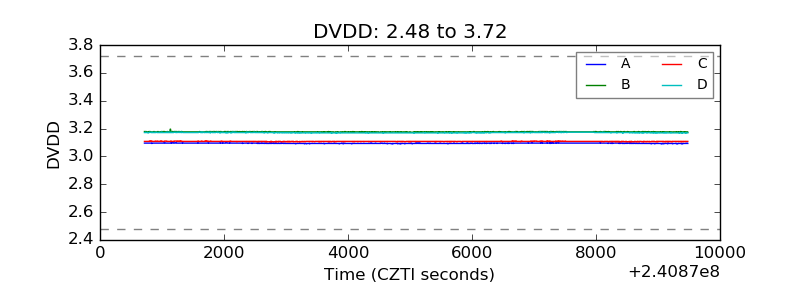 |
| Temperature 1 | 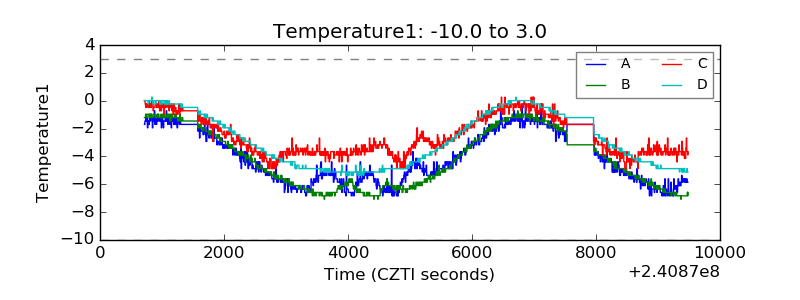 |
| Veto HV Monitor |  |
| Veto LLD | 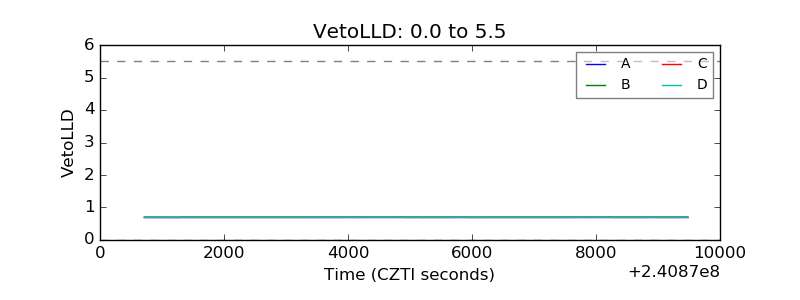 |
| Alpha Counter | 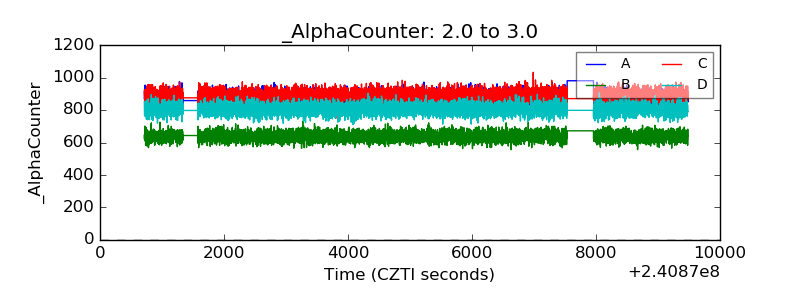 |
| _CPM_Rate | 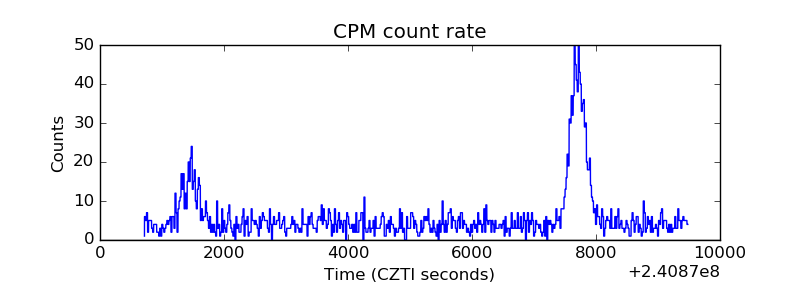 |
| CZT Counter | 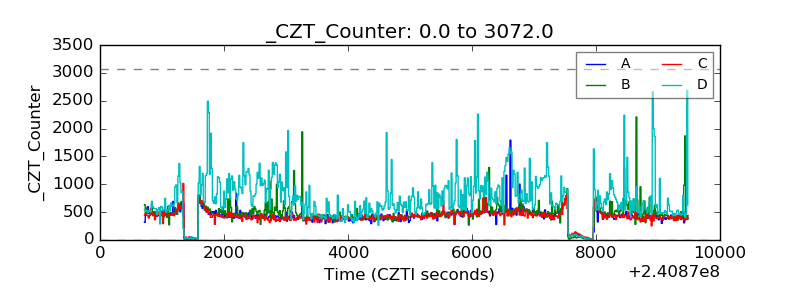 |
| +2.5 Volts monitor |  |
| +5 Volts monitor |  |
| _ROLL_ROT | 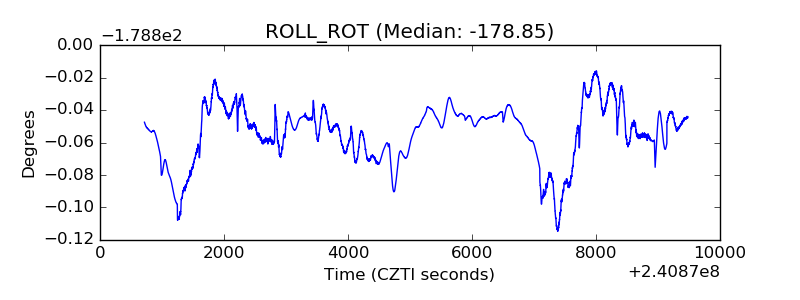 |
| _Roll_DEC | 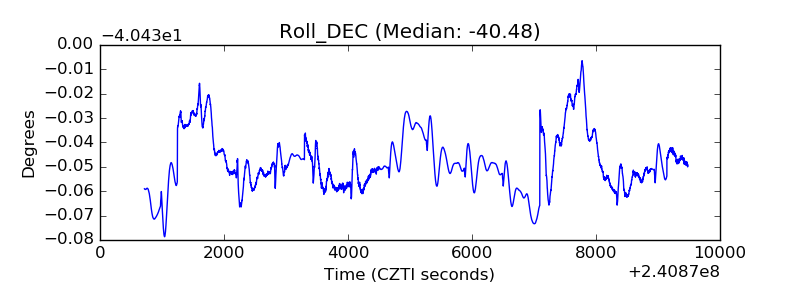 |
| _Roll_RA | 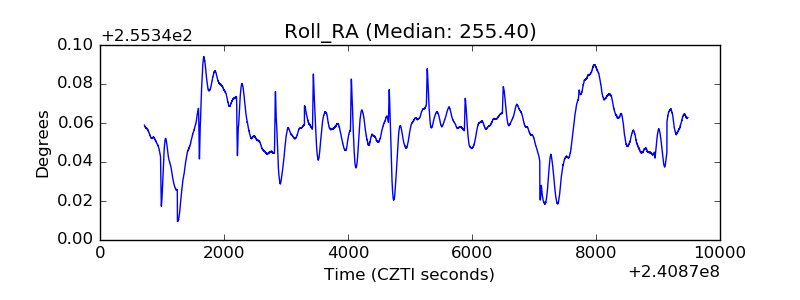 |
| Veto Counter | 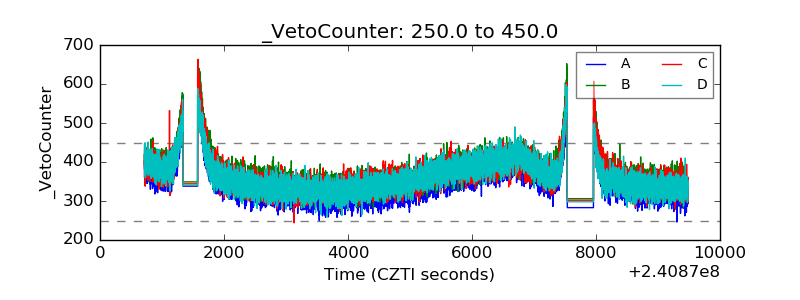 |