| Param | Original file | Final file |
|---|---|---|
| Filename | modeM0/AS1A03_095T03_9000001474_10241cztM0_level2.evt | modeM0/AS1A03_095T03_9000001474_10241cztM0_level2_quad_clean.evt |
| Size (bytes) | 917,928,000 | 152,928,000 |
| Size | 875.4 MB | 145.8 MB |
| Events in quadrant A | 5,564,961 | 958,038 |
| Events in quadrant B | 6,417,425 | 955,920 |
| Events in quadrant C | 5,448,185 | 958,077 |
| Events in quadrant D | 9,514,116 | 885,986 |
| Mode SS | |||
|---|---|---|---|
| Quadrant | BADHDUFLAG | Total packets | Discarded packets |
| A | 0 | 258 | 0 |
| B | 0 | 258 | 0 |
| C | 0 | 258 | 0 |
| D | 0 | 258 | 0 |
| Mode M0 | |||
|---|---|---|---|
| Quadrant | BADHDUFLAG | Total packets | Discarded packets |
| A | 0 | 25551 | 4 |
| B | 0 | 27694 | 3 |
| C | 0 | 25478 | 3 |
| D | 0 | 36583 | 3 |
| Mode M9 | |||
|---|---|---|---|
| Quadrant | BADHDUFLAG | Total packets | Discarded packets |
| A | 0 | 16 | 0 |
| B | 0 | 16 | 0 |
| C | 0 | 16 | 0 |
| D | 0 | 17 | 0 |
| Quadrant | Total seconds | Saturated seconds | Saturation percentage |
|---|---|---|---|
| A | 12630 | 19 | 0.150435% |
| B | 12630 | 163 | 1.290578% |
| C | 12630 | 14 | 0.110847% |
| D | 12630 | 632 | 5.003959% |
Noise dominated data is calculated using 1-second bins in cleaned event files. If a bin has >2000 counts, and if more than 50% of those come from <1% of pixels, then it is considered to be noise-dominated and hence unusable.
| Quadrant | # 1 sec bins | Bins with >0 counts | Bins with >2000 counts | High rate bins dominated by noise | Noise dominated (total time) | Noise dominated (detector-on time) | Marked lightcurve |
|---|---|---|---|---|---|---|---|
| A | 14050 | 12632 | 1 | 1 | 0.01% | 0.01% | 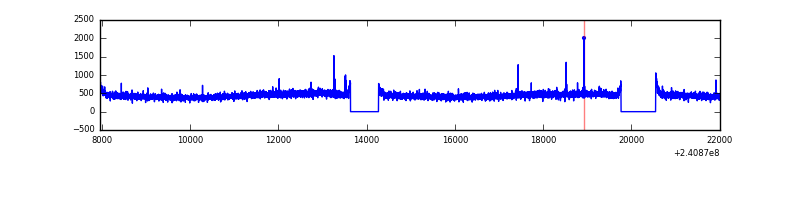 |
| B | 14050 | 12632 | 88 | 88 | 0.63% | 0.70% | 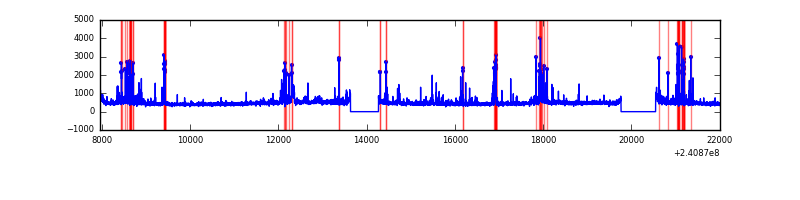 |
| C | 14050 | 12632 | 0 | 0 | 0.00% | 0.00% | 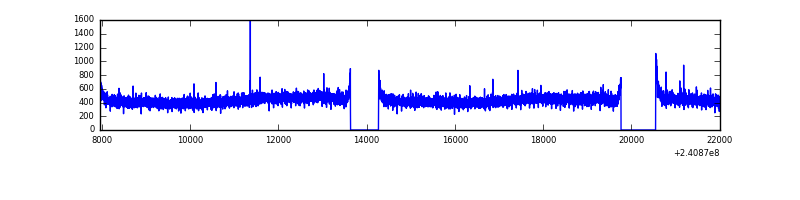 |
| D | 14050 | 12632 | 597 | 597 | 4.25% | 4.73% | 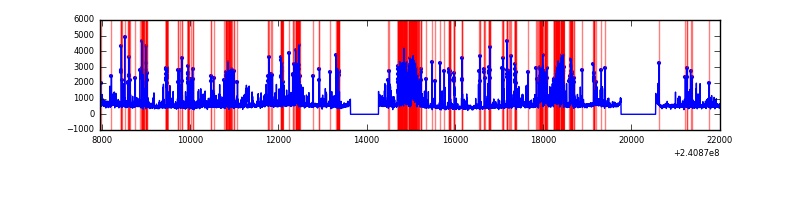 |
Top three noisy pixels from each quadrant. If the there are fewer than three noisy pixels in the level2.evt file, extra rows are filled as -1
| Pixel properties | Quadrant properties | ||||||
|---|---|---|---|---|---|---|---|
| Quadrant | DetID | PixID | Counts | Sigma | Mean | Median | Sigma |
| A | 8 | 15 | 18429 | 58.5 | 1434 | 1403 | 291.1 |
| A | 15 | 174 | 17177 | 54.2 | 1434 | 1403 | 291.1 |
| A | 0 | 226 | 13055 | 40.03 | 1434 | 1403 | 291.1 |
| B | 4 | 239 | 256886 | 935.18 | 1438 | 1403 | 273.2 |
| B | 0 | 219 | 174207 | 632.54 | 1438 | 1403 | 273.2 |
| B | 10 | 247 | 150746 | 546.66 | 1438 | 1403 | 273.2 |
| C | 13 | 61 | 10515 | 28.23 | 1392 | 1399 | 322.9 |
| C | 14 | 67 | 8627 | 22.38 | 1392 | 1399 | 322.9 |
| C | 12 | 4 | 6314 | 15.22 | 1392 | 1399 | 322.9 |
| D | 1 | 52 | 2800016 | 8572.45 | 1354 | 1314 | 326.5 |
| D | 8 | 195 | 934135 | 2857.24 | 1354 | 1314 | 326.5 |
| D | 5 | 222 | 307223 | 937.0 | 1354 | 1314 | 326.5 |
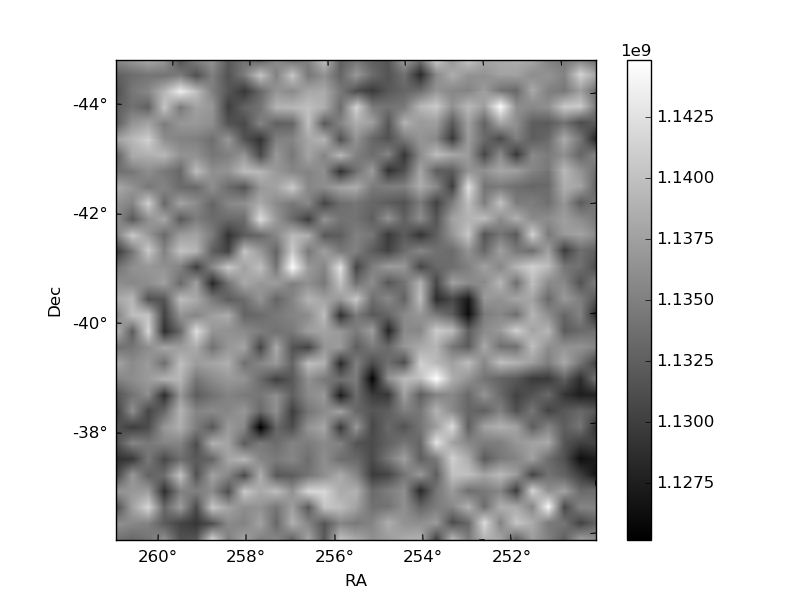
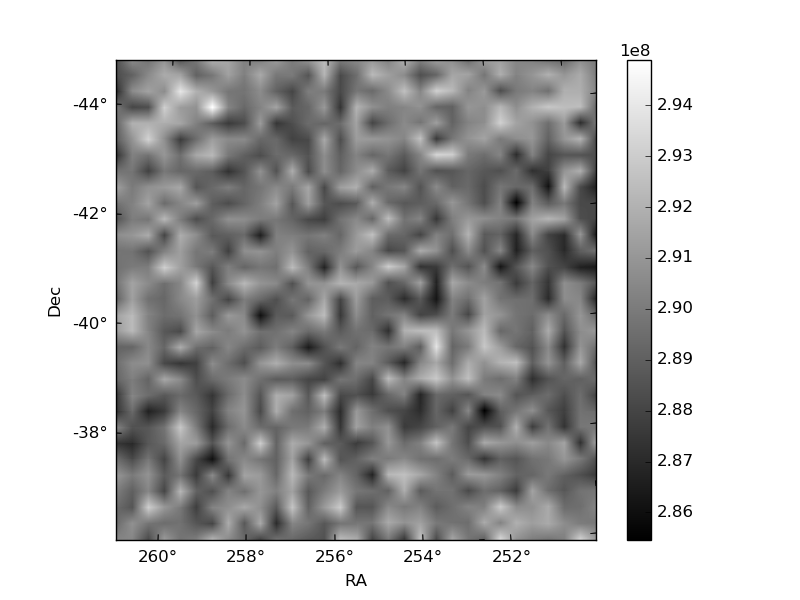
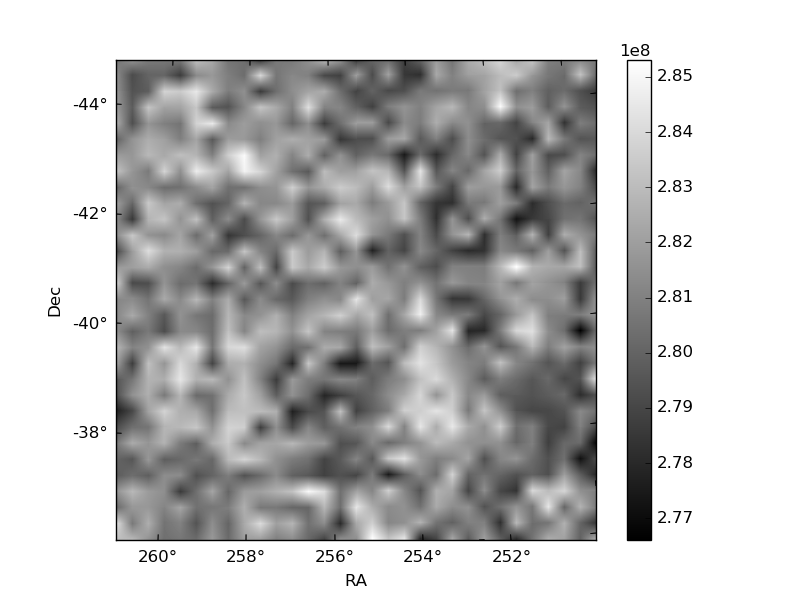
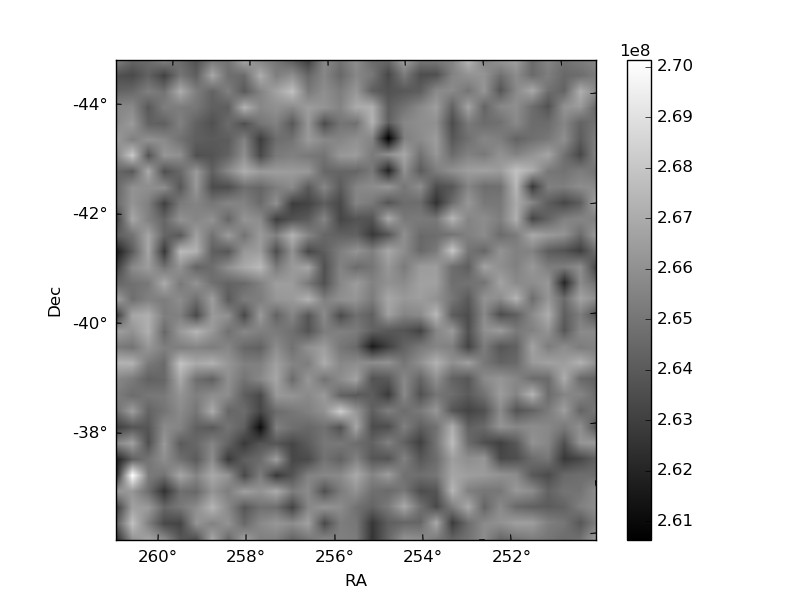
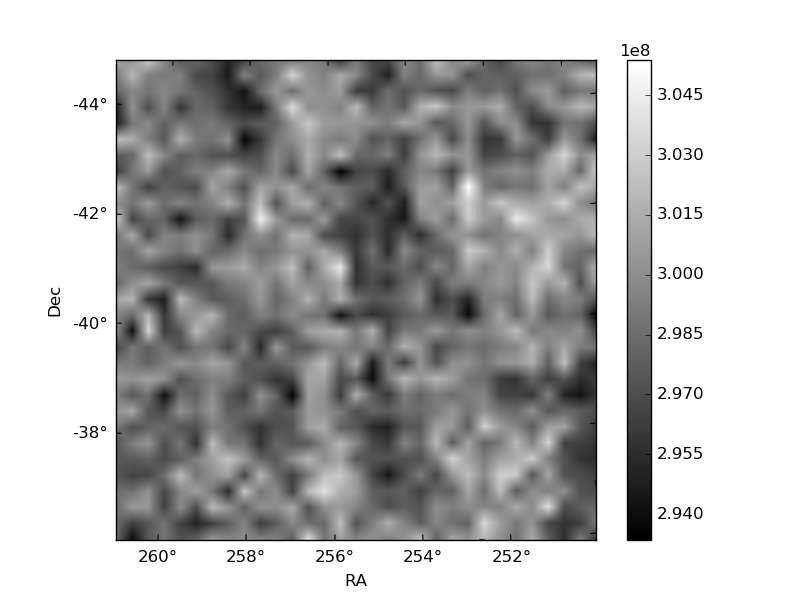
Histogram calculated using DETX and DETY for each event in the final _common_clean file
| Quadrant A | 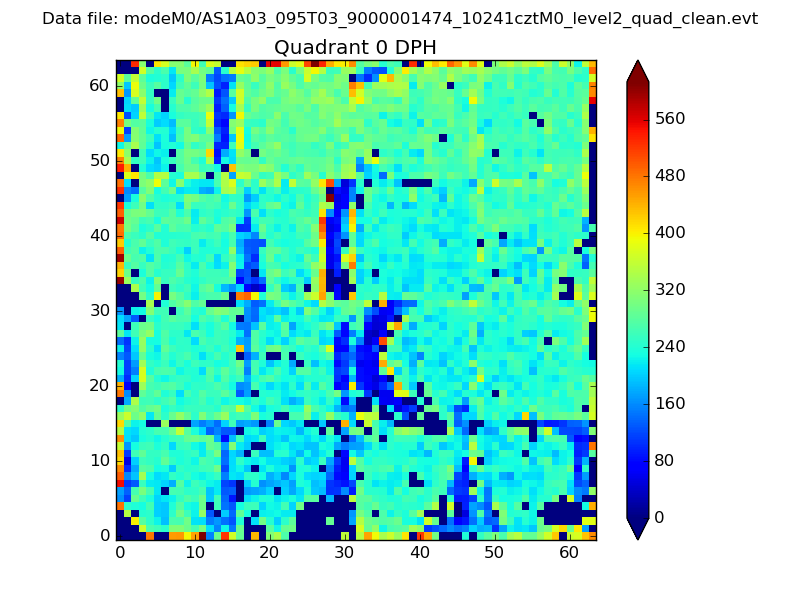 |
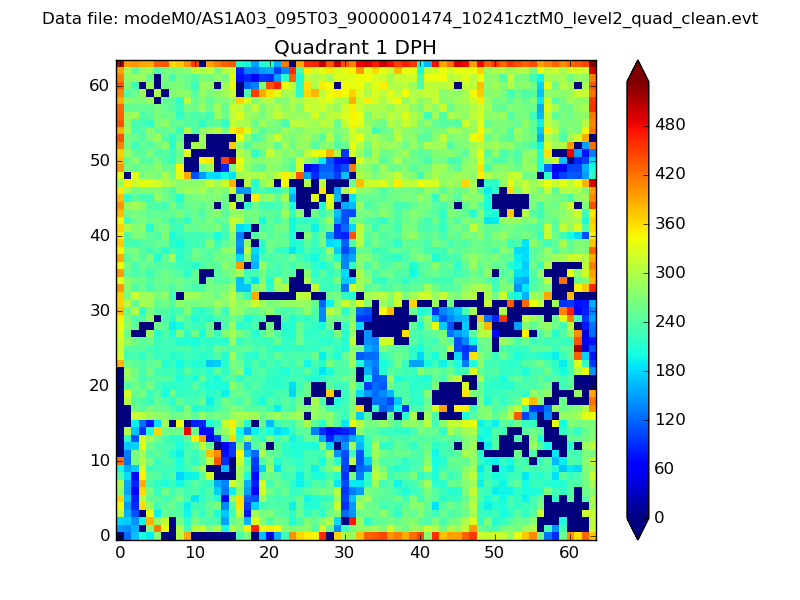 |
Quadrant B |
|---|---|---|---|
| Quadrant D |  |
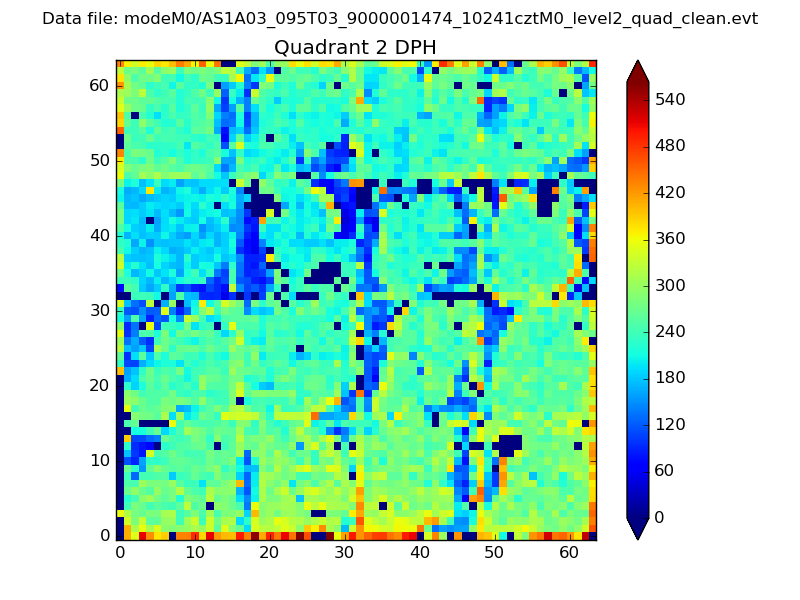 |
Quadrant C |
| Plot type | Count rate plots | Images |
|---|---|---|
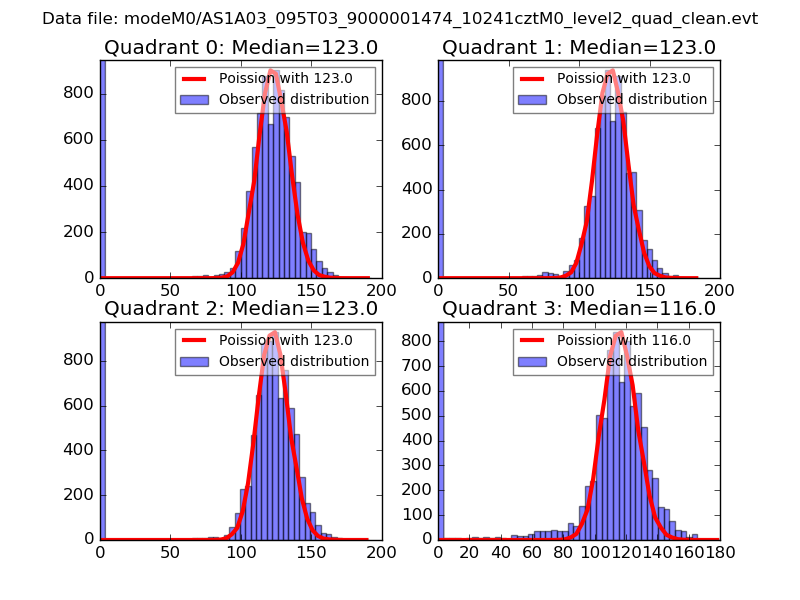
| Comparison with Poisson distribution Blue bars denote a histogram of data divided into 1 sec bins. Red curve is a Poisson curve with rate = median count rate of data. |
 |
 |
| Quadrant-wise count rates Data is divided into 100 sec bins |
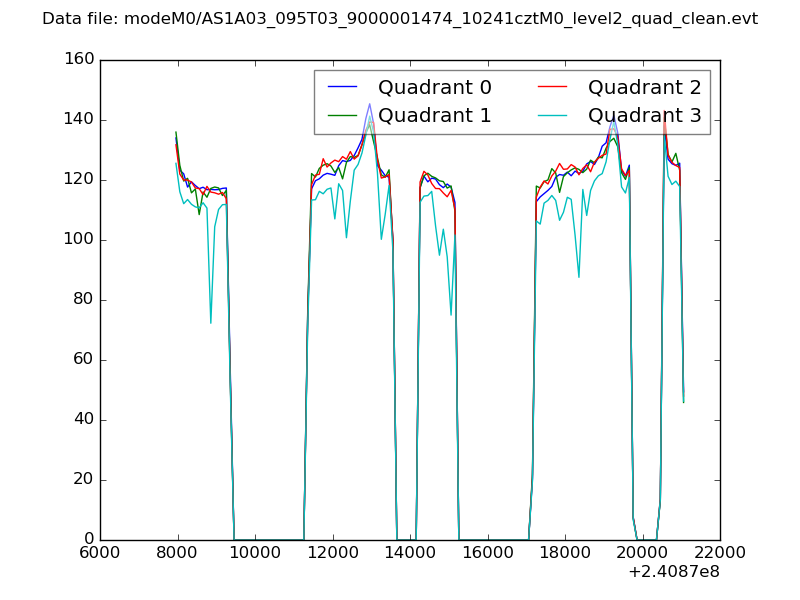 |
|
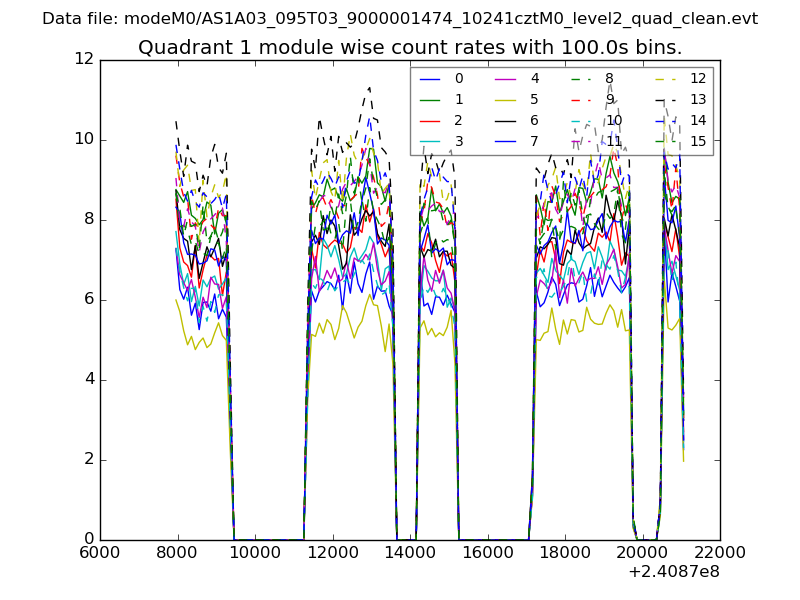
| Module-wise count rates for Quadrant A Data is divided into 100 sec bins |
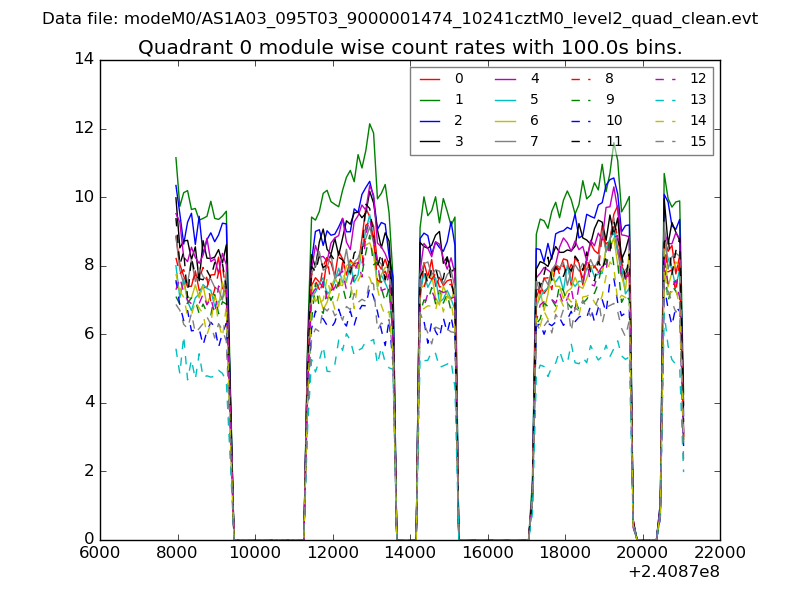 |
 |
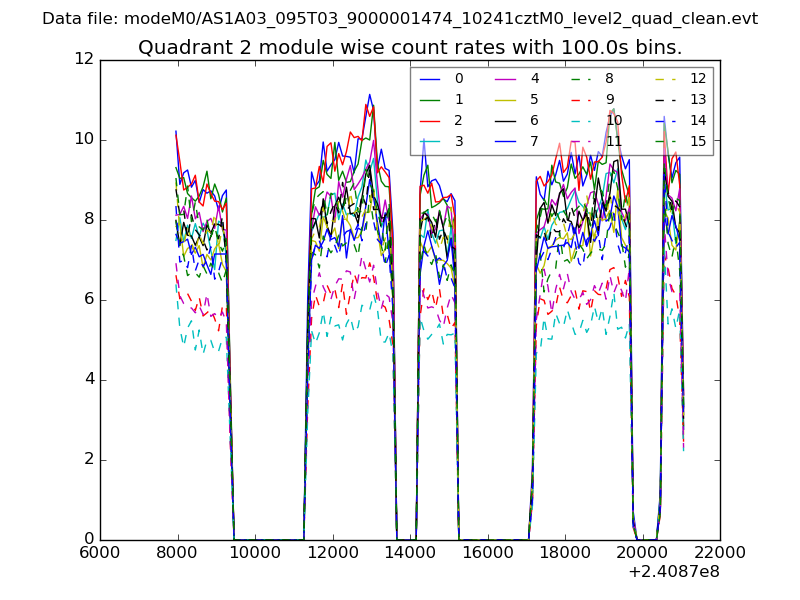
| Module-wise count rates for Quadrant B Data is divided into 100 sec bins |
 |
 |
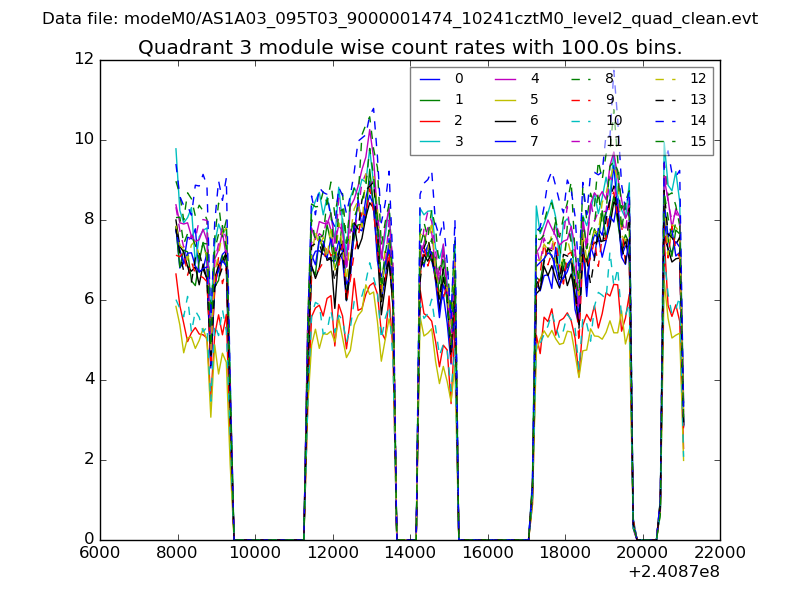
| Module-wise count rates for Quadrant C Data is divided into 100 sec bins |
 |
 |
| Module-wise count rates for Quadrant D Data is divided into 100 sec bins |
 |
 |
| Parameter | Plot |
|---|---|
| CZT HV Monitor | 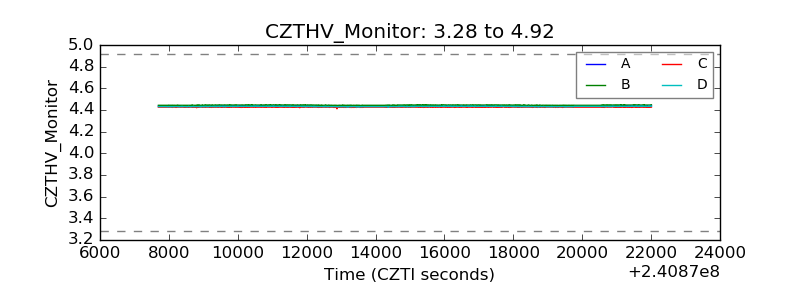 |
| D_VDD | 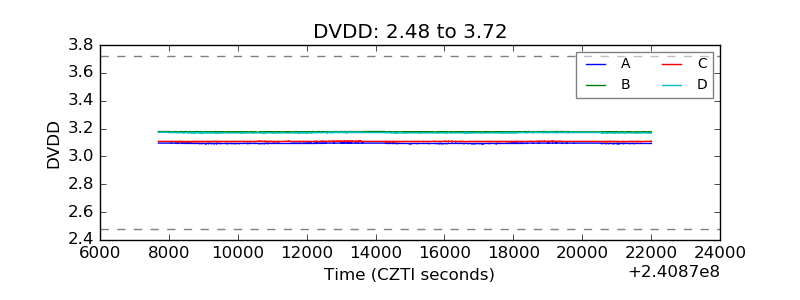 |
| Temperature 1 | 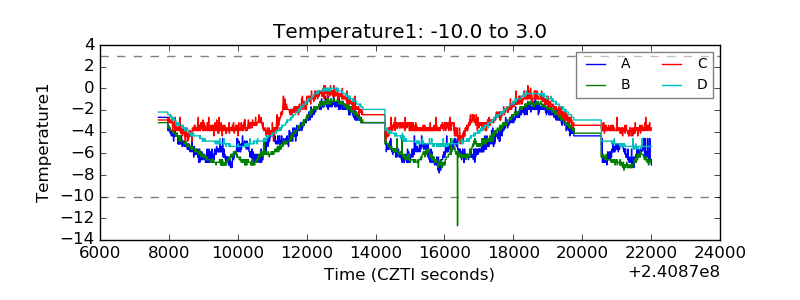 |
| Veto HV Monitor |  |
| Veto LLD | 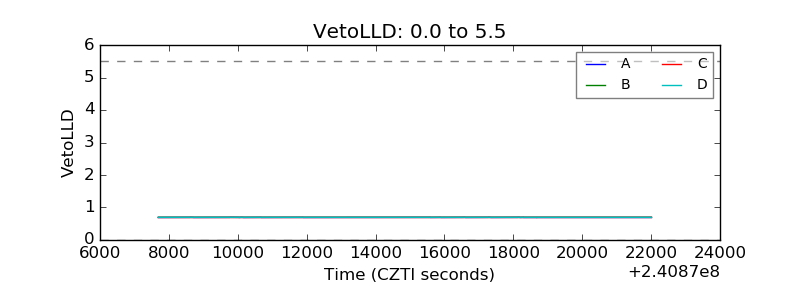 |
| Alpha Counter |  |
| _CPM_Rate | 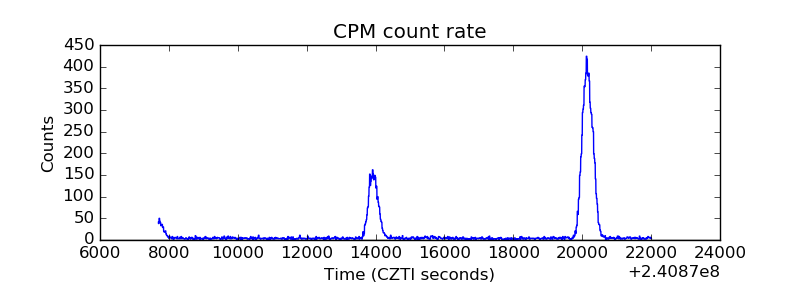 |
| CZT Counter |  |
| +2.5 Volts monitor |  |
| +5 Volts monitor |  |
| _ROLL_ROT | 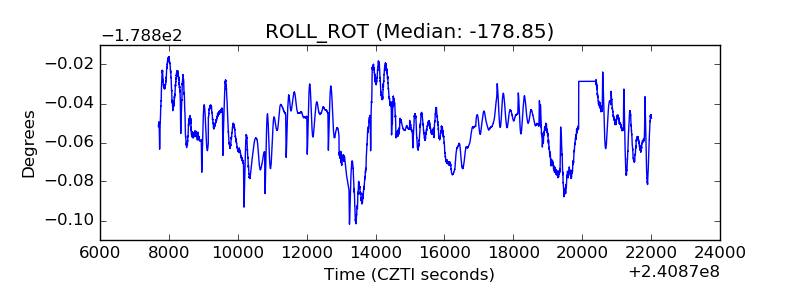 |
| _Roll_DEC | 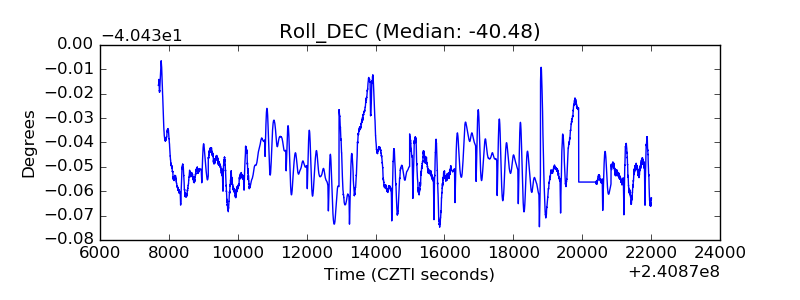 |
| _Roll_RA | 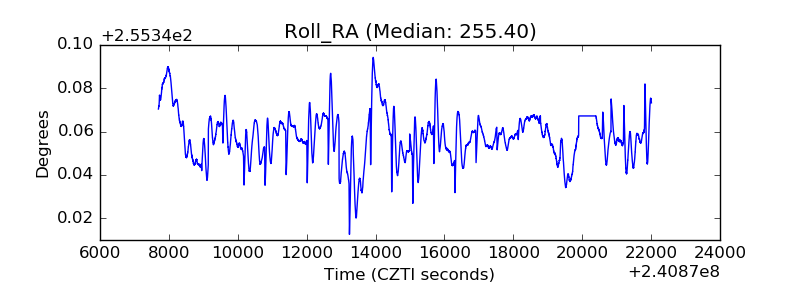 |
| Veto Counter | 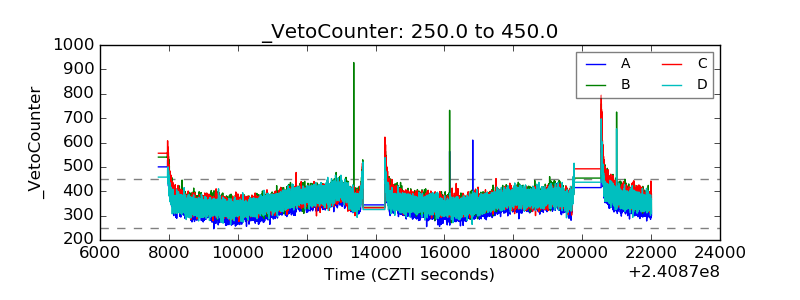 |