| Param | Original file | Final file |
|---|---|---|
| Filename | modeM0/AS1A03_052T01_9000001480cztM0_level2.fits | modeM0/AS1A03_052T01_9000001480cztM0_level2_quad_clean.evt |
| Size (bytes) | 690,785,280 | 656,326,080 |
| Size | 658.8 MB | 625.9 MB |
| Events in quadrant A | 4,210,968 | 3,920,590 |
| Events in quadrant B | 3,981,872 | 3,837,400 |
| Events in quadrant C | 4,126,607 | 3,732,226 |
| Events in quadrant D | 3,663,862 | 3,453,880 |
| Mode SS | |||
|---|---|---|---|
| Quadrant | BADHDUFLAG | Total packets | Discarded packets |
| A | 0 | 1262 | 0 |
| B | 0 | 1268 | 0 |
| C | 0 | 1267 | 0 |
| D | 0 | 1267 | 0 |
| Mode M0 | |||
|---|---|---|---|
| Quadrant | BADHDUFLAG | Total packets | Discarded packets |
| A | 0 | 150843 | 0 |
| B | 0 | 159329 | 0 |
| C | 0 | 149319 | 0 |
| D | 0 | 187886 | 0 |
| Mode M9 | |||
|---|---|---|---|
| Quadrant | BADHDUFLAG | Total packets | Discarded packets |
| A | 0 | 115 | 0 |
| B | 0 | 115 | 0 |
| C | 0 | 115 | 0 |
| D | 0 | 115 | 0 |
| Quadrant | Total seconds | Saturated seconds | Saturation percentage |
|---|---|---|---|
| A | 72169 | 663 | 0.918677% |
| B | 71339 | 1161 | 1.627441% |
| C | 72733 | 411 | 0.565080% |
| D | 74414 | 1442 | 1.937807% |
Noise dominated data is calculated using 1-second bins in cleaned event files. If a bin has >2000 counts, and if more than 50% of those come from <1% of pixels, then it is considered to be noise-dominated and hence unusable.
| Quadrant | # 1 sec bins | Bins with >0 counts | Bins with >2000 counts | High rate bins dominated by noise | Noise dominated (total time) | Noise dominated (detector-on time) | Marked lightcurve |
|---|---|---|---|---|---|---|---|
| A | 91195 | 77556 | 0 | 0 | 0.00% | 0.00% |  |
| B | 91195 | 76909 | 0 | 0 | 0.00% | 0.00% |  |
| C | 91195 | 77814 | 0 | 0 | 0.00% | 0.00% |  |
| D | 91195 | 77564 | 0 | 0 | 0.00% | 0.00% |  |
Top three noisy pixels from each quadrant. If the there are fewer than three noisy pixels in the level2.evt file, extra rows are filled as -1
| Pixel properties | Quadrant properties | ||||||
|---|---|---|---|---|---|---|---|
| Quadrant | DetID | PixID | Counts | Sigma | Mean | Median | Sigma |
| A | 0 | 29 | 4108 | 11.37 | 1093 | 1024 | 271.2 |
| A | 7 | 110 | 3457 | 8.97 | 1093 | 1024 | 271.2 |
| A | 0 | 30 | 3226 | 8.12 | 1093 | 1024 | 271.2 |
| B | 2 | 9 | 3487 | 11.87 | 1051 | 1000 | 209.6 |
| B | 5 | 128 | 2703 | 8.13 | 1051 | 1000 | 209.6 |
| B | 3 | 17 | 2686 | 8.04 | 1051 | 1000 | 209.6 |
| C | 1 | 80 | 3033 | 7.05 | 1090 | 1014 | 286.3 |
| C | 1 | 81 | 2988 | 6.9 | 1090 | 1014 | 286.3 |
| C | 12 | 241 | 2868 | 6.48 | 1090 | 1014 | 286.3 |
| D | 3 | 14 | 2671 | 6.15 | 1045 | 951 | 279.9 |
| D | 6 | 231 | 2617 | 5.95 | 1045 | 951 | 279.9 |
| D | 7 | 5 | 2613 | 5.94 | 1045 | 951 | 279.9 |
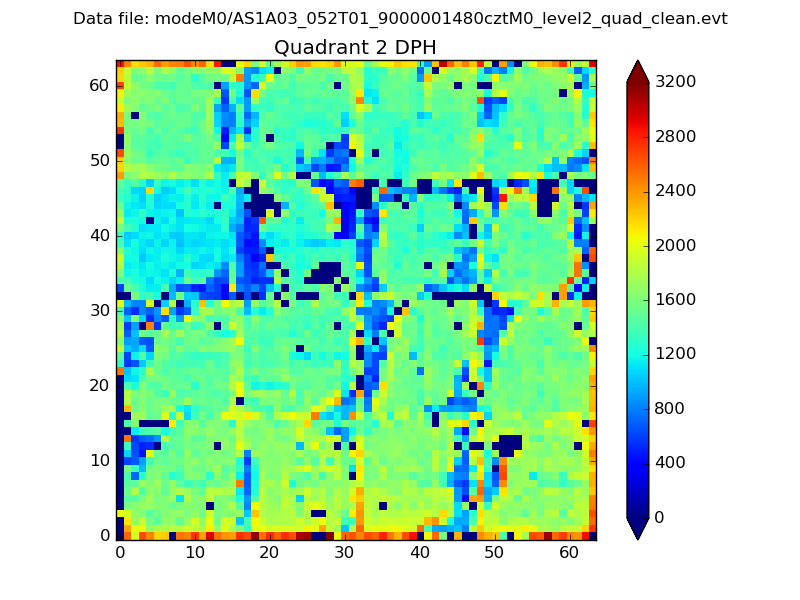
Histogram calculated using DETX and DETY for each event in the final _common_clean file
| Quadrant A |  |
 |
Quadrant B |
|---|---|---|---|
| Quadrant D |  |
 |
Quadrant C |
| Plot type | Count rate plots | Images |
|---|---|---|
| Comparison with Poisson distribution Blue bars denote a histogram of data divided into 1 sec bins. Red curve is a Poisson curve with rate = median count rate of data. |
 |
 |
| Quadrant-wise count rates Data is divided into 100 sec bins |
 |
|
| Module-wise count rates for Quadrant A Data is divided into 100 sec bins |
 |
 |
| Module-wise count rates for Quadrant B Data is divided into 100 sec bins |
 |
 |
| Module-wise count rates for Quadrant C Data is divided into 100 sec bins |
 |
 |
| Module-wise count rates for Quadrant D Data is divided into 100 sec bins |
 |
 |
| Parameter | Plot |
|---|---|
| CZT HV Monitor |  |
| D_VDD |  |
| Temperature 1 |  |
| Veto HV Monitor |  |
| Veto LLD |  |
| Alpha Counter |  |
| _CPM_Rate |  |
| CZT Counter |  |
| +2.5 Volts monitor |  |
| +5 Volts monitor |  |
| _ROLL_ROT |  |
| _Roll_DEC |  |
| _Roll_RA | 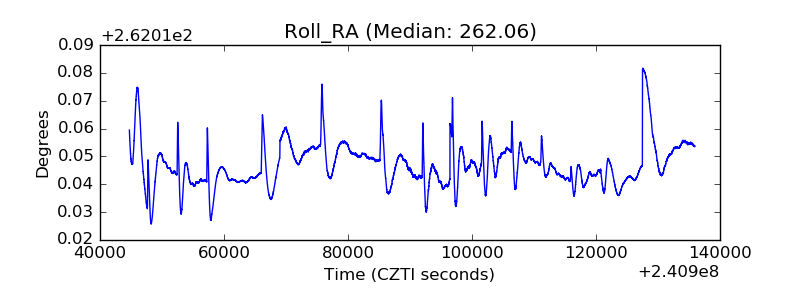 |
| Veto Counter |  |