| Param | Original file | Final file |
|---|---|---|
| Filename | modeM0/AS1A03_052T01_9000001480_10252cztM0_level2.evt | modeM0/AS1A03_052T01_9000001480_10252cztM0_level2_quad_clean.evt |
| Size (bytes) | 565,816,320 | 104,705,280 |
| Size | 539.6 MB | 99.9 MB |
| Events in quadrant A | 3,568,384 | 675,206 |
| Events in quadrant B | 4,009,450 | 679,859 |
| Events in quadrant C | 3,459,886 | 663,611 |
| Events in quadrant D | 5,580,721 | 621,601 |
| Mode SS | |||
|---|---|---|---|
| Quadrant | BADHDUFLAG | Total packets | Discarded packets |
| A | 0 | 154 | 0 |
| B | 0 | 154 | 0 |
| C | 0 | 154 | 0 |
| D | 0 | 154 | 0 |
| Mode M0 | |||
|---|---|---|---|
| Quadrant | BADHDUFLAG | Total packets | Discarded packets |
| A | 0 | 15943 | 37 |
| B | 0 | 17069 | 64 |
| C | 0 | 15839 | 49 |
| D | 0 | 21872 | 99 |
| Mode M9 | |||
|---|---|---|---|
| Quadrant | BADHDUFLAG | Total packets | Discarded packets |
| A | 0 | 6 | 0 |
| B | 0 | 6 | 0 |
| C | 0 | 6 | 0 |
| D | 0 | 6 | 0 |
| Quadrant | Total seconds | Saturated seconds | Saturation percentage |
|---|---|---|---|
| A | 7642 | 62 | 0.811306% |
| B | 7633 | 132 | 1.729333% |
| C | 7635 | 24 | 0.314342% |
| D | 7634 | 329 | 4.309667% |
Noise dominated data is calculated using 1-second bins in cleaned event files. If a bin has >2000 counts, and if more than 50% of those come from <1% of pixels, then it is considered to be noise-dominated and hence unusable.
| Quadrant | # 1 sec bins | Bins with >0 counts | Bins with >2000 counts | High rate bins dominated by noise | Noise dominated (total time) | Noise dominated (detector-on time) | Marked lightcurve |
|---|---|---|---|---|---|---|---|
| A | 8153 | 7660 | 0 | 0 | 0.00% | 0.00% | 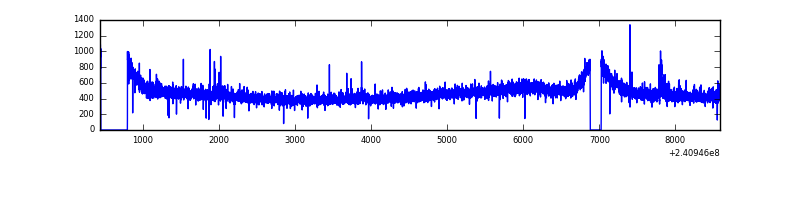 |
| B | 8153 | 7658 | 38 | 38 | 0.47% | 0.50% | 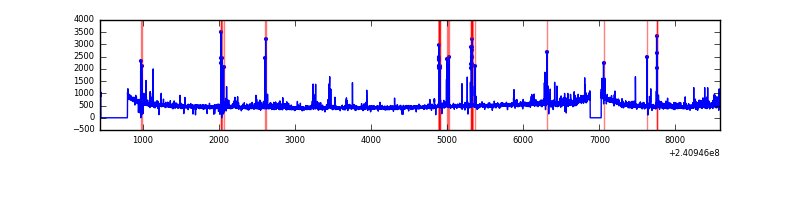 |
| C | 8153 | 7660 | 0 | 0 | 0.00% | 0.00% | 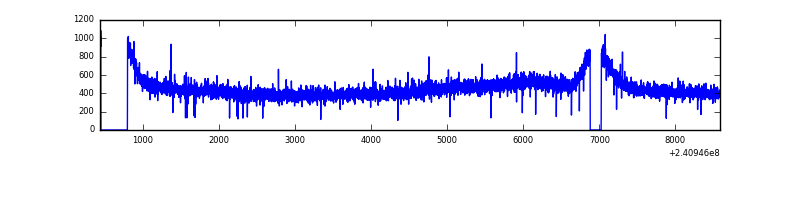 |
| D | 8153 | 7659 | 174 | 174 | 2.13% | 2.27% | 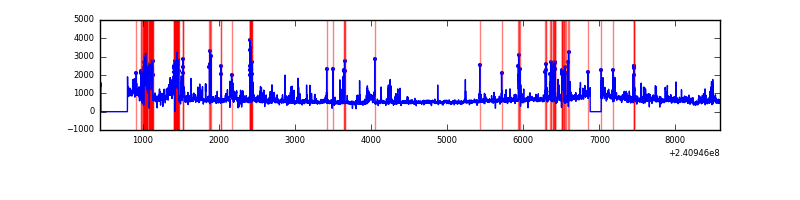 |
Top three noisy pixels from each quadrant. If the there are fewer than three noisy pixels in the level2.evt file, extra rows are filled as -1
| Pixel properties | Quadrant properties | ||||||
|---|---|---|---|---|---|---|---|
| Quadrant | DetID | PixID | Counts | Sigma | Mean | Median | Sigma |
| A | 3 | 1 | 25225 | 129.72 | 917 | 899 | 187.5 |
| A | 0 | 226 | 8538 | 40.73 | 917 | 899 | 187.5 |
| A | 12 | 194 | 7830 | 36.96 | 917 | 899 | 187.5 |
| B | 11 | 51 | 108744 | 609.63 | 915 | 893 | 176.9 |
| B | 4 | 239 | 102181 | 572.53 | 915 | 893 | 176.9 |
| B | 10 | 247 | 79197 | 442.61 | 915 | 893 | 176.9 |
| C | 0 | 207 | 11069 | 49.43 | 881 | 886 | 206.0 |
| C | 13 | 61 | 6629 | 27.88 | 881 | 886 | 206.0 |
| C | 14 | 67 | 4084 | 15.52 | 881 | 886 | 206.0 |
| D | 8 | 195 | 868649 | 4081.11 | 871 | 846 | 212.6 |
| D | 13 | 137 | 748091 | 3514.15 | 871 | 846 | 212.6 |
| D | 1 | 52 | 217878 | 1020.66 | 871 | 846 | 212.6 |
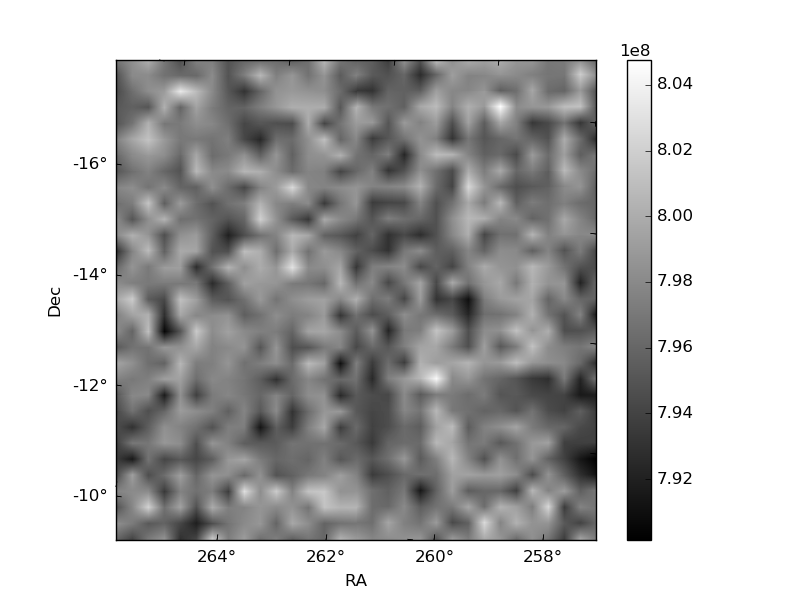
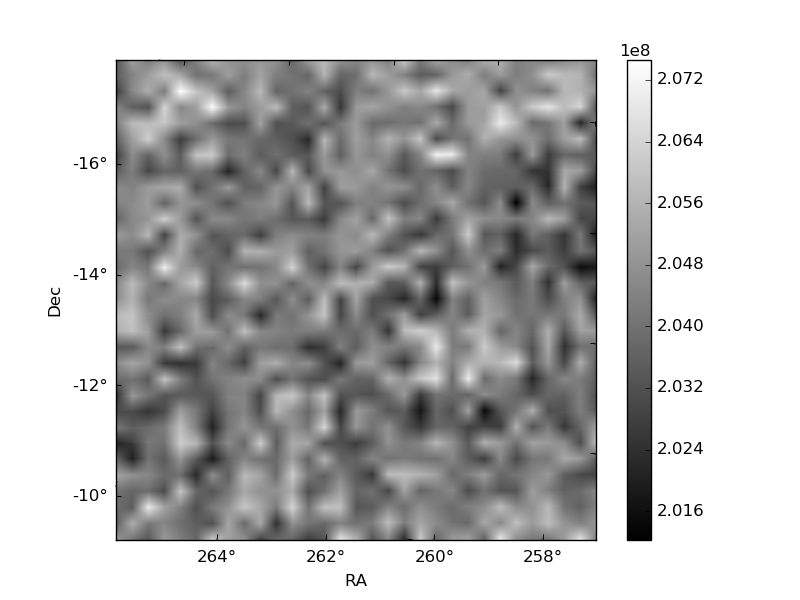
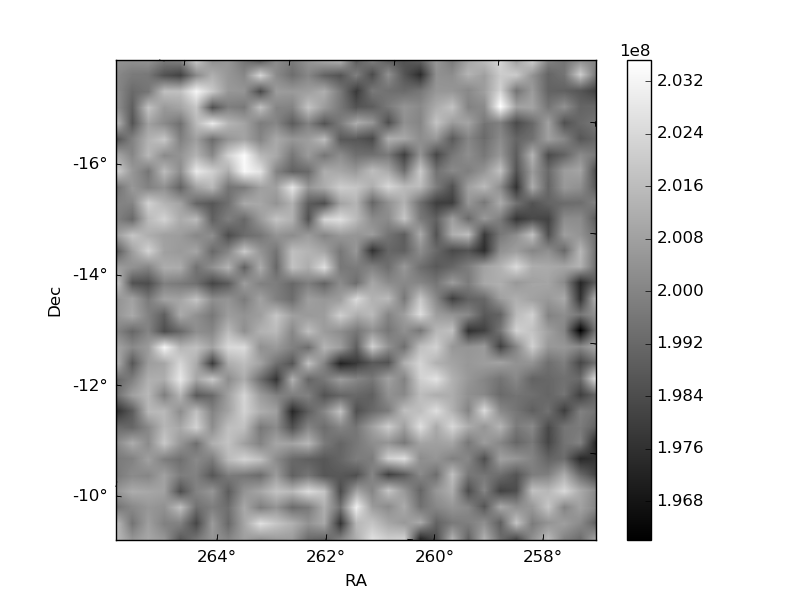
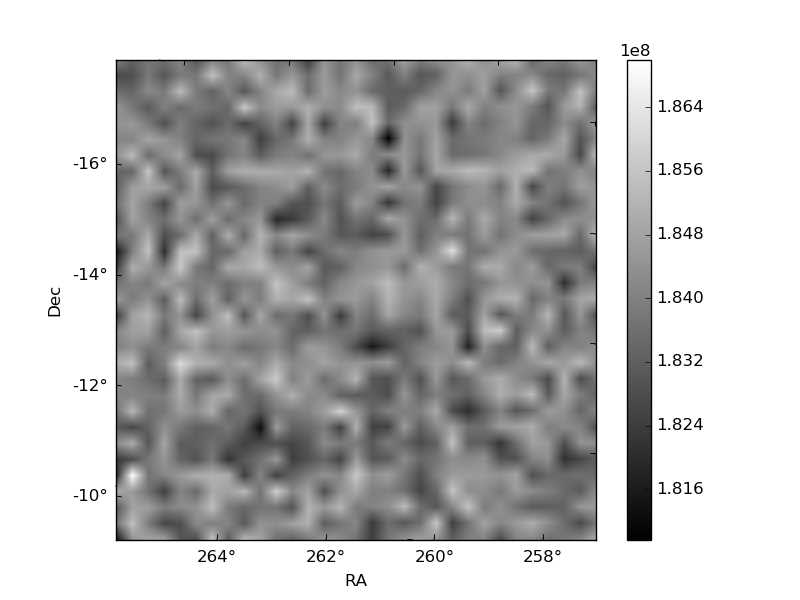
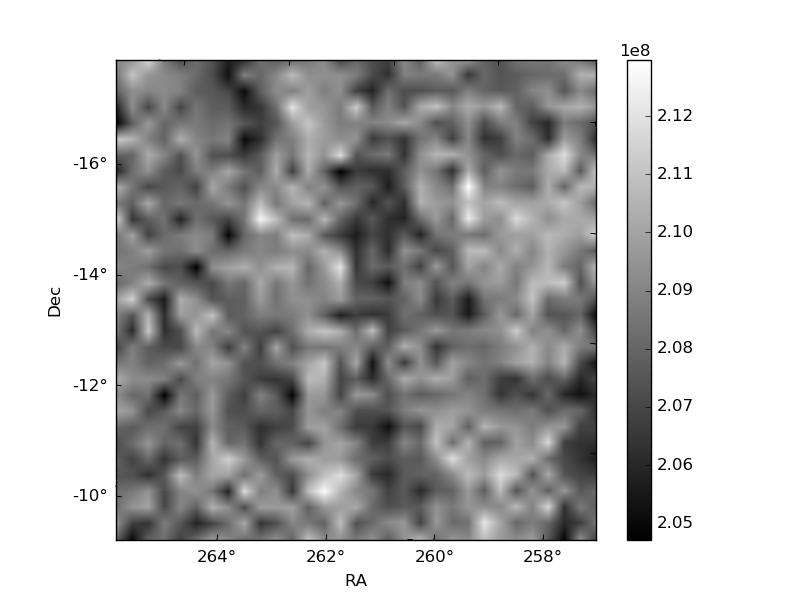
Histogram calculated using DETX and DETY for each event in the final _common_clean file
| Quadrant A | 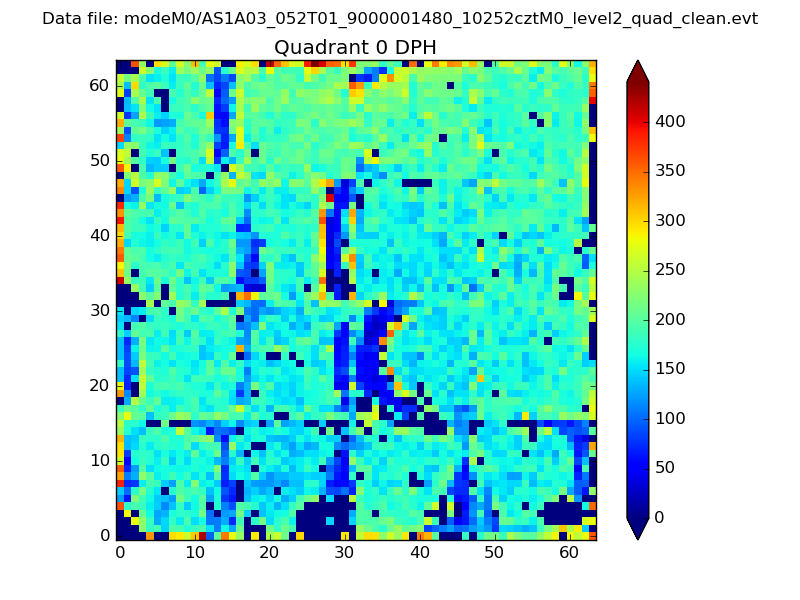 |
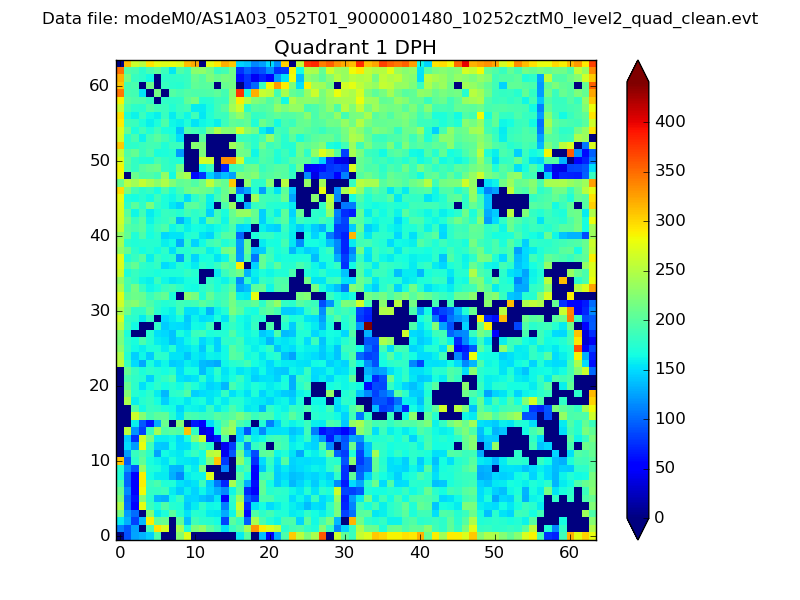 |
Quadrant B |
|---|---|---|---|
| Quadrant D | 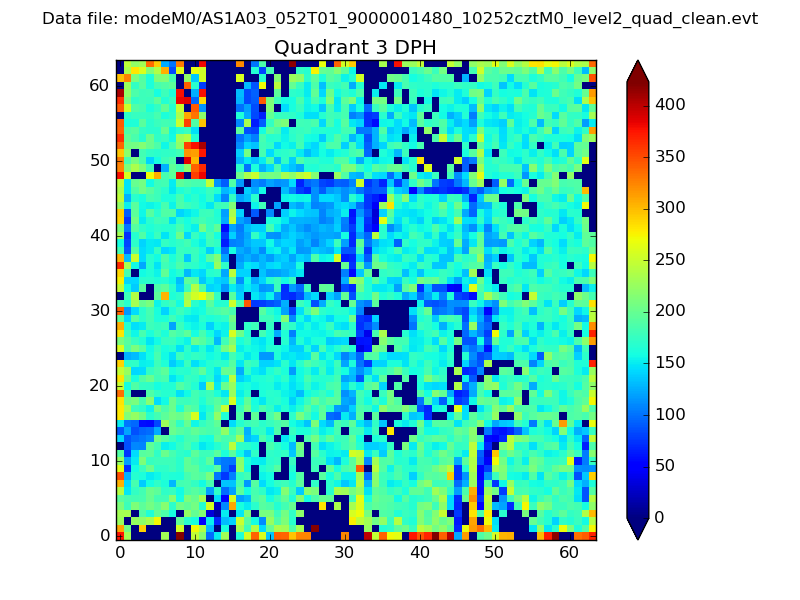 |
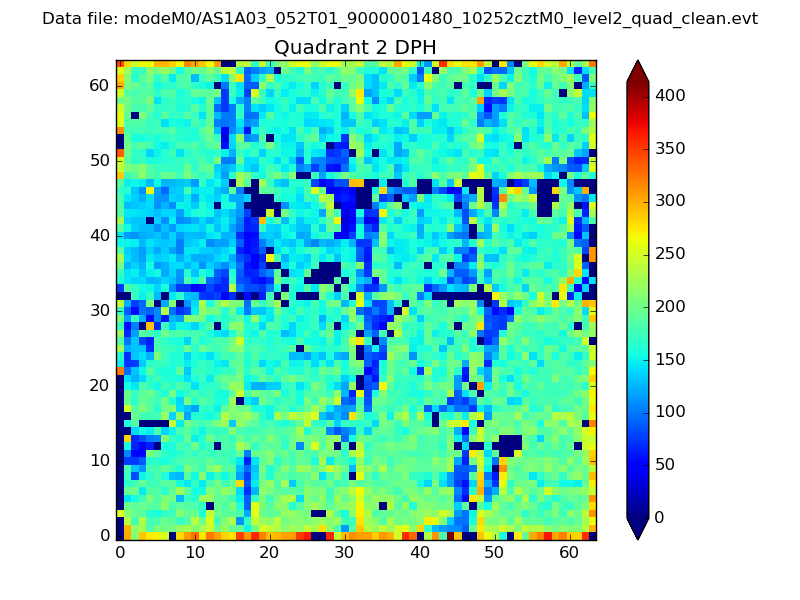 |
Quadrant C |
| Plot type | Count rate plots | Images |
|---|---|---|
| Comparison with Poisson distribution Blue bars denote a histogram of data divided into 1 sec bins. Red curve is a Poisson curve with rate = median count rate of data. |
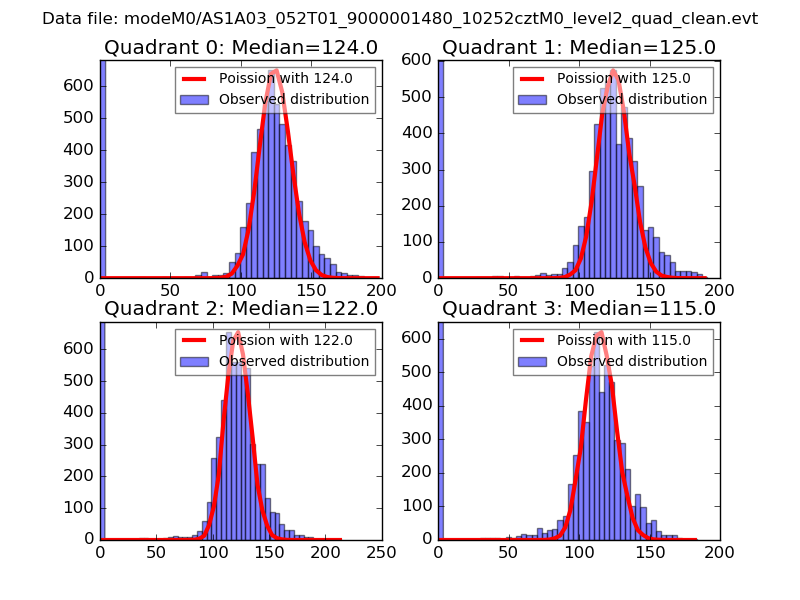 |
 |
| Quadrant-wise count rates Data is divided into 100 sec bins |
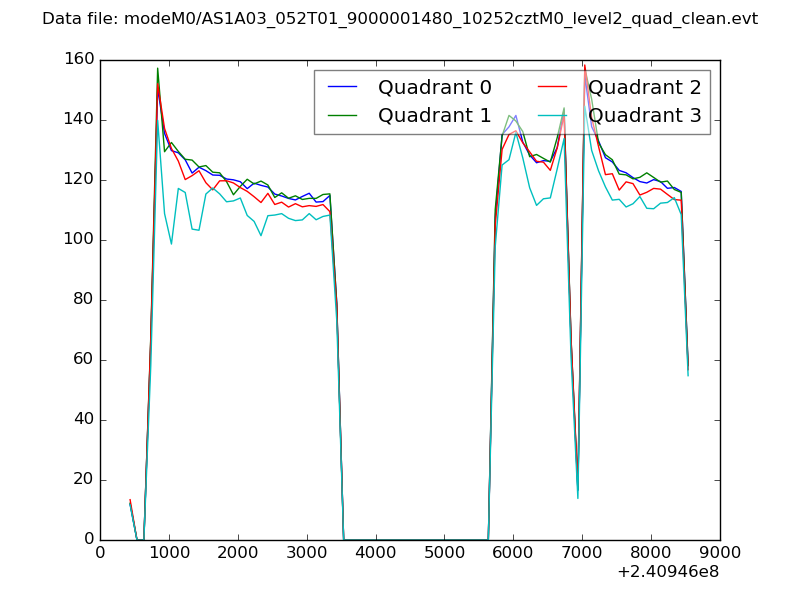 |
|
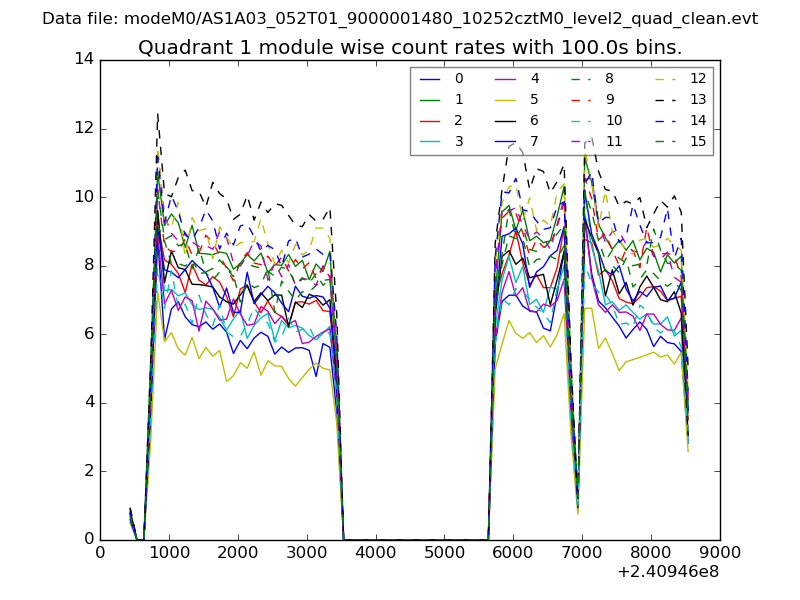
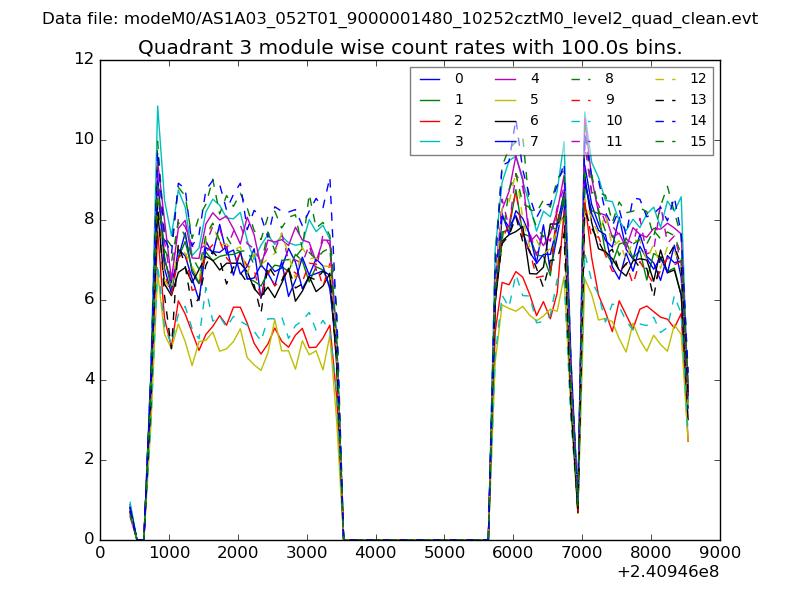
| Module-wise count rates for Quadrant A Data is divided into 100 sec bins |
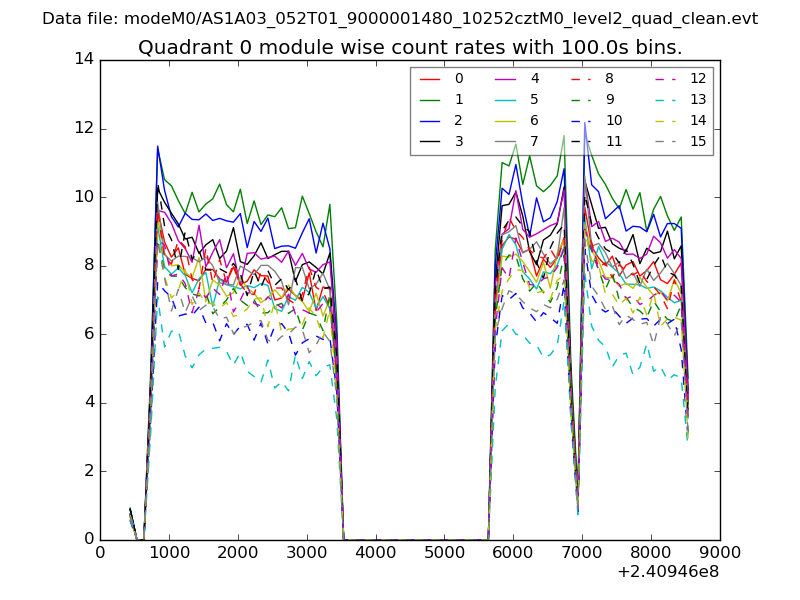 |
 |
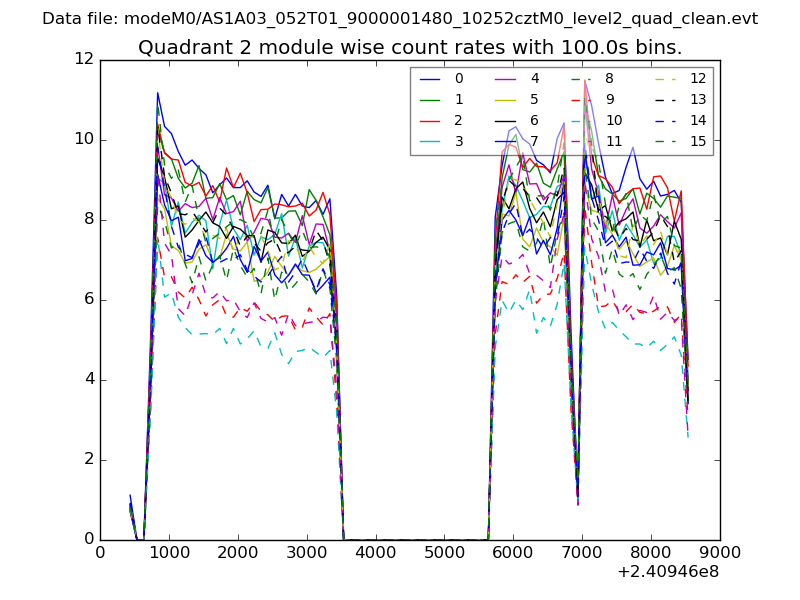
| Module-wise count rates for Quadrant B Data is divided into 100 sec bins |
 |
 |
| Module-wise count rates for Quadrant C Data is divided into 100 sec bins |
 |
 |
| Module-wise count rates for Quadrant D Data is divided into 100 sec bins |
 |
 |
| Parameter | Plot |
|---|---|
| CZT HV Monitor | 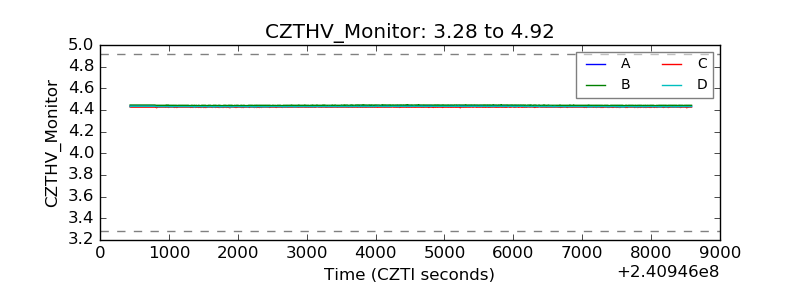 |
| D_VDD | 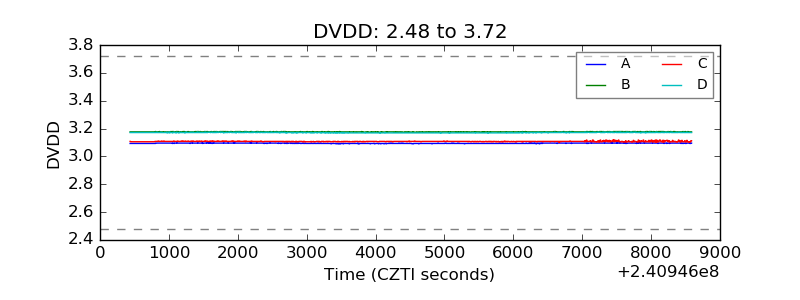 |
| Temperature 1 | 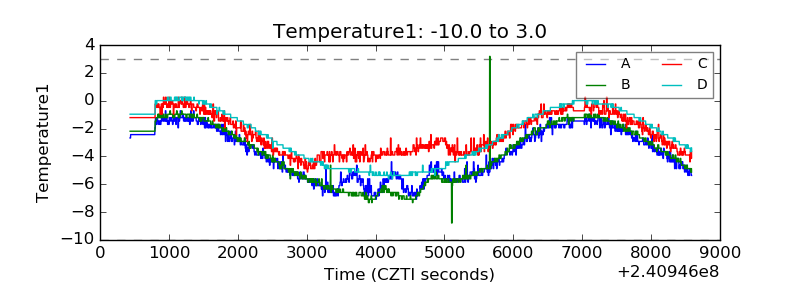 |
| Veto HV Monitor | 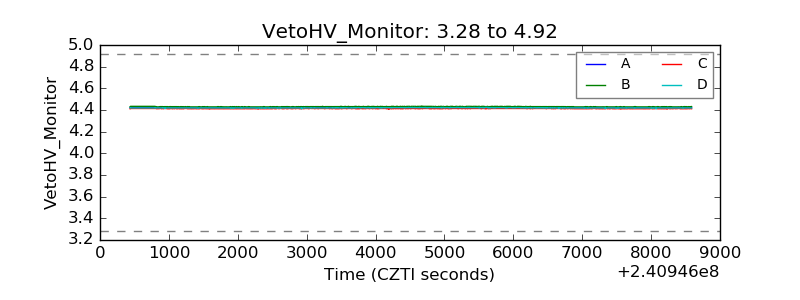 |
| Veto LLD | 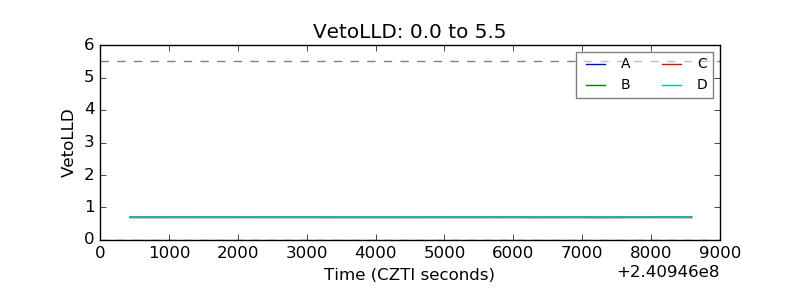 |
| Alpha Counter | 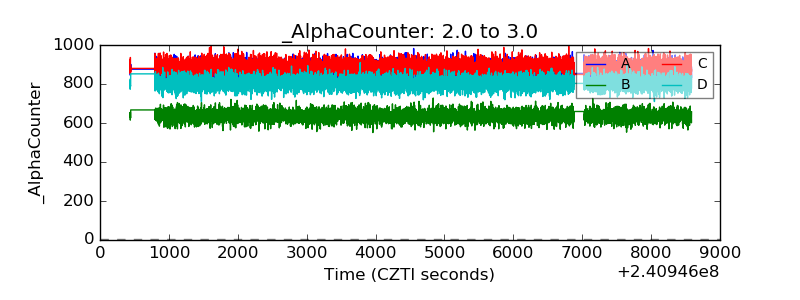 |
| _CPM_Rate | 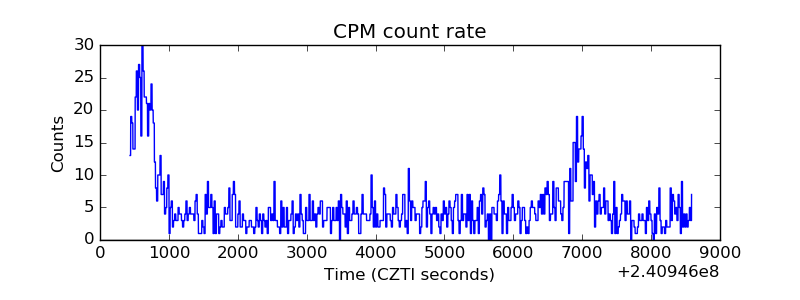 |
| CZT Counter | 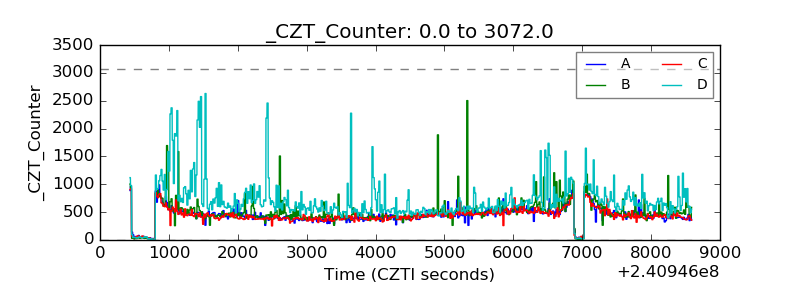 |
| +2.5 Volts monitor | 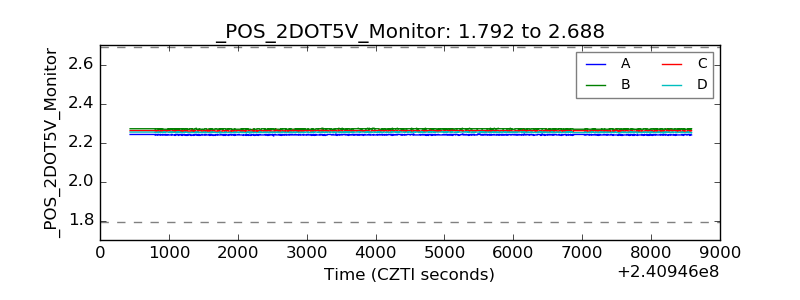 |
| +5 Volts monitor |  |
| _ROLL_ROT | 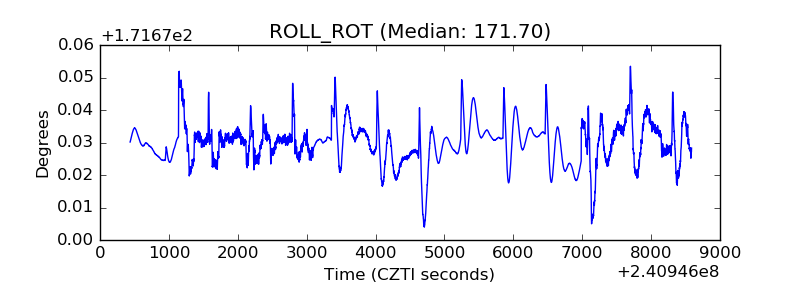 |
| _Roll_DEC | 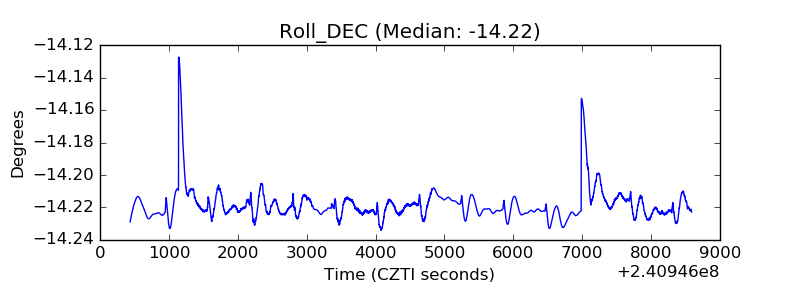 |
| _Roll_RA | 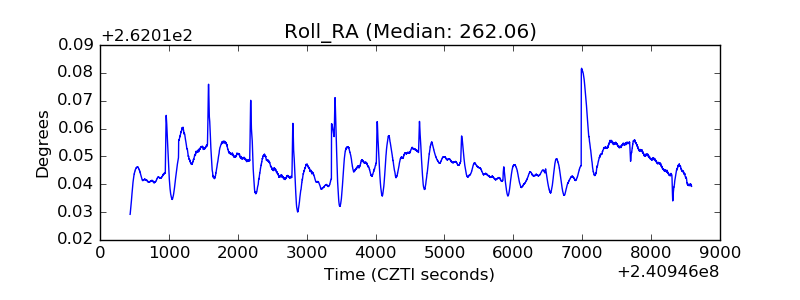 |
| Veto Counter | 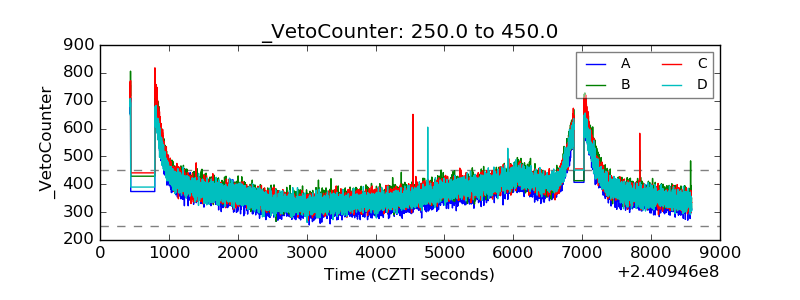 |