| Param | Original file | Final file |
|---|---|---|
| Filename | modeM0/AS1A03_052T01_9000001480_10253cztM0_level2.evt | modeM0/AS1A03_052T01_9000001480_10253cztM0_level2_quad_clean.evt |
| Size (bytes) | 481,164,480 | 91,995,840 |
| Size | 458.9 MB | 87.7 MB |
| Events in quadrant A | 3,150,397 | 608,974 |
| Events in quadrant B | 3,411,370 | 580,435 |
| Events in quadrant C | 3,057,357 | 599,943 |
| Events in quadrant D | 4,498,756 | 531,535 |
| Mode SS | |||
|---|---|---|---|
| Quadrant | BADHDUFLAG | Total packets | Discarded packets |
| A | 0 | 290 | 142 |
| B | 0 | 290 | 147 |
| C | 0 | 290 | 151 |
| D | 0 | 279 | 130 |
| Mode M0 | |||
|---|---|---|---|
| Quadrant | BADHDUFLAG | Total packets | Discarded packets |
| A | 0 | 28004 | 13879 |
| B | 0 | 31730 | 17396 |
| C | 0 | 28848 | 14847 |
| D | 0 | 41129 | 23246 |
| Mode M9 | |||
|---|---|---|---|
| Quadrant | BADHDUFLAG | Total packets | Discarded packets |
| A | 0 | 7 | 2 |
| B | 0 | 8 | 3 |
| C | 0 | 8 | 3 |
| D | 0 | 7 | 2 |
| Quadrant | Total seconds | Saturated seconds | Saturation percentage |
|---|---|---|---|
| A | 6806 | 51 | 0.749339% |
| B | 6523 | 73 | 1.119117% |
| C | 6795 | 19 | 0.279617% |
| D | 6538 | 74 | 1.131845% |
Noise dominated data is calculated using 1-second bins in cleaned event files. If a bin has >2000 counts, and if more than 50% of those come from <1% of pixels, then it is considered to be noise-dominated and hence unusable.
| Quadrant | # 1 sec bins | Bins with >0 counts | Bins with >2000 counts | High rate bins dominated by noise | Noise dominated (total time) | Noise dominated (detector-on time) | Marked lightcurve |
|---|---|---|---|---|---|---|---|
| A | 8371 | 7710 | 0 | 0 | 0.00% | 0.00% | 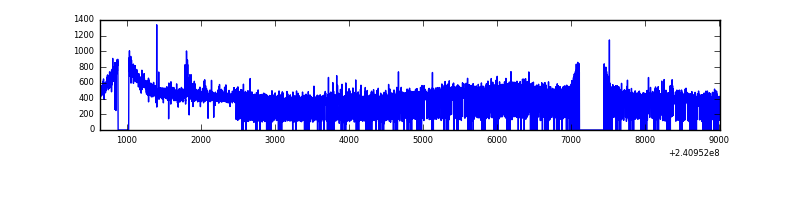 |
| B | 8371 | 7493 | 5 | 5 | 0.06% | 0.07% | 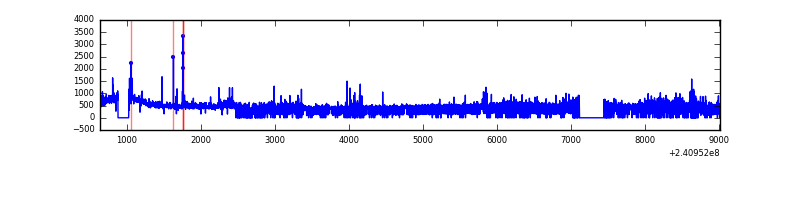 |
| C | 8371 | 7683 | 0 | 0 | 0.00% | 0.00% | 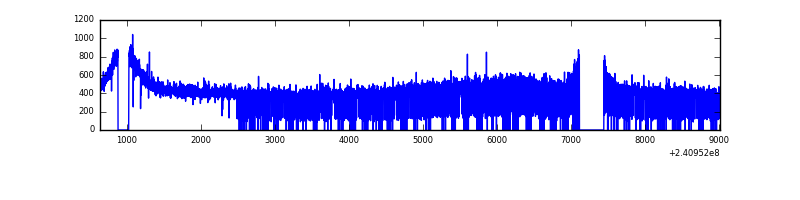 |
| D | 8371 | 7296 | 8 | 8 | 0.10% | 0.11% | 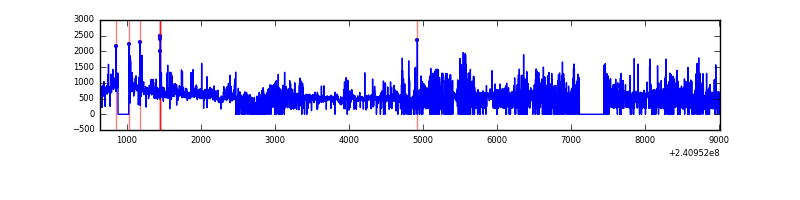 |
Top three noisy pixels from each quadrant. If the there are fewer than three noisy pixels in the level2.evt file, extra rows are filled as -1
| Pixel properties | Quadrant properties | ||||||
|---|---|---|---|---|---|---|---|
| Quadrant | DetID | PixID | Counts | Sigma | Mean | Median | Sigma |
| A | 3 | 1 | 27674 | 161.64 | 808 | 790 | 166.3 |
| A | 15 | 174 | 8815 | 48.25 | 808 | 790 | 166.3 |
| A | 0 | 226 | 7573 | 40.78 | 808 | 790 | 166.3 |
| B | 11 | 51 | 156736 | 1032.51 | 778 | 761 | 151.1 |
| B | 4 | 239 | 82610 | 541.82 | 778 | 761 | 151.1 |
| B | 0 | 214 | 56360 | 368.05 | 778 | 761 | 151.1 |
| C | 8 | 128 | 9676 | 48.84 | 777 | 780 | 182.2 |
| C | 13 | 61 | 5749 | 27.28 | 777 | 780 | 182.2 |
| C | 8 | 112 | 5741 | 27.23 | 777 | 780 | 182.2 |
| D | 8 | 195 | 775131 | 4290.2 | 739 | 717 | 180.5 |
| D | 1 | 52 | 431461 | 2386.29 | 739 | 717 | 180.5 |
| D | 2 | 16 | 149008 | 821.52 | 739 | 717 | 180.5 |
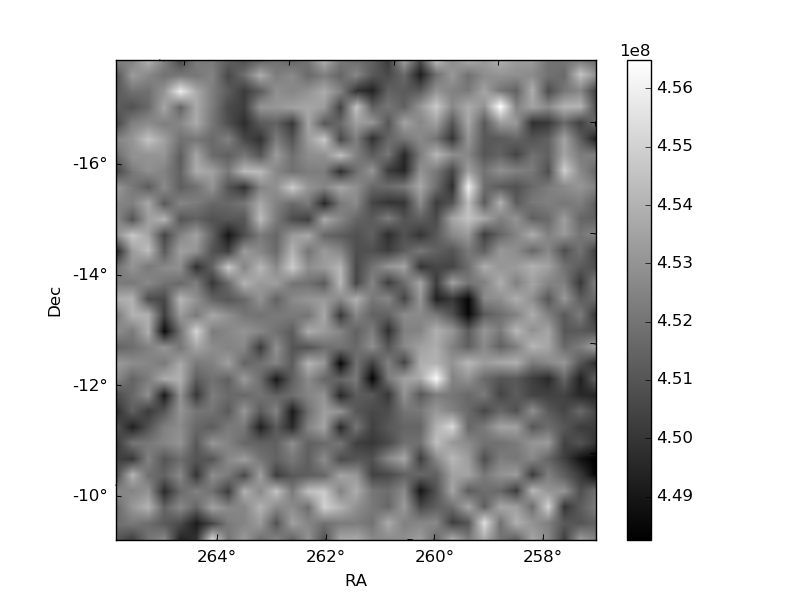
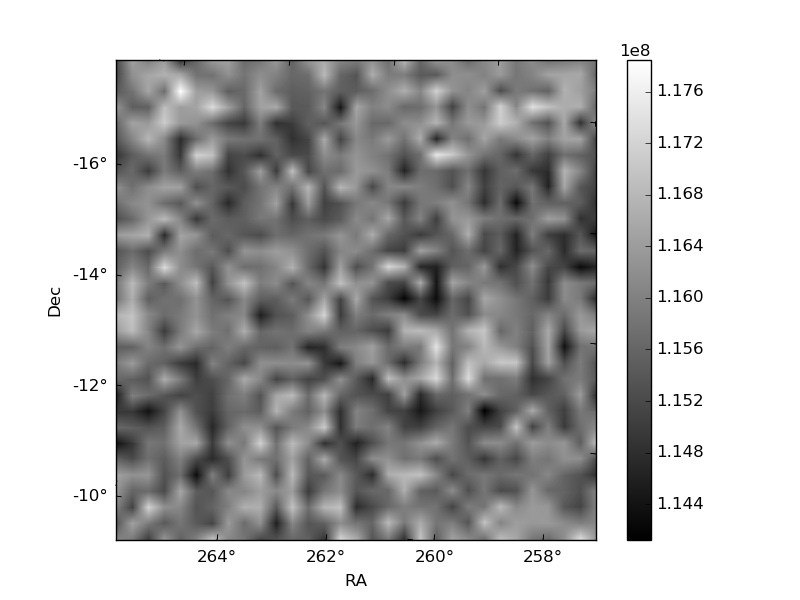
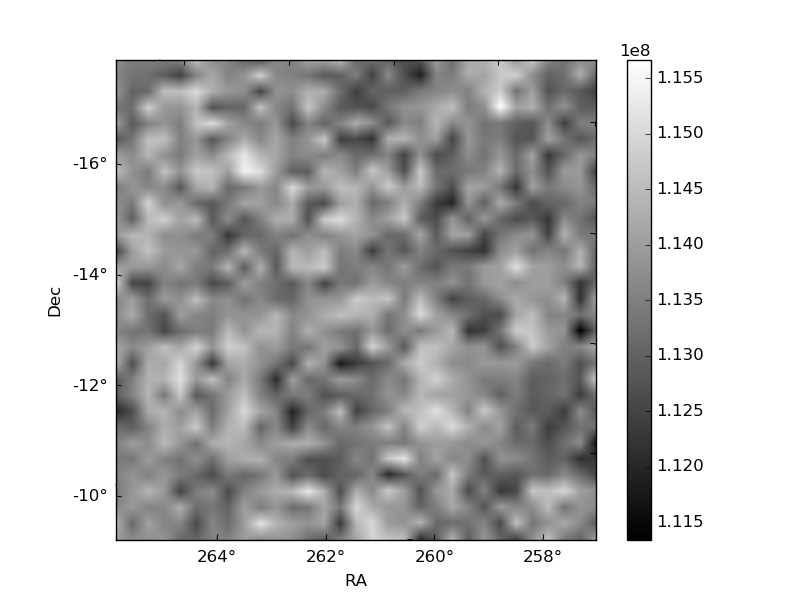
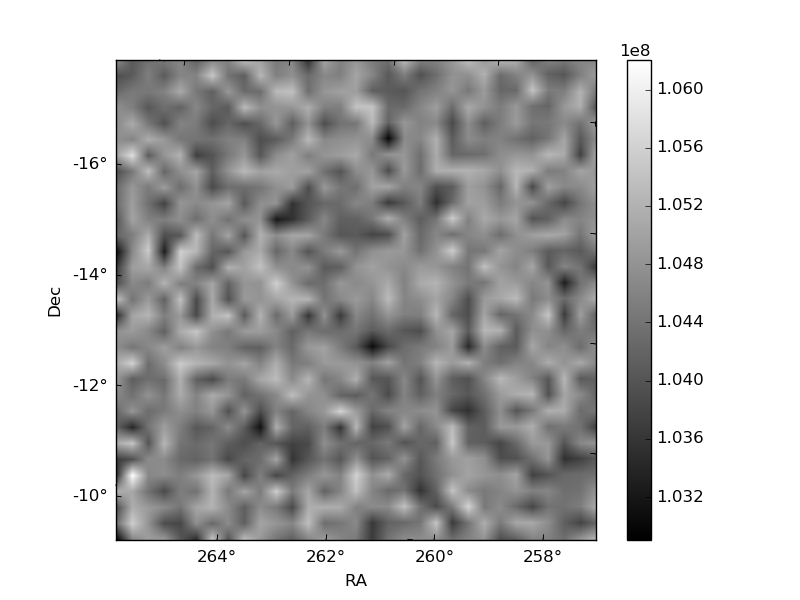
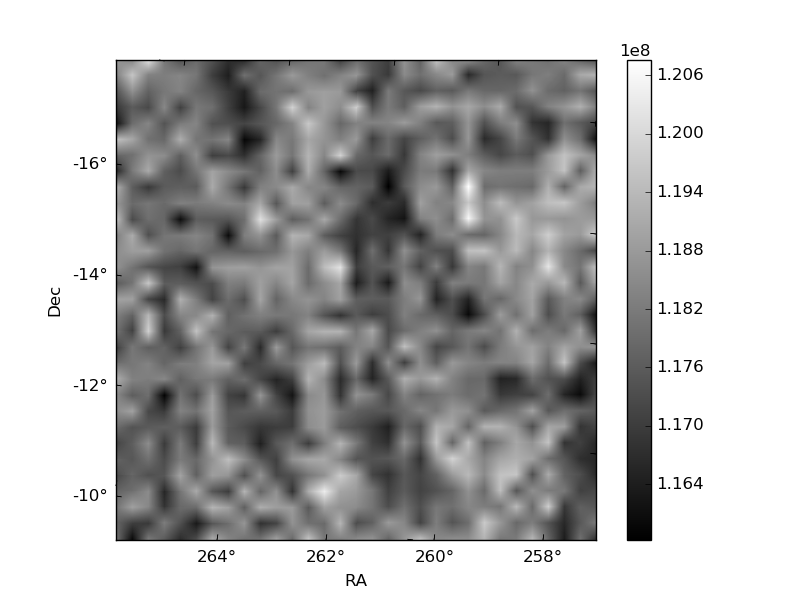
Histogram calculated using DETX and DETY for each event in the final _common_clean file
| Quadrant A | 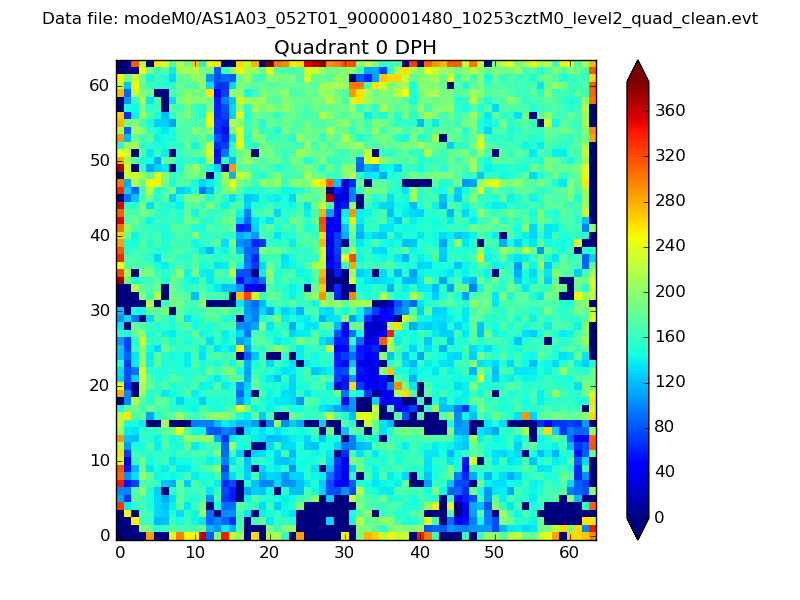 |
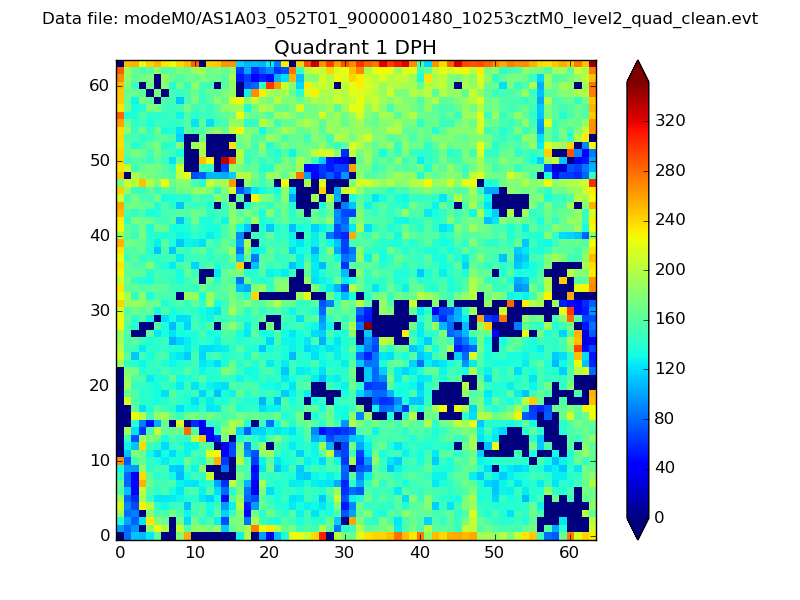 |
Quadrant B |
|---|---|---|---|
| Quadrant D | 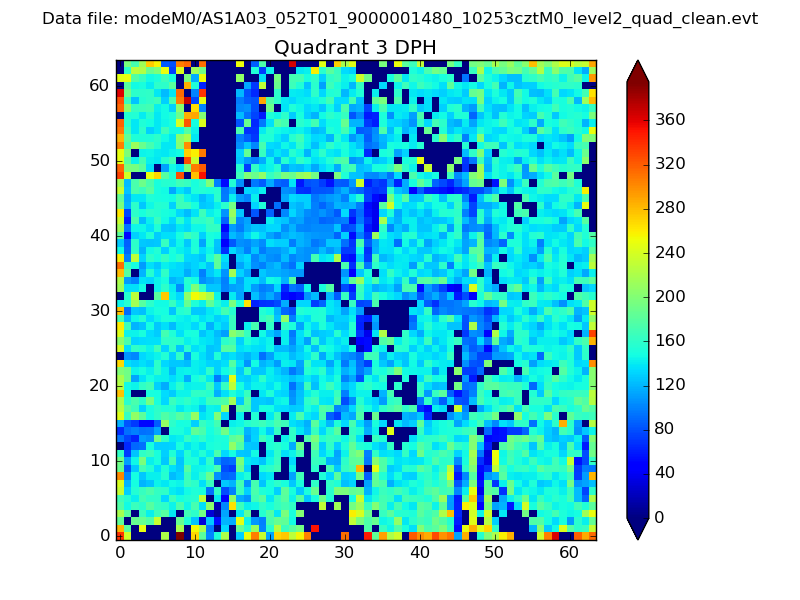 |
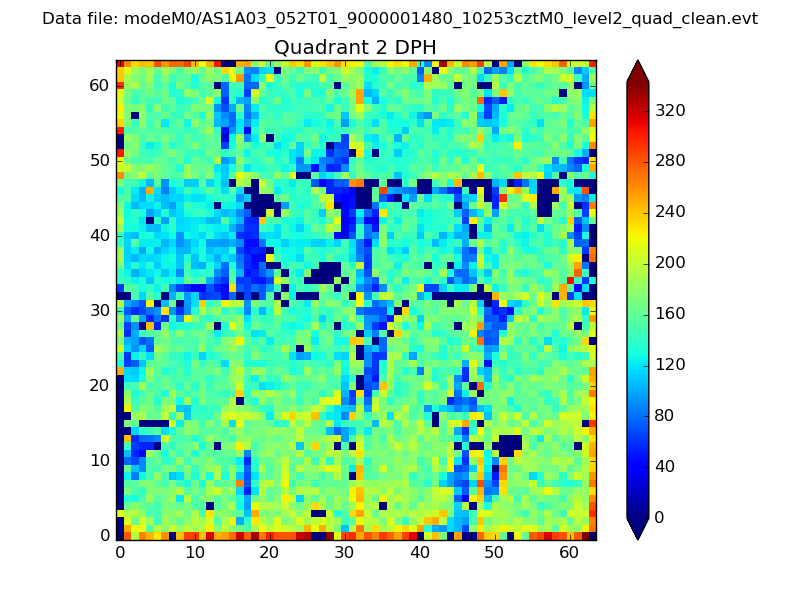 |
Quadrant C |
| Plot type | Count rate plots | Images |
|---|---|---|
| Comparison with Poisson distribution Blue bars denote a histogram of data divided into 1 sec bins. Red curve is a Poisson curve with rate = median count rate of data. |
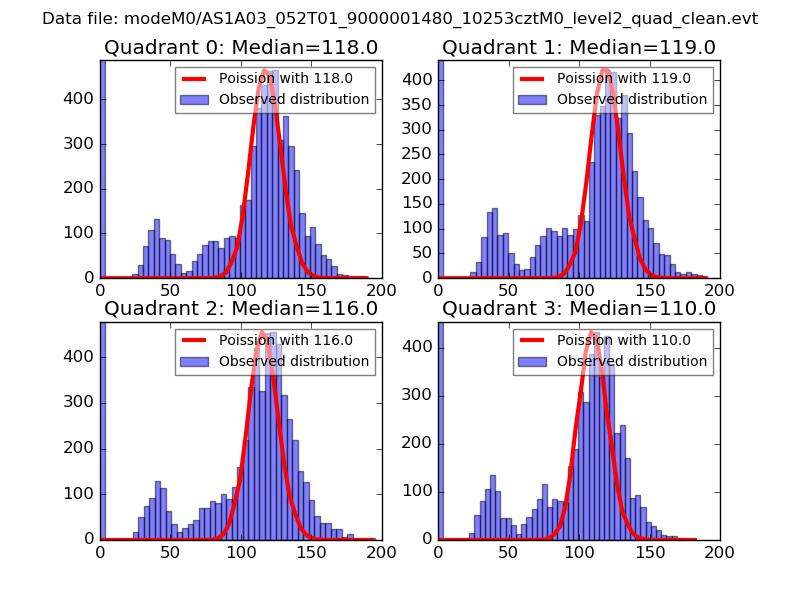 |
 |
| Quadrant-wise count rates Data is divided into 100 sec bins |
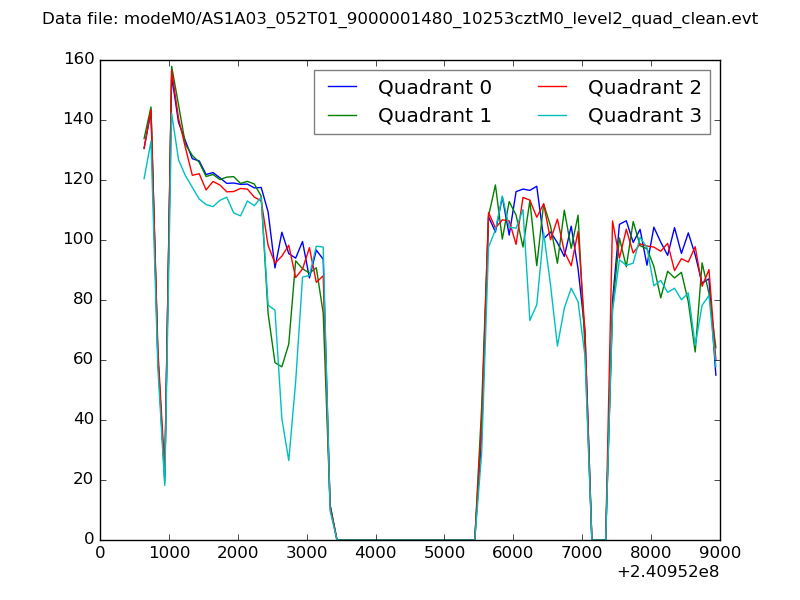 |
|
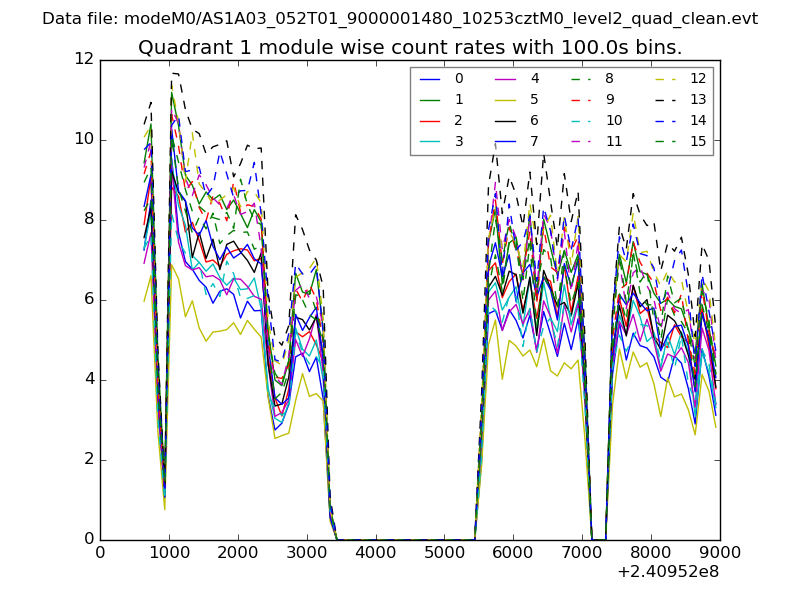
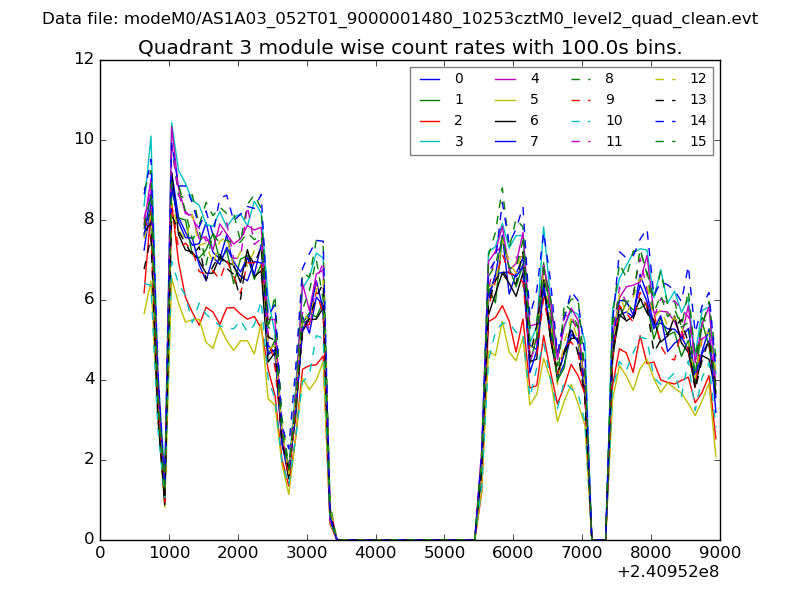
| Module-wise count rates for Quadrant A Data is divided into 100 sec bins |
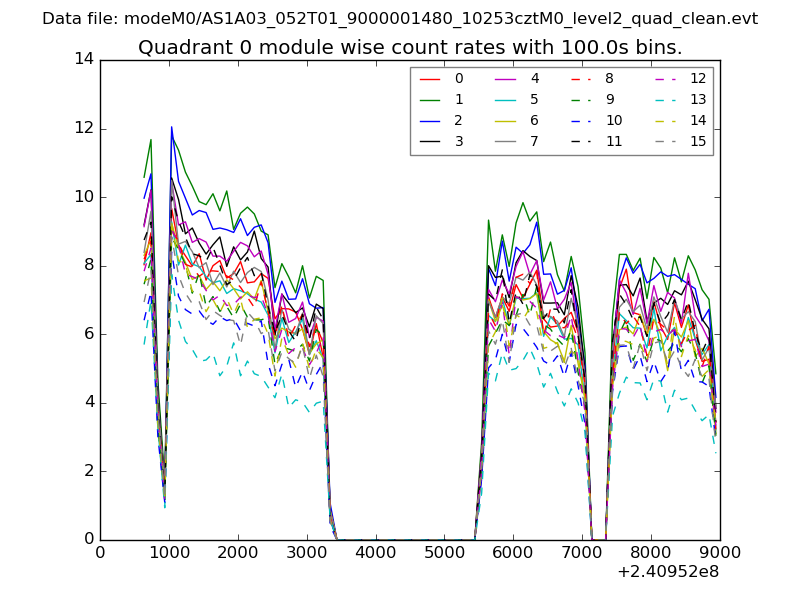 |
 |
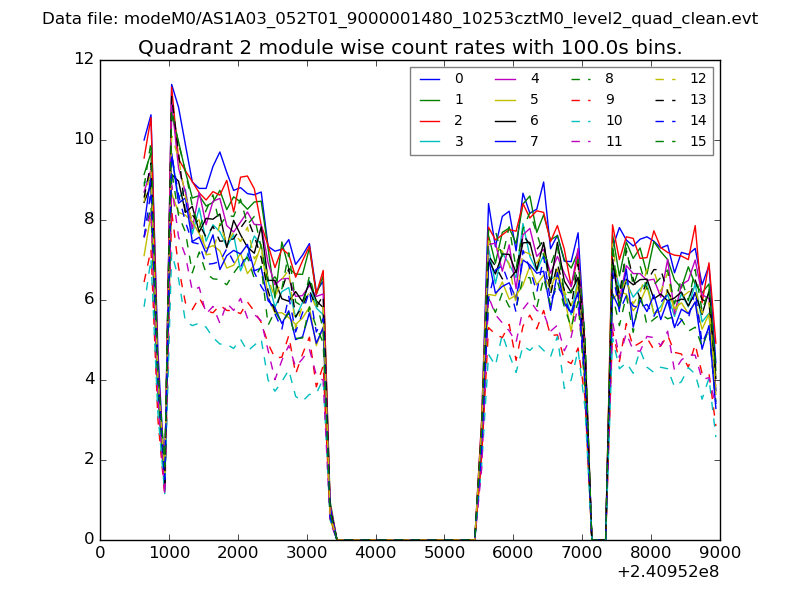
| Module-wise count rates for Quadrant B Data is divided into 100 sec bins |
 |
 |
| Module-wise count rates for Quadrant C Data is divided into 100 sec bins |
 |
 |
| Module-wise count rates for Quadrant D Data is divided into 100 sec bins |
 |
 |
| Parameter | Plot |
|---|---|
| CZT HV Monitor | 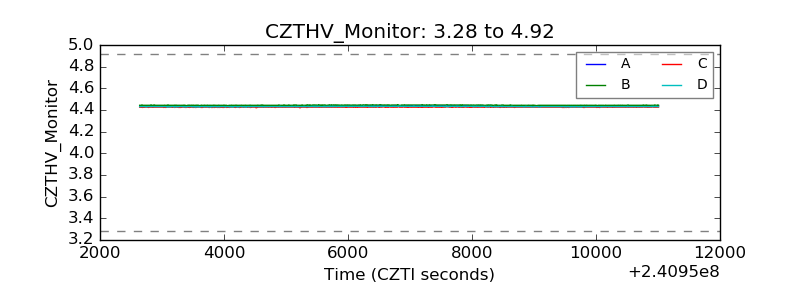 |
| D_VDD | 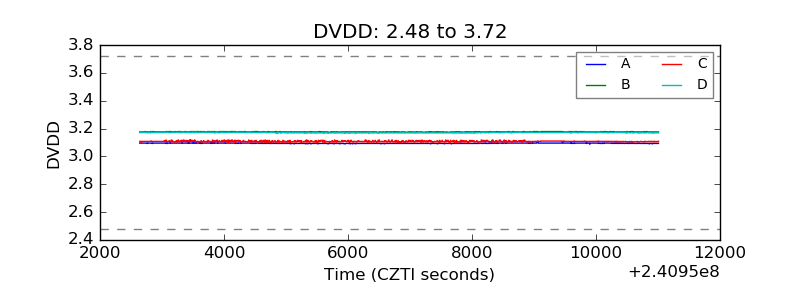 |
| Temperature 1 | 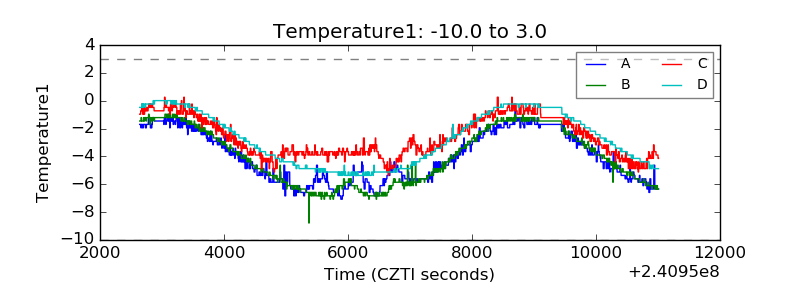 |
| Veto HV Monitor | 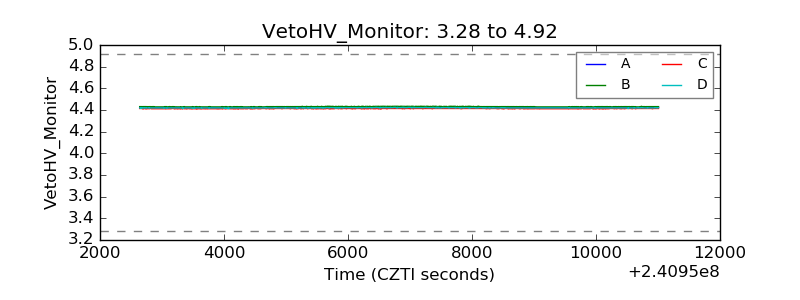 |
| Veto LLD | 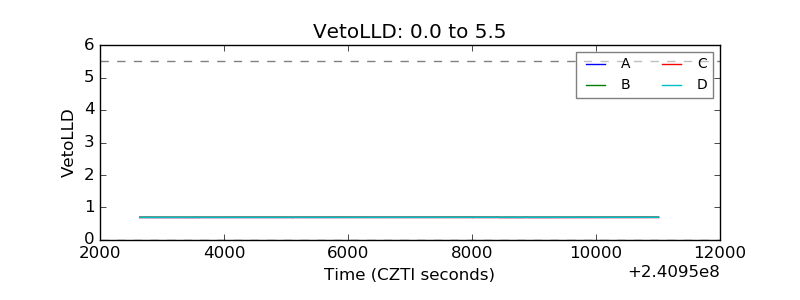 |
| Alpha Counter | 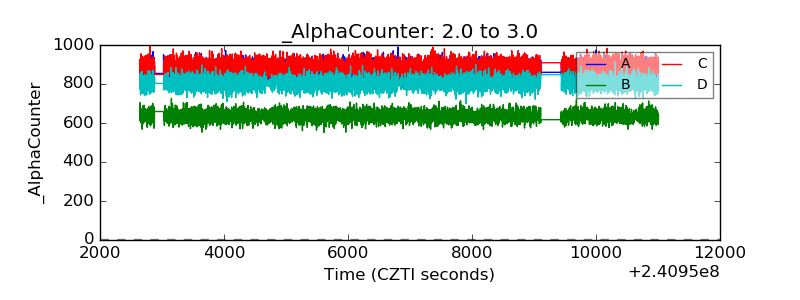 |
| _CPM_Rate | 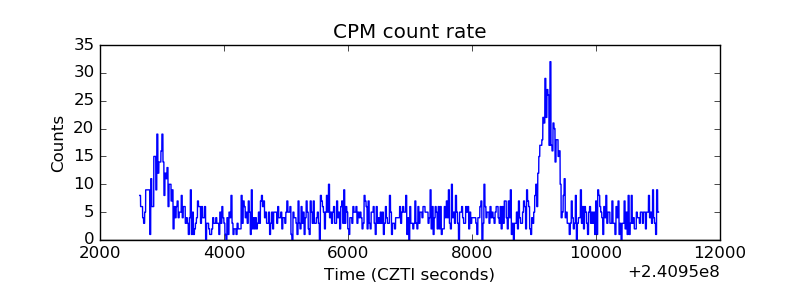 |
| CZT Counter | 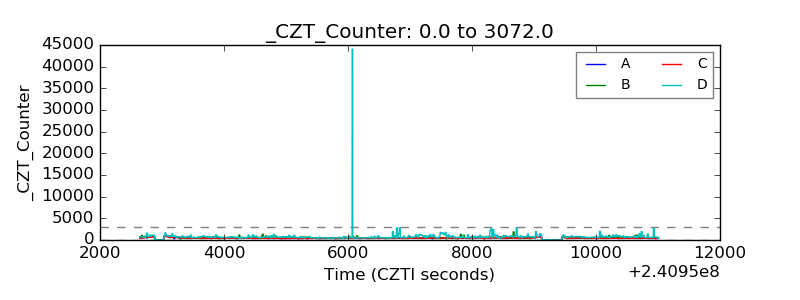 |
| +2.5 Volts monitor |  |
| +5 Volts monitor | 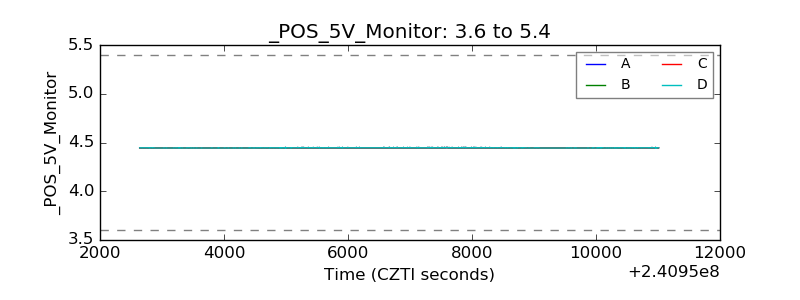 |
| _ROLL_ROT | 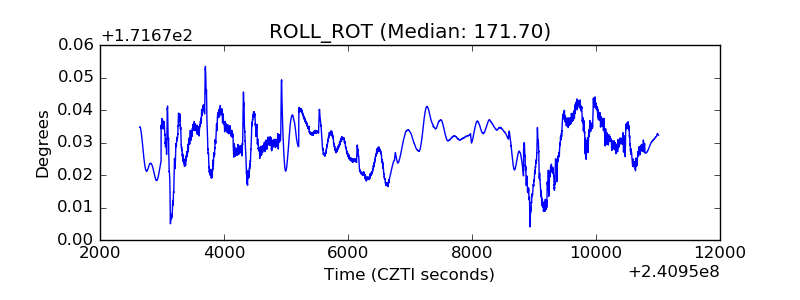 |
| _Roll_DEC | 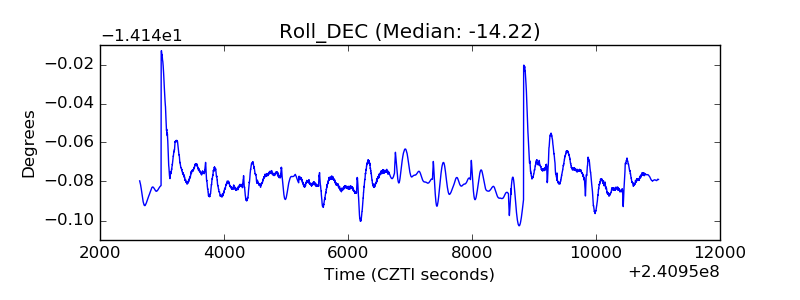 |
| _Roll_RA | 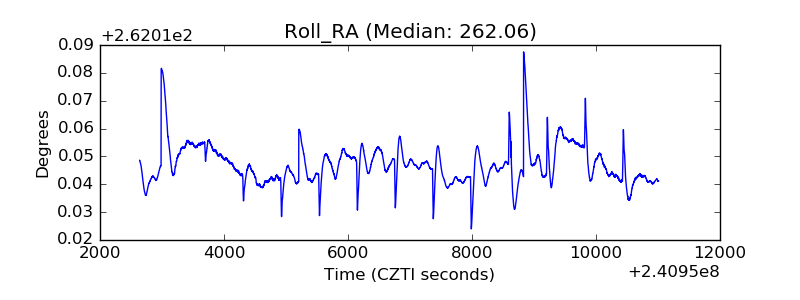 |
| Veto Counter | 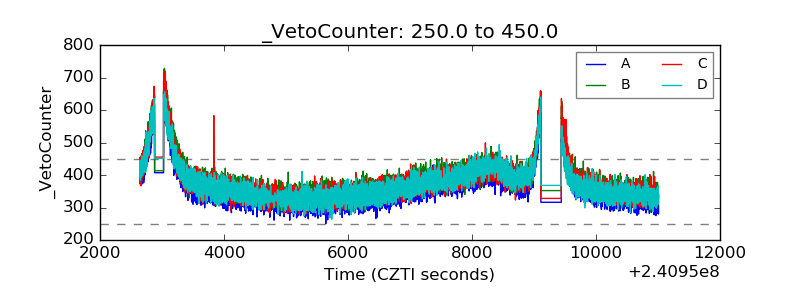 |